Article Text

Abstract
Objectives We aimed to characterise the microbial changes associated with histological stages of gastric tumourigenesis.
Design We performed 16S rRNA gene analysis of gastric mucosal samples from 81 cases including superficial gastritis (SG), atrophic gastritis (AG), intestinal metaplasia (IM) and gastric cancer (GC) from Xi’an, China, to determine mucosal microbiome dysbiosis across stages of GC. We validated the results in mucosal samples of 126 cases from Inner Mongolia, China.
Results We observed significant mucosa microbial dysbiosis in IM and GC subjects, with significant enrichment of 21 and depletion of 10 bacterial taxa in GC compared with SG (q<0.05). Microbial network analysis showed increasing correlation strengths among them with disease progression (p<0.001). Five GC-enriched bacterial taxa whose species identifications correspond to Peptostreptococcus stomatis, Streptococcus anginosus, Parvimonas micra, Slackia exigua and Dialister pneumosintes had significant centralities in the GC ecological network (p<0.05) and classified GC from SG with an area under the receiver-operating curve (AUC) of 0.82. Moreover, stronger interactions among gastric microbes were observed in Helicobacter pylori-negative samples compared with H. pylori-positive samples in SG and IM. The fold changes of selected bacteria, and strengths of their interactions were successfully validated in the Inner Mongolian cohort, in which the five bacterial markers distinguished GC from SG with an AUC of 0.81.
Conclusions In addition to microbial compositional changes, we identified differences in bacterial interactions across stages of gastric carcinogenesis. The significant enrichments and network centralities suggest potentially important roles of P. stomatis, D. pneumosintes, S. exigua, P. micra and S. anginosus in GC progression.
- Gastric cancer
- mucosal microbiome dysbiosis
- oral bacteria
This is an Open Access article distributed in accordance with the Creative Commons Attribution Non Commercial (CC BY-NC 4.0) license, which permits others to distribute, remix, adapt, build upon this work non-commercially, and license their derivative works on different terms, provided the original work is properly cited and the use is non-commercial. See: http://creativecommons.org/licenses/by-nc/4.0/
Statistics from Altmetric.com
Significance of this study
What is already known on this subject?
Chronic inflammation with Helicobacter pylori is a major risk factor for gastric cancer (GC). However, only about 3% of H. pylori-infected people develop GC.
Changes in gastric microbial composition are associated with GC, but the role of bacteria other than H. pylori is yet to be established.
What are the new findings?
We identified differences in microbial diversity and richness between GC and superficial gastritis, atrophic gastritis and intestinal metaplasia, indicating the presence of microbial dysbiosis in gastric carcinogenesis.
Operational taxonomic units (OTUs) whose species identification corresponds to Parvimonas micra, Dialister pneumosintes, Slackia exigua, Peptostreptococcus stomatis, Prevotella intermedia, Fusobacterium nucleatum, Prevotella oris and Catonella morbi were found to be significantly enriched in the GC microbiome compared with precancerous stages and form an increasingly strong co-occurrence network with disease progression.
We observed significant centralities of OTUs corresponding to oral microbes P. stomatis, Streptococcus anginosus, P. micra, S. exigua and D. pneumosintes in GC microbial ecology network, which could be used as biomarkers to distinguish GC from superficial gastritis with an area under receiver-operating curve (AUC) of 0.82.
The GC-associated OTUs and their increasingly strong interactions with disease progression were validated in an independent cohort, in which the five taxonomic biomarkers separated GC from superficial gastritis with an AUC of 0.81.
How might it impact on clinical practice in the foreseeable future?
Our study identified bacterial candidates that may be involved in gastric tumourigenesis and laid a foundation for future studies using bacterial markers for diagnosing GC.
Introduction
Gastric cancer (GC) is the fourth most common malignancy and one of the leading causes of cancer-related deaths worldwide.1 It commonly develops through a multistep process of histological progression from atrophic gastritis (AG) through intestinal metaplasia (IM) to GC.2 Host-related factors, such as ABO blood group, genetic predisposition and environmental factors including microbial infections have been shown to contribute to gastric tumourigenesis.3
Several studies have provided evidences that bacteria, including members of Proteobacteria, Firmicutes, Actinobacteria and Fusobacteria phyla, can be regularly detected in gastric biopsies4 with gastric microbial dysbiosis associated with GC.5–7 In particular, chronic Helicobacter pylori infection, which causes mucosal inflammation and induces histological changes, is recognised as a major risk factor for GC. Nevertheless, only 3% of H. pylori-infected people develop GC,8 implying the importance of other factors in gastric tumourigenesis. Studies have also shown that while normal intestinal microbiota hastened the progression of gastric neoplasia, antimicrobial treatment delayed its onset both in H. pylori-infected and uninfected insulin-gastrin (INS-GAS) mice.9 10 In addition, H. pylori-free INS-GAS mice colonised with intestinal microbiota developed GC more quickly than germ-free mice.9 Taken together, these findings highlight the potential involvement of microbes other than H. pylori in gastric carcinogenesis.
To date, the distribution of gastric microbiome in the development of GC remains largely unclear. It is therefore imperative to unravel the components of gastric microbiome and the significance of specific bacteria that play roles in GC pathogenesis, so as to develop potential prevention and treatment strategies. In this study, we characterised the microbial compositional and ecological changes in mucosal tissue of patients with progressive histological stages along gastric tumourigenesis—from superficial gastritis (SG) through AG and IM to GC. The use of mucosal bacterial taxa as markers for histological classification was also explored.
Materials and methods
Sample collection and DNA preparation
A total of 205 gastric biopsy tissues of different anatomical sites were obtained from 21 SG, 23 AG, 17 IM and 20 GC subjects from Institute of Digestive Diseases, Xijing Hospital, Fourth Military Medical University, Xi’an, China. Samples were obtained from antrum, body and fundus for SG, AG and IM, while biopsies were obtained from sites of cancer lesions and adjacent non-cancerous tissues of GC patients. Additional 143 gastric biopsy tissues from 56 SG, 51 AG and 19 GC patients were obtained from Department of Gastroenterology and Hepatology, Inner Mongolia People’s Hospital, Hohhot, China, for validation. Xi’an is a major city in Western China and is the capital of Shaanxi Province in China. It has a population of 8.55 million consisting of 99.1% Han Chinese. Typical meals in Xi’an include noodles made from wheat flour or rice flour and meats, such as beef and mutton. People in Xi’an also habitually consume spicy foods. Hohhot is the capital of Inner Mongolia in Northern China, with a population of 2.87 million consisting of 88.4% Han Chinese and 8.56% Mongolian. People in Inner Mongolia typically consume meats, especially lamb and food rich in dairy produce such as milk, yoghurt and cheese. According to previous literature, the prevalence of H. pylori in Xi’an was estimated to be 50.8%–53.9%, whereas the prevalence of H. pylori in Inner Mongolia was estimated to be 44.8%–47.5%.11 12
Tissue biopsies from both cohorts were obtained during endoscopy and frozen immediately at −80° C. None of the patients used antibiotics within 2 months nor received preoperative chemotherapy or radiotherapy prior to the collection of biopsy samples. Patients did not take proton pump inhibitors for at least 2 weeks before sample collection. All subjects provided informed consent for obtaining study specimens, and the study was approved by the Clinical Research Ethics Committees of Fourth Military Medical University and Inner Mongolia People’s Hospital. Details of study subjects are provided in online supplementary table S1. Biopsy tissues were disrupted by bead-beating after digesting with mutanolysin and lysozyme enzyme cocktail (Sigma). DNA extraction and purification were performed using QIAamp DNA Mini Kit. Amplicon library for bidirectional (2×250 bp) sequencing on Illumina MiSeq platform was constructed using universal primers 515f, 5′-GTGCCAGCMGCCGCGGTAA-3′ and 806r, 5′-GGACTACHVGGGTWTCTAAT-3′ targeted across 16S rRNA genes V4 hypervariable regions. Library clean-up and normalisation was performed using the Invitrogen SequelPrep Plate Normalization kit according to the manufacturer’s instructions.
Sequence curation and annotation
Quality filtering and analysis of the 16S rRNA gene sequence data were performed with the Mothur software suite as previously described.13 Paired-end reads were merged into contigs using Needleman-Wunsch alignment algorithm with default parameters. Demutiplexed contigs were aligned against SILVA 16S rRNA sequence database (version 123) using NAST algorithm.14 Contigs that mapped outside the alignment coordinates of V4 region were discarded: the remaining sequences were trimmed to fully overlapping regions, merged with more abundant sequences that had a maximum difference of two nucleotide bases and screened for the presence of chimeric sequences using de novo Uchime.15 The resulting sequences were assigned to Greengenes taxa (version 13.8). Any sequences that were classified to members of eukarya, archaea, mitochondria, chloroplast and unknown kingdoms were removed, and the final sequences were clustered into operational taxonomic units (OTUs) using a 97% identity cut-off with the average neighbour clustering algorithm. Species-level identifications for OTUs of interest were determined through blastn searches within the collection of 16S rRNA sequences curated by the National Center for Biotechnological Information (NCBI: database built on 16 June 2016) using default megablast parameters and minimum e-values of 1.0×10⁻⁵. Putative bacterial species were reported for any OTUs with predominant sequences that had greater than 99% sequence identities with those found in the NCBI 16S rRNA sequences database. An average of 37 411 reads per sample were obtained after quality control steps. Sequence count table was rarefied to 18 483 sequences per sample to minimise the effects of uneven sampling. Samples with <1% H. pylori relative abundance were grouped as H. pylori-negative, while samples with >1% H. pylori relative abundance were grouped as H. pylori-positive as previously described.16
Selection of differentially abundant OTUs
Before selecting the OTUs that are differentially abundant across stages of GC, we considered adjusting for potential confounding factors including age, gender, H. pylori status and tissue positions (see online supplementary methods). The OTUs were divided into confounder-sensitive and confounder-insensitive groups using linear regression with adjusted R2 . Auxiliary variables were simulated to help determine the threshold for classifying the OTUs. For confounder-sensitive OTUs, we used logistic regression model with confounding factors included to determine p values of the OTUs’ abundance difference between stages. For confounder-insensitive OTUs, preliminary variable selection was performed with model-free feature screening for ultra-high dimensional data as previously described.17–20 We calculated the significance of selected OTUs through logistic regression with confounding factors included. The abundances of some OTUs are closely correlated with the confounding factors considered, we thus adjusted the OTU’s abundance with respect to the confounding factors (see online supplementary methods). To compare the abundance of oral bacteria across disease stages, we profiled the sequences of all samples against oral bacteria from the Human Oral Microbiome (HOM) database (HOMD 16S rRNA RefSeq version 14.5, Taxonomy File for mothur).21 The abundances of OTUs with 100% sequence identities with those found in the HOM database were compared among disease stages.
Microbial association network analysis
SparCC algorithm,22 a network inference tool designed for compositional data was used to estimate microbial associations across GC stages. Cytoscape V.3.0.4 was used for visualisation of significant co-occurrence and co-excluding interactions (correlation coefficients >0.2 or <−0.2, q<0.05). Weighted node connectivity scores23 were used to measure the centralities of OTU nodes in GC microbial ecology network. In a further step, the significance of the nodes in the network was calculated with permutation test (see online supplementary methods).
Prediction of metagenomic functions
Functional capabilities of mucosal-associated microbiome for each disease stage was predicted using PICRUSt,24 an algorithm that estimates the functional potential of microbial communities given a marker gene survey and a set of sequenced reference genomes. Differentially abundant functional compositions across disease stages were analysed using Lefse algorithm.25 Differences with linear discriminant analysis scores >2.0 and p value <0.05 were considered significant.
Data analysis
Mann-Whitney U test was performed to compare the variables of two sample groups. Multiple group comparisons were made using Kruskal-Wallis test. Fisher’s exact test was performed on categorical variables. p<0.05 was taken as statistical significance. Model-free feature screening for ultra-high dimensional data17–20 and logistic regression were used to screen for differentially abundant OTUs. The p values obtained were adjusted for multiple comparisons by false discovery rate (FDR) method. The corresponding q<0.05 was taken as statistical significance. Tests were performed using R Project for Statistical Computing V.3.3.1. Pathway enrichment analysis was performed using Kyoto Encyclopedia of Genes and Genomes (KEGG) database.
Results
Mucosal microbiome dysbiosis in GC
To determine the dysbiosis associated with stages of GC, we assessed microbial diversity and richness of mucosal biopsy samples via the analysis of 16S ribosomal RNA gene hypervariable V4 regions. Analysis of molecular variance (AMOVA), based on the detection of population differentiation using molecular markers, showed that the genetic diversities of samples from different anatomical positions of all GC stages were not significantly different (see online supplementary table S2). Compared with SG, microbiomes of IM and GC had significantly reduced Chao1-estimated microbial richness (Mann Whitney U test, p=0.045 and 0.041, respectively) (figure 1A). To evaluate the overall differences in beta-diversity, we assessed dissimilarities among all stages using Bray-Curtis and Jaccard distance matrices. While there was no significant difference among SG, AG and IM, AMOVA analysis showed significant differences between the microbiomes in GC and other stages (SG: p=0.018; AG: p=0.031; IM: p=0.0023) (online supplementary table S3). At the phylum level, Fusobacteria was observed to be significantly enriched in GC compared with other disease stages (Kruskal Wallis test, p=0.017). Genera Peptostreptococcus, Dialister and Mogibacterium were also more abundant in GC than in SG, AG and IM (Kruskal-Wallis test, q=0.0021, 0.0068, 0.031, respectively). Taken together, these results indicate a state of dysbiosis in the mucosal microbiome of patients with GC.

Mucosal microbiome dysbiosis across stages of gastric carcinogenesis. Decreased microbial richness, estimated by Chao1, in IM and GC compared with SG (A). Model-free feature screening and logistic regression were used to select differentially abundant bacteria adjusted for age, gender and Helicobacter pylori status. Log2 fold change relative abundances of GC-enriched and GC-depleted bacteria compared with SG, q values <0.05 (B). Significantly increased percentage of oral bacteria were observed in GC compared with SG, AG and IM. AG, atrophic gastritis; GC, gastric cancer; IM, intestinal metaplasia; SG, superficial gastritis (C). (Statistical significance was determined by Mann-Whitney U test, *p<0.05).
Taxonomic alterations in GC microbiome
We used model-free feature screening for ultra-high dimensional data17–20 and logistic regression to screen for differentially abundant bacteria across the disease stages. We adjusted their abundances for potential confounding factors, including age, gender, tissue position and H. pylori status (see section ‘Materials and methods’ and online supplementary methods). The abundances of 31 bacterial taxa were found to be significantly different between GC and SG after multiple-testing FDR correction. Compared with SG, 21 bacterial taxa were enriched in GC, while 10 bacterial taxa were depleted in GC (figure 1B). The GC-enriched bacterial taxa include Peptostreptococcus_OTU16 (q=0.03), Streptococcus anginosus_OTU68 (q=0.033), Slackia_OTU174 (q=0.033), Gemella_OTU17 (q=0.033), Fusobacterium_OTU33 (q=0.04), etc. (figure 1B, online supplementary table S4). Bacterial taxa that were depleted in GC include Vogesella_OTU661 (q=0.03), Candidatus_Portiera_OTU1596 (q=0.041), Comamonadaceae_OTU85 (q=0.033), Acinetobacter_OTU369 (q=0.045), etc. (figure 1B, online supplementary table S4). Among the GC-enriched bacterial taxa, 19 were significantly more abundant in GC than AG, while seven taxa were significantly more abundant in GC than IM. The differentially abundant OTUs and their representative sequences are provided in online supplementary tables S4–7, while their relative abundances across all stages are shown in online supplementary figure S1.
Next, we investigated the mucosal microbiome changes in GC lesions compared with the adjacent noncancerous mucosae. Only one bacterial taxa overlapped with the result obtained from GC vs SG, namely Comamonadaceae_OTU85, which was depleted in GC lesions compared with adjacent non-cancerous mucosae (q=0.024). We further determined the taxa that may potentially play role in the early stages of gastric tumourigenesis. Seven bacterial taxa were significantly over-represented in IM compared with SG. These include Pseudomonas_OTU58 (q=0.037) and Dyella_OTU1056 (q=0.034) (online supplementary table S5).
Enrichment of oral microbes in GC
Studies have linked oral bacteria with diseases including colorectal and pancreatic cancers.26 27 To assess the association of oral bacteria with GC, we determined the overall distribution of oral microbes across stages of GC by profiling sequences of all samples against HOM database.21 Indeed, significantly higher abundance of oral bacteria were observed in GC than in all the other stages. Oral bacteria were more abundant in GC compared with IM (Mann-Whitney U test, p=0.0102), AG (Mann-Whitney U test, p=0.024) and SG (Mann-Whitney U test, p=0.015) (figure 1C). Our observation agreed with previous reports that show the over-representation of oral microbes in inflammatory bowel diseases, pancreatic cancer and colorectal cancer.26–28
Correlation strengths of GC-enriched and GC-depleted bacteria increased with disease progression
After correcting for spurious correlations and FDR adjustments, we observed that both co-occurrence and co-excluding interactions among GC-enriched and GC-depleted OTUs were significantly different across the stages—progressively stronger towards carcinogenesis. The interactions were significantly stronger in AG than in SG (Mann-Whitney U test, p=0.0001), despite no significant difference in the abundance of these bacteria between the two stages. In addition, the interactions were stronger in IM than in SG (Mann-Whitney U test, p<0.0001) and in GC than all precancerous stages (IM (Mann-Whitney U test, p<0.0001), AG (Mann-Whitney U test, p<0.0001), SG (Mann-Whitney U test, p<0.0001) (figure 2). In particular, a GC-enriched OTU, Lactobacillus_OTU12, with species level identification as a known probiotic Lactobacillus salivarius (supplementary table 4),29 was found to exhibit co-excluding interactions with Slackia_OTU174,Hydrogenophaga_OTU246 and Moryella_OTU294 in SG (q=0.0427, <0.0001 and 0.02 respectively) and AG (q=0.0139,<0.0001 and 0.025 respectively), while it had co-occurrence interaction with Lactobacillus_OTU45, with species level identification as another probiotic bacterium Lactobacillus fermentums 30 in SG (q<0.0001), AG (q<0.0001) and GC (q<0.0001). We observed that some co-excluding interactions occurred only at GC and other precancerous stages (AG and IM) but absent in SG. These include co-excluding interactions of: Comamonadaceae_OTU85 with Slackia_OTU174, Prevotella_OTU148, Moryella_OTU294 and Streptococcus_OTU5; Acinetobacter_OTU369 with Alloprevotella_OTU115, Veillonellaceae_OTU586 and Gemella_OTU17; and Lactobacillus_OTU12 with Peptococcus_OTU256 (figure 2).

Correlation strengths of gastric cancer (GC)-enriched and GC-depleted bacteria increased with disease progression. Correlation networks of GC-enriched and GC-depleted operational taxonomic units (OTUs) in: superficial gastritis, atrophic gastritis, intestinal metaplasia and GC. SparCC algorithm was used to estimate correlation coefficients and adjust for compositional effects. Cytoscape V.3.4.0 was used for network construction. A subset of significant correlations with strengths of at least 0.2 were selected for visualisation. The size and colour of the nodes correspond to weighted node connectivity (WNC) scores). Peptostreptococcus_OTU16 (3), Parvinomonas_OTU35 (6) and Streptococcus_OTU68 (8), Dialister_OTU151 (13), Slackia_OTU174 (14) have significant WNC scores (p<0.05).
Significant centralities of oral bacteria in GC ecological network
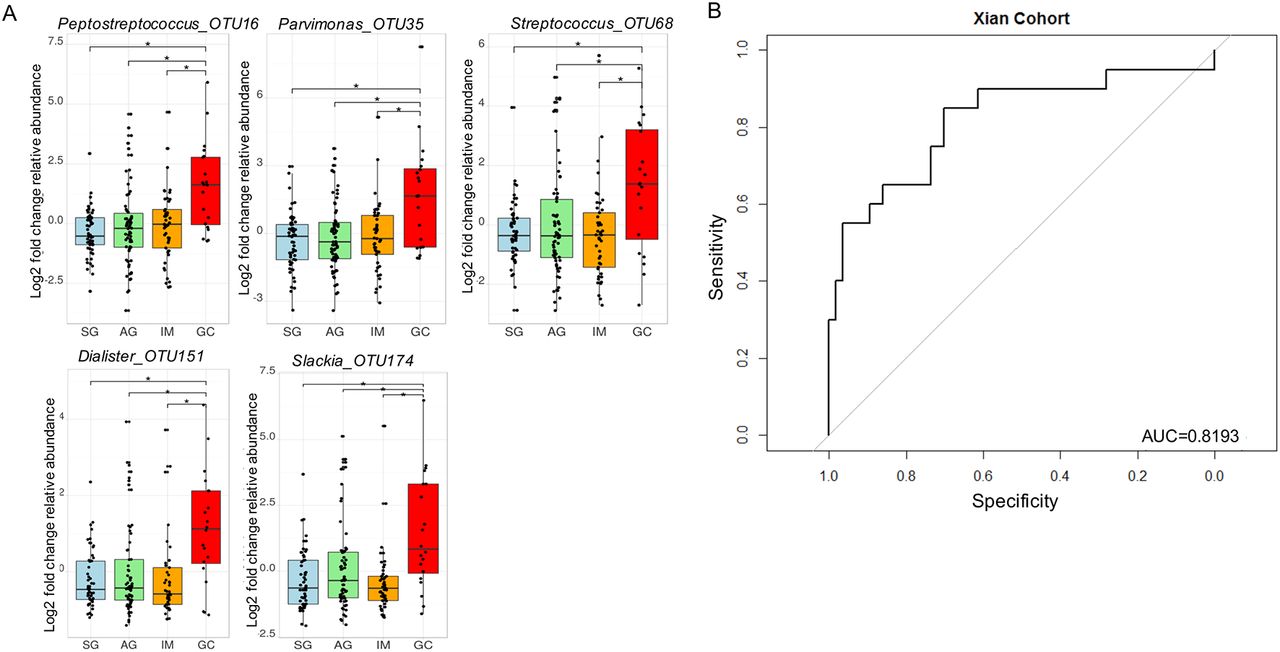
To identify biomarkers that could have more general applicability, we sought to determine bacteria with significant roles in GC microbial ecological network. Interestingly, only five GC-enriched OTUs had significant WNC scores, indicating significant centralities and showing that they are the most significant in the GC interaction network. These are Peptostreptococcus_OTU16 (p<0.0001), Streptococcus_OTU68 (p=0.012), Parvimonas_OTU35 (p=0.029), Slackia_OTU174 (p=0.0046) and Dialister_OTU151 (p=0.038). Their centralities suggested that they can form a backbone of niche-specific relationships and might exhibit significant influence on GC microbial ecology. Species level identification of these OTUs showed that they putatively correspond to Peptostreptococcus stomatis, Streptococcus anginosus, Parvimonas micra, Slackia exigua and Dialister pneumosintes (online supplementary table S4), which interestingly, are members of the HOM. Their distributions across GC stages after confounding factor adjustments are shown in figure 3A. As a further step to confirm that these OTUs can confidently differentiate between SG and GC, we performed receiver-operating characteristic analyses. These markers distinguished GC from SG with an area under the receiver-operating curve (AUC) of 0.82 (figure 3B).

Gastric cancer enriched markers with significant centralities. Fold change analyses of gastric cancer-enriched markers with significant weighted node connectivity scores in microbial association network, figure 1. p values were adjusted by FDR method, *q<0.05 (A). The diagnostic performance of Peptostreptococcus_OTU16 Parvinomonas_OTU35, Streptococcus_OTU68, Dialister_OTU151 and Slackia_OTU174 indicated by receiver operating characteristic curve analysis in discovery cohort, area under the receiver-operating curve of 0.82 (B). AG, atrophic gastritis; GC, gastric cancer; IM, intestinal metaplasia; SG, superficial gastritis.
Alteration of microbial interactions is associated with H. pylori infection in SG, AG and IM
H. pylori has been reported to alter gastric microbiome structure.31 However, its influence on microbial interactions has not been investigated. Several studies have shown that biopsy samples identified as H. pylori-negative by conventional methods were discovered to contain H. pylori sequences.16 32 In fact, about 60% of samples that were H. pylori negative by combination of conventional methods were found to be positive by pyrosequencing method.16 These highlight the use of pyrosequencing as a more sensitive method for the detection of H. pylori infection. Thus, to evaluate the effect of H. pylori on microbial interactions, we assigned samples to two groups; samples with <1% H. pylori relative abundance were grouped as H. pylori-negative, while samples with >1% H. pylori relative abundance were grouped as H. pylori-positive as proposed recently.16 Equal number of samples, matched for age and gender were assigned to each group (online supplementary table S8). OTUs with average relative abundance >0.01% and present in all samples were included in interaction analysis. Significantly more interactions were seen among gastric microbes in H. pylori-negative than H. pylori-positive samples in SG, AG and IM (Fisher’s exact test, p<0.0001) (figure 4, online supplementary table S9). However, no difference was observed in taxonomic diversity or richness in the gastric microbes between H. pylori-positive and H. pylori-negative samples within each disease stage. We further investigated gastric microbes that could interact with H. pylori across stages of gastric tumourigenesis. We observed that H. pylori had co-excluding and co-occurring interactions, respectively, with Methylobacillus_OTU44 (q=0.027) and Arthrobacter_OTU108 (q=0.023) in SG. In IM, it had co-excluding interactions with members of the Firmicutes phylum, including Ruminococcus_OTU142. (q=0.016), Bacillales_OTU80 (q=0.0093), SMB53_OTU39 (q=0.038) and Lactobacillus_OTU23 (q=0.016), while it exhibited co-occurrence with Prevotella_OTU29 (q=0.029), Moryella_OTU294 (q=0.038) and another helicobacter, H. ganmani_OTU87 (q=0.0047). No significant interaction was found with H. pylori in AG and GC. Among the 31 GC-enriched and GC-depleted OTUs, significantly weaker interactions were observed in H. pylori-positive compared with H. pylori-negative samples in SG (Mann-Whitney U test, p=0.013) and IM (Mann-Whitney U test, p<0.0001), but not in AG. The representative sequences of these OTUs are provided in online supplementary table S10.

Helicobacter pylori infection reduces the number of gastric microbiome interactions. Correlation strengths of gastric cancer-enriched and gastric cancer-depleted bacteria in Helicobacter pylori negative (HPN) and Helicobacter pylori positive (HPP) samples: superficial gastritis (HPN: n=12; HPP: n=12), atrophic gastritis (HPN: n=22; HPP: n=21), intestinal metaplasia (HPN: n=18; HPP: n=18), gastric cancer (HPN: n=7; HPP: n=7). SparCC algorithm was used to estimate correlation coefficients and adjust for compositional effects. (Statistical significance was determined by Fisher’s exact test).
Identification of microbiome functional capacity changes in GC
The functional capacity of the mucosal-associated microbiome for each disease stage was predicted using PICRUSt.24 The functional changes in the GC microbiomes included significantly increased representation of predicted KEGG pathways involved in nucleotide metabolism, carbohydrate digestion and absorption and bacterial ion channels compared with other disease stages (p=0.035, 0.048, 0.045, respectively). We observed a switch towards purine metabolism, D-alanine metabolism, drug metabolism, RNA polymerase, peptidoglycan biosynthesis, gluconeogenesis, phosphotransferase system, fructose and mannose metabolism, peptidases and DNA recombination and repair proteins in GC compared with SG (p<0.05). Bacterial proteins involved in motility, two component system and chemotaxis, were enriched in SG (p=0.049, 0.032, 0.023 respectively) compared with AG, IM and GC. Differential predicted functions across all stages and the nearest sequence taxon index (NSTI) scores are shown in online supplementary tables S11–17. The low NSTI scores (0.02–0.13) indicate a reasonable accuracy of prediction.24
Validation of GC-associated microbial compositional changes and interactions in an independent cohort
To validate the GC-enriched and GC-depleted OTUs, their relative abundances were determined in an independent Chinese Inner Mongolian cohort of 143 samples from 126 patients, namely 56 SG, 51 AG and 19 GC subjects. We demonstrated a statistically significant positive correlation of fold changes for the 31 OTUs with discovery cohort (Pearson correlation coefficient r=0.506, p=0.0044) (figure 5A). Additionally, the increasing strengths of interaction among the GC-associated OTUs towards carcinogenesis were replicated. Correlation strengths were stronger in GC than SG (p<0.0001) and AG (p<0.0001) in the validation cohort. Consistent with the discovery cohort, the five biomarkers—Peptostreptococcus_OTU16, Streptococcus_OTU68, Parvimonas_OTU35, Slackia_OTU174 and Dialister_OTU151 distinguished GC from AG with AUC of 0.81 (figure 5B). The enrichment of proteins involved in nucleotide/purine metabolism, carbohydrate digestion and absorption and peptidoglycan biosynthesis were also observed in GC compared with SG (p=0.0143, <0.0001, <0.0001 respectively) as observed in the discovery cohort. Signal transduction, chemotaxis and motility proteins were also validated as enriched ontology categories in SG compared with AG and GC (p=0.021, 0.0031 and 0.0029 respectively). The differential predicted functions across GC stages in Inner Mongolian cohort and the NSTI scores (0.016–0.13) are shown in online supplementary tables S18–24.

Validations of GC associated bacteria in independent cohort. Correlations of the fold changes of gastric cancer (GC)-enriched and GC-depleted bacteria compared with superficial gastritis (SG) between Xi’an (discovery) and Inner Mongolia (validation) cohorts. Spearman correlation coefficient r=0.506, p=0.00437 (A). The diagnostic performance of Peptostreptococcus_OTU16, Parvinomonas_OTU35, Streptococcus_OTU68, Dialister_OTU151 and Slackia_OTU174 indicated by receiver operating characteristic curve analysis in validation cohort, area under the receiver-operating curve of 0.81 (B).
Discussion
Microbiome imbalances have been linked to many gastrointestinal and systemic diseases including cancers.33 The overall knowledge on the roles of gastric microbes apart from H. pylori in GC is still limited, despite evidences of potential roles of non-H. pylori bacteria in GC. In this study, we observed significant microbiome dysbiosis along different stages of gastric tumourigenesis, with significant enrichments of oral bacterial taxa forming niche-specific interactions that became increasingly stronger towards carcinogenesis. There are inconsistent reports about changes in gastric microbiome compositions across stages of gastric carcinogenesis in terms of microbial diversity and richness.5–7 The discrepancy may be due in part to different variables affecting gut microbiome composition, such as gender, age, ethnicity and H. pylori infection.4 34 35 To overcome some of these factors, we adjusted OTU abundances for potential confounders, including age, gender and H. pylori status. Also, for a detailed gastric microbial structure, we collected samples from three anatomical gastric positions and demonstrated their similarities in terms of microbial diversity and richness.
Interestingly, from our species level classifications, we observed that 14 of the 21 GC-enriched bacterial taxa are putative known members of the oral microbiome, including P. micra, P. stomatis, Fusobacterium nucleatum and Gemella and are reportedly associated with CRC.27 The over-representation of these bacteria in GC expands the current knowledge about their association with gastrointestinal cancers. In addition, we found that S. anginosus_OTU68 was enriched in GC. This is supported by a previous finding that identified the increased abundance of S. anginosus DNA in gastric mucosa samples of GC patients36 and another study that showed the association of S. anginosus with oesophageal cancers.37 S. anginosus is a sulfate-reducing bacterium involved in colonic sulphur metabolism and have been shown to induce inflammatory cytokines in oesophageal epithelial cells.38 These reports, in addition to the observation in this study highlight the probable role of this oral bacterium in various forms of cancer and warrant further investigations to delineate its role as either a driver or passenger in carcinogenesis. Importantly, we identified some previously unreported GC-associated bacteria. Although S. infantis and P. oris corresponding to S. infantis_OTU5 and Prevotella_OTU148 (online supplementary table S4), respectively, were previously identified in multifocal AG with IM,39 we show their enrichments in GC for the first time in this study.
Oral bacteria are associated with several diseases, including inflammatory bowel diseases, CRC and pancreatic cancer, which has attracted much attention.26–28 We observed significantly higher abundance of oral bacteria in GC than in all other benign stages. Additional epidemiological studies and biofunctional assays are required to reveal the cause and effect relationship between oral bacterial and GC. While no study has directly analysed changes in oral microbiome in GC patients, some studies have associated periodontal diseases, an indicator of oral microbial dysbiosis,40 with GC.41 Oral microbial dysbiosis has also been reported in pancreatic cancer and indicated as a potential diagnostic tool.42 The potential use of oral microbes for non-invasive diagnosis of GC awaits further studies.
Community-wide virulence properties should be taken into account when considering the involvements of microbiome in gastrointestinal diseases. Association of biofilm-forming bacteria communities have been described with capacities to promote cancer by metabolism modulation.43 44 As such, niche-specific microbial networks may also reflect disease-specific microenvironment.28 We observed increasing strengths of co-occurring and co-excluding interactions among GC-enriched and GC-depleted bacteria with disease progression. In particular, the observed significant centralities of Peptostreptococcus_OTU16 (P. stomatis), Slackia_OTU174 (S. exigua), Parvimonas_OTU35 (P. micra), S. anginosus_OTU68 and Dialister_OTU151 (D. pneumosintes) highlight the potential roles of members of oral pathogenic taxa in GC and add to previous observations in other forms of cancer. It also shows that disease-associated bacteria can form a synergistic network that may result in additional contribution towards disease. The five bacterial markers may serve as potential diagnostic tissue markers for GC as demonstrated by AUCs of 0.82 and 0.81 in the discovery and validation cohorts respectively. Additional comparative analysis of gastric microbiome and saliva samples will be a step forward in the probable use of these bacteria for diagnostic purposes. Only one bacterium was found to agree in abundance when SG versus GC and GC versus cancer-adjacent non-cancerous mucosae were compared. This may be an indication that certain degree of dysbiosis might have occurred in the greater environment of GC lesions. Furthermore, we showed that the gastric microbiome in cardia and non-cardia GC samples are similar. The role of H. pylori as a primary aetiology of type-3 oesophagogastric junction adenocarcinoma was reported to be of equal importance as for distal gastric cancer, suggesting similar microbiome profile between cardia and distal parts of the stomach.45 This agrees with the observation in this study.
The effects of H. pylori on the diversity, richness and interactions of microbes at different disease stages were investigated. While decreases in phylotype richness, diversity and evenness in gastric biopsies of H. pylori-positive compared with H. pylori-negative samples from chronic gastritis patients have been reported, no difference in taxonomic diversity and evenness was observed.46 These agree with observations in this study. Our analysis extended previous works by including progressive stages of gastric cancer—AG, IM and GC—and suggests no effect of H. pylori on diversity and richness of gastric microbiome. However, we observed significantly reduced number of interactions among gastric microbes at all stages. In addition, weaker interactions between GC-enriched and GC-depleted OTUs were observed in the presence of H. pylori in SG and IM. These indicate the potential of H. pylori in altering microbial interactions.
The metabolic potential of gut microbes has been shown to modulate host metabolism in health and disease. We observed some predicted functional shifts that may reflect compositional differences between SG and GC. Studies have shown that purines are intracellular and abundant biochemical components in the tumour microenvironment, modulating immune cell responses and cytokine release.47 Our observation of purine-metabolising proteins enrichment in GC suggests the metabolism of released purines in tumour microenvironment by GC microbiome. Interestingly, we observed the enrichments of bacterial carbohydrate digestion and absorption in both discovery and validation cohorts. Increase in this pathway is predictive of bacterial production of short chain fatty acids by gut microbiome,48 which have been linked to hyperproliferation of cells in both CRC and oesophageal cancer.49 50 The enrichment of this pathway in GC thus highlights its potential contribution to gastric tumourigenesis. Furthermore, pathways involved in peptidoglycan biosynthesis have been reported to modulate inflammation in neoplasms by enhancing cell permeability in the intestines.51 The association of peptidoglycan biosynthesis with GC in this study supports the role that this pathway may play in tumour development and supports previous observation in CRC.28 Several pathways that may contribute to recognition by host cells were seen depleted in GC. Such pathways include bacterial signal transduction, chemotaxis and cell motility. Further investigations into the implications of microbiome functional dysbiosis in GC are needed for deeper understanding of gastric tumourigenesis.
The relatively high pH of the gastric lumen due to chronic inflammation, microbial metabolic products and other factors can contribute to increased growth of extragastric microbes. Thus, this study could not directly conclude whether the GC-enriched bacteria are passengers or drivers of gastric carcinogenesis. Nonetheless, they represent candidates of interests for targeted studies. Importantly, our findings were further validated in an independent cohort.
In conclusion, our study identified previously unreported GC-associated bacteria. We showed that members of oral pathogenic taxa were over-represented and formed strong co-occurrence network in GC compared with other precancerous stages. Network analysis suggests that oral microbes P. stomatis, S. exigua, P. micra, S. anginosus and D. pneumosintes might play key roles in gastric carcinogenesis. Additional analysis investigating potential oral microbial dysbiosis in GC patients are warranted to delineate the use of these microbes as non-invasive biomarkers in GC diagnosis.
References
Footnotes
OOC, ZD, YN and GZ are co-first authors.
Contributors OOC and ZD analysed data and drafted the manuscript. YN and GZ collected human samples. LC and GN organised the data and performed DNA isolation. WKKW, SHW and JJYS commented on the study and revised the manuscript. JY designed and supervised the study and revised the paper.
Funding This project was supported by RGC GRF Hong Kong (766613, 14106415, 14111216), 135 program project China (2016YFC1303200), 973 Program China (2013CB531401), the National Key Technology R&D Program (2014BAI09B05), Shenzhen Virtual University Park Support Scheme to CUHK Shenzhen Research Institute.
Competing interests None declared.
Patient consent Obtained.
Ethics approval Institutional Review Board.
Provenance and peer review Not commissioned; externally peer reviewed.