Article Text

Abstract
Objectives Yttrium-90 (Y90)-radioembolisation (RE) significantly regresses locally advanced hepatocellular carcinoma and delays disease progression. The current study is designed to deeply interrogate the immunological impact of Y90-RE, which elicits a sustained therapeutic response.
Design Time-of-flight mass cytometry and next-generation sequencing (NGS) were used to analyse the immune landscapes of tumour-infiltrating leucocytes (TILs), tumour tissues and peripheral blood mononuclear cells (PBMCs) at different time points before and after Y90-RE.
Results TILs isolated after Y90-RE exhibited signs of local immune activation: higher expression of granzyme B (GB) and infiltration of CD8+ T cells, CD56+ NK cells and CD8+ CD56+ NKT cells. NGS confirmed the upregulation of genes involved in innate and adaptive immune activation in Y90-RE-treated tumours. Chemotactic pathways involving CCL5 and CXCL16 correlated with the recruitment of activated GB+CD8+ T cells to the Y90-RE-treated tumours. When comparing PBMCs before and after Y90-RE, we observed an increase in tumour necrosis factor-α on both the CD8+ and CD4+ T cells as well as an increase in percentage of antigen-presenting cells after Y90-RE, implying a systemic immune activation. Interestingly, a high percentage of PD-1+/Tim-3+CD8+ T cells coexpressing the homing receptors CCR5 and CXCR6 denoted Y90-RE responders. A prediction model was also built to identify sustained responders to Y90-RE based on the immune profiles from pretreatment PBMCs.
Conclusion High-dimensional analysis of tumour and systemic immune landscapes identified local and systemic immune activation that corresponded to the sustained response to Y90-RE. Potential biomarkers associated with a positive clinical response were identified and a prediction model was built to identify sustained responders prior to treatment.
- Y90 radioembolization
- Time-of-flight Mass Cytometry (CyTOF)
- hepatocellular carcinoma
- tumor microenvironment
- immune activation
- biomarkers
- chemotaxis
This is an open access article distributed in accordance with the Creative Commons Attribution Non Commercial (CC BY-NC 4.0) license, which permits others to distribute, remix, adapt, build upon this work non-commercially, and license their derivative works on different terms, provided the original work is properly cited and the use is non-commercial. See: http://creativecommons.org/licenses/by-nc/4.0/
Statistics from Altmetric.com
- Y90 radioembolization
- Time-of-flight Mass Cytometry (CyTOF)
- hepatocellular carcinoma
- tumor microenvironment
- immune activation
- biomarkers
- chemotaxis
Significance of this study
What is already known about this subject?
Yttrium-90 (Y90)-radioembolisation (RE) is a treatment for locally advanced hepatocellular carcinoma (HCC) that is not eligible for surgical resection or transplantation.
Despite the short half-life of Y90, Y90-RE can induce a delayed and sustained therapeutic response in some patients.
The basis of an immunological response that may underlie this sustained therapeutic response after Y90-RE is not well understood.
What are the new findings?
By time-of-flight mass cytometry and next-generation sequencing, we detected immune activation in the local microenvironment of Y90-RE-treated tumours and infiltration of multiple immune subsets.
Immunomonitoring of peripheral blood before and after Y90-RE identified systemic immune activation, particularly in patients showing sustained therapeutic response to Y90-RE.
Systemic immune profiles of the pretreatment peripheral blood could be used as a predictive biomarker for a sustained therapeutic response to Y90-RE.
How might it impact on clinical practice in the foreseeable future?
Immune activation of the local HCC microenvironment after Y90-RE suggests that combination of Y90-RE and immunotherapy could improve clinical outcomes.
A prediction model to select patients who are most likely to positively respond to Y90-RE could be used in the future clinical setting.
Introduction
Hepatocellular carcinoma (HCC) is a highly malignant disease, and the third most common cause of cancer-associated deaths worldwide.1 The most effective therapeutic options for HCC are tumour resection or liver transplantation, but these are limited to early stage disease.2 The majority of the patients who have locally advanced disease are treated with locoregional therapies such as transarterial chemoembolisation or Yttrium-90 (Y90)-radioembolisation (RE), also known as selective internal radiation therapy (SIRT).3
HCC receives its blood supply predominantly through branches of the hepatic artery.4 Y90-coated microspheres are delivered directly into HCC via transarterial catheter under radiologic guidance. This precise mode of delivery spares the non-malignant liver parenchyma making Y90-RE an ideal brachytherapy for HCC.5 Y90-RE has been shown to elicit a disease-control by tumour-downstaging and delayed disease progression.4 6 The half-life of the Y90-isotope is ~64.2 hours, but maximal clinical response, including, tumour regression and decrease in serum α-fetoprotein (AFP), is only seen 3–6 months after treatment.7 The mechanisms that underlie this delayed, yet long-lasting antitumour effect remain elusive.
Previous studies have suggested that an active immune response8 and interactions with the tumour microenvironment9 mediate the clinical manifestations of radiotherapy. For instance, ionising radiation can induce modest inflammation in the tumour microenvironment, as evidenced by the upregulation of chemokines and cytokines in murine models and cell lines.10 11 In-depth understanding of the impact of radiotherapy on local and systemic immune system in patients with cancer, however, remains to be elucidated.
Here, we analysed the immune profile of surgically resected HCC, which has been downstaged by Y90-RE. We used time-of-flight mass-cytometry (CyTOF) for high-dimensional, in-depth immunophenotyping.12 13 We identified key antitumour immune responses induced by the Y90-RE that we propose underlie the clinical response. Next-generation sequencing (NGS) of tumour tissues from patients after Y90-RE identified activation of multiple immune subsets and a potential pathway that induces the recruitment of activated CD8+ T cells. We also examined the immune profiles of the peripheral blood mononuclear cells (PBMCs) from patients before and at various time points after Y90-RE and identified key immune subsets, including CD8+ T cells and CD4+ T cells expressing the checkpoint receptors progressive disease-1 (PD-1) and Tim-3 and homing receptors CCR5 and CXCR6 in those who responded to Y90-RE. In addition, a prediction model was built using the immune profile of pretherapy PBMCs to identify potential sustained responders (SRs) to Y90-RE.
Materials and methods
Patients and sample processing
Tumour tissues and blood samples were obtained from a total of 41 patients with HCC from the National Cancer Center Singapore and Singapore General Hospital, who underwent surgical resection for HCC with or without prior Y90-RE therapy. Tumour-infiltrating leucocytes (TILs) were isolated from the resected HCC tissue of 14 patients (see online supplementary table S1) by enzymatic digestion, as previously described.14 PBMCs were isolated from blood taken before (pre) and at various time points (1, 3 and 6 months) after Y90-RE from another cohort of 31 HCC patients (see online supplementary table S2, included 4 patients with HCCsubsequently resected after Y90-RE and their TILs analysed and included in online supplementary table S1) using conventional Ficoll (GE Healthcare, UK) isolation methods according to manufacturer’s instructions. The Response Evaluation Criteria in Solid Tumours 1.1 guidelines15 was used to evaluate tumour response. SRs were defined as patients without any PD (non-PD) by 6 months (180 days) after Y90-RE, while the non-responders (NRs) never had a minimal response of stable disease (SD) even at 3 months or transient responders (TRs) who had an initial response at 3 months but progressed by 6 months after Y90-RE (see online supplementary table S2). All patients provided informed consent.
Supplementary file
Time-of-flight mass-cytometry
TILs and PBMCs were analysed with 37 metal-conjugated antibodies (see online supplementary table S3) using CyTOF as previously described.12 Briefly, immune cells were thawed and unstimulated or stimulated for 5 hours with phorbol 12-myristate 13-acetate (PMA) and Ionomycin (Sigma), and Brefeldin A and Monesin (eBioscience) was added during the last 3.5 hours of the incubation. The cells were then washed and stained with cisplatin viability stain (DVS Sciences, USA) and antihuman CD45 leucocyte marker conjugated with lanthanide metal-89, 115 and 172, respectively—a triple-barcode system as previously described.16 The barcoded immune cells were combined and then stained with antibodies targeting surface markers. Cells were fixed with 1.6% paraformaldehyde and permeabilised in 100% methanol to permit intracellular antibody staining. Finally, a DNA intercalater (DVS Sciences) was added for cellular visualisation before analysis on a Helios mass cytometer (Fludigm, USA).
The Helios-generated output files were normalised using EQTM Four Element Calibration Beads (Fluidigm) according to manufacturer’s instructions17 and de-barcoded manually by Boolean Gating strategy in FlowJo (V.10.2; FlowJo, USA). Each sample was down-sampled to 10 000 live immune cells and equal number of samples were selected for each group before analysis using an in-house developed Multi-dimensional Automated Reduction and Visualisation (MARVis) software based on the combination of Barnes-Hut SNE non-linear dimension reduction algorithm and a k-means clustering algorithm.12 18Cellular and nodal views of two-dimensional (2D) t-Distributed Stochastic Neighbour Embedding maps and density plots for the expression of individual markers in each node were generated simultaneously. Nodes that were significantly enriched (P<0.05) in either group were identified by paired or unpaired Mann-Whitney U test. All data were validated independently using FlowJo. 2D heat maps were plotted based on all significant nodes using R script for data visualisation.
Next-generation sequencing
Tumour tissue from each patient was preserved in RNA Later (Thermo Fisher Scientific, USA) and stored at −80°C until further processing. RNA was isolated using the mirVana miRNA Isolation Kit (Thermo Fisher Scientific) and cDNA was generated with the SMART-Seq v4 Ultra Low Input RNA Kit for Sequencing (Clontech, USA), according to manufacturers’ protocols. Illumina-ready cDNA libraries were generated from amplified cDNA using the Nextera XT DNA Library Prep Kit (Illumina, USA) and multiplexed for 2×101 bp-sequencing. NGS was performed externally at the Genome Institute of Singapore on a HiSeq high output platform.
Raw-sequencing reads were mapped via Hierarchical Indexing for Spliced Alignment of Transcripts with reference to the Human Assembly GRCh38.p7. from Ensembl. Read alignments were then sorted using SAMtools and the raw gene counts were extracted with high-throughput sequencing data (HTSeq).19 The R package EdgeR tool was used for differential gene expression analysis between two sample groups. The empirical Bayes quasi-likelihood F-test was used in the Generalised Linear Model pipeline for gene-wise statistical analysis.20 Genes with a fold-change >2 and P<0.01 were selected. The data were then visualised in heat maps using R-Script and biological function analysis on enriched genes in post-Y90-RE tumours was performed using the Database for Annotation, Visualization and Integrated Discovery (DAVID) V.6.7 Functional Annotation Tool based on P<0.01 and Benjamini <0.05 selection criteria. Additional functional pathway analysis of enriched genes was carried out using the Reactome Pathway Database.21
Quantitative PCR
RNA from tumour tissues was isolated as described above and cDNA conversion was performed using SuperScript IV Reverse Transcriptase (Thermo Fisher Scientific) according to the manufacturer’s instructions. Primer sequences for target genes are provided in online supplementary table S4. qPCR was performed using LightCycler480 SYBR Green-I Master (Roche, Switzerland) and data were collected using a LightCycler480-II (Roche). Technical triplicates were performed and results were normalised against GAPDH expression to obtain an average of relative gene expression.
Prediction modelling algorithm
Random Forests algorithm was used for building the model to predict the clinical response to Y90-RE.22–24 Single-cell CyTOF data (10 000 single cells with 37 markers expressions) from n=22 randomly selected patients was used for algorithm tuning and training and then tested on an independent testing cohort of n=8 patients. Caret25 and Ranger26 packages in R were used in the tuning and training of the random forest based on two parameters: mtry, the number of random variables in each tree, and ntree, the number of trees, for optimal accuracy. The results were compared with actual clinical outcomes and true-positive and false-positive rates were plotted on a receiver-operating characteristic curve.
Statistical analyses
For CyTOF data, non-parametric paired or unpaired Mann-Whitney U tests were used to identify differential nodes between the two groups. A paired or unpaired Student’s t-test or Mann-Whitney U test and Pearson’s correlation test (GraphPad Prism V.6.0f) was used to analyse the FlowJo and qPCR data, as indicated. For multivariate analysis of variance (MANOVA),27 the F-value and P value were calculated based on the Pillai-Bartlett statistics.28
Results
Y90-RE activates the local immune response
An in-depth analysis pipeline based on CyTOF and NGS was designed to survey the immune phenotypes of TILs, tumour tissues and PBMCs obtained from patients with HCC before and after undergoing Y90-RE (figure 1A). In order to understand the nature of the local immune response, TILs were isolated from patients after Y90-RE or from patients who were treatment-naïve (with matched clinical parameters, as control (Ctl), online supplementary table S1). TILs were analysed using CyTOF (online supplementary table S3) and the differentially expressed nodes/immune subsets from post-Y90-RE versus Ctl tumours were identified (figure 1B).
First of all, we observed an enrichment of specific CD56+ NK cells, CD8+CD56+ NKT cells, CD8+ T cells and CD4+ T cell subsets in TILs isolated from post-Y90-RE tumours (figure 1B). The expression of two immune markers, granzyme B (GB) and Tim-3, was higher in TILs from post-Y90-RE versus Ctl tumours (figure 1B and figure 1C). Indeed, a higher percentage of GB+CD8+ T cells and Tim-3+CD8+ T cells were detected in post-Y90-RE TILs as confirmed using FlowJo manual gating (Figure 1D). An overall enrichment of CD56+ NK cells and CD8+CD56+ NKT cells, which also expressed significantly more GB than the Ctl TILs, was also observed in post-Y90-RE TILs (figure 1E) (figure 1D). In addition, we observed a higher percentage of CD4+CD45RO+ T cells that expressed CXCR3 in post-Y90-RE-TILs (figure 1B and online supplementary figure S1A). Conversely, Ctl TILs showed a higher percentage of immunosuppressive Foxp3+CD152+CD4+ TREG cells (figure 1B and online supplementary figure S1B) as compared with Y90-RE TILs.

Immune profiles of tumour infiltrating leucocytes (TILs) isolated from Yttrium-90 (Y90)-radioembolisation (RE)-treated and treatment-naïve tumours. (A) Samples collection and analysis pipeline. Peripheral blood mononuclear cells (PBMCs) were collected before (pre-Y90) and at various time points after Y90-RE (post-Y90) (n=31 patients). TILs were collected from resected hepatocellular carcinoma (HCC) tumours from post-Y90-RE (downstaged on therapy) or treatment-naïve patients, control (Ctl) (n=7 for each group). time-of-flight mass-cytometry (CyTOF) was used to analyse both the PBMCs and TILs and next-generation sequencing (NGS) was performed on tumour tissues from post-Y90-RE and treatment-naïve patients (n=4 for each group). (B) Two-dimensional (2D) heat map showing the differential expression of immune markers by nodes enriched in TILs isolated from post-Y90-RE (red bar) or treatment-naïve (Ctl; green bar) HCC tumours. Enriched immune subsets in TILs from post-Y90-RE were CD56+natural killer (NK) cells, CD8+CD56+ NKT cells, CD8+ T and CD4+ T cells while regulatory T, Treg cells were enriched in TILs from Ctl HCC (colour-coded lines). n=7 each group. (C) 2D representation of granzyme B (GB) and Tim-3 expression on TILs isolated from post-Y90-RE (Y90) and Ctl HCC tumorstumours. Images were generated using MARVis software. () Representative plots showing the gating of GB on CD8+ T cells from post-Y90-RE (Y90) or Ctl TILs (left panel). Percentage of GB+CD8+ and Tim-3+CD8+ T cells from post-Y90-RE and Ctl TILs (right panel). () Percentage of CD56+ NK cells, CD8+CD56+ NKT cells, GB+CD56+ NK cells and GB+CD8+CD56+ NKT cells from post-Y90-RE (Y90) and Ctl TILs. Graphical data represent the means±SD and were analysed by unpaired Student’s t-test. *P<0.05 and **P<0.01.
Taken together, these data show that the immune microenvironment of post-Y90-RE tumours was infiltrated by multiple activated immune subsets and was less immunosuppressive compared with the TREG cells-enriched Ctl tumours.
Immune activation pathways are induced in the tumour tissue following Y90-RE
We next performed NGS on the resected tumour tissues collected from patients with HCC downstaged after Y90-RE versus treatment-naïve Ctl (online supplementary table S1). Overall, we observed multiple differentially expressed genes, with 88% of highly expressed genes in post-Y90-RE compared with Ctl tumours (figure 2A and online supplementary figure S2A). Functional analysis using DAVID pathway analysis tool found that most of these enriched genes were related to innate or adaptive immune responses (figure 2B and figure 2C). Conversely, the genes enriched in Ctl tumours were not related to immune pathways.

Next-generation sequencing (NGS) and pathway analysis of post-Yttrium-90 (Y90)-radioembolisation (RE) and treatment-naïve (control (Ctl)) hepatocellular carcinoma (HCC) tumour tissues. (A) Heat map of differentially expressed genes (≥twofold) between Y90-RE-treated and Ctl tumour tissue (n=4 each group). (B) Percentages of major functional pathways enriched in Y90-RE-treated tumour tissues, analysed using DAVID Functional Annotation software. (C) Top-ranking functional pathways enriched in Y90-RE-treated vs Ctl tumour tissue using DAVID Functional Annotation software.
Further data analysis of these post-Y90-RE-enriched genes using the Reactome database identified pathways (online supplementary table S5), included the antigen presentation of MHC class II molecule (online supplementary figure S2B); T cell activation pathways that were related to the CD28 costimulatory (online supplementary figure S2C) and CD28-dependent Vav1 and Akt pathways (online supplementary figure S2D). Comparing post-Y90-RE versus Ctl tumours, we also detected upregulation of the NK cell activation pathway via CD244 and CD48 (online supplementary figure S3A), as well as enrichment of lymphocyte function-associated antigen 1 (LFA-1) and intercellular adhesion molecule 1 (ICAM-1) binding, which is required for the development and recruitment of NKT cells to the liver (online supplementary figure S3B).29 30
Taken together, these findings complement our observations by CyTOF of an enhanced activation and recruitment of T cells, NK cells and NKT cells into post-Y90-RE tumours.
Y90-RE induces chemotaxis of CD8+ T cells to the tumour microenvironment
Reactome analysis on post-Y90-RE-enriched genes also indicated an increase in chemotactic activity involving the upregulation of CXCL16 and CCL5 (figure 3A). Given this result, we hypothesised that a chemotaxis pathway may be induced by Y90-RE.
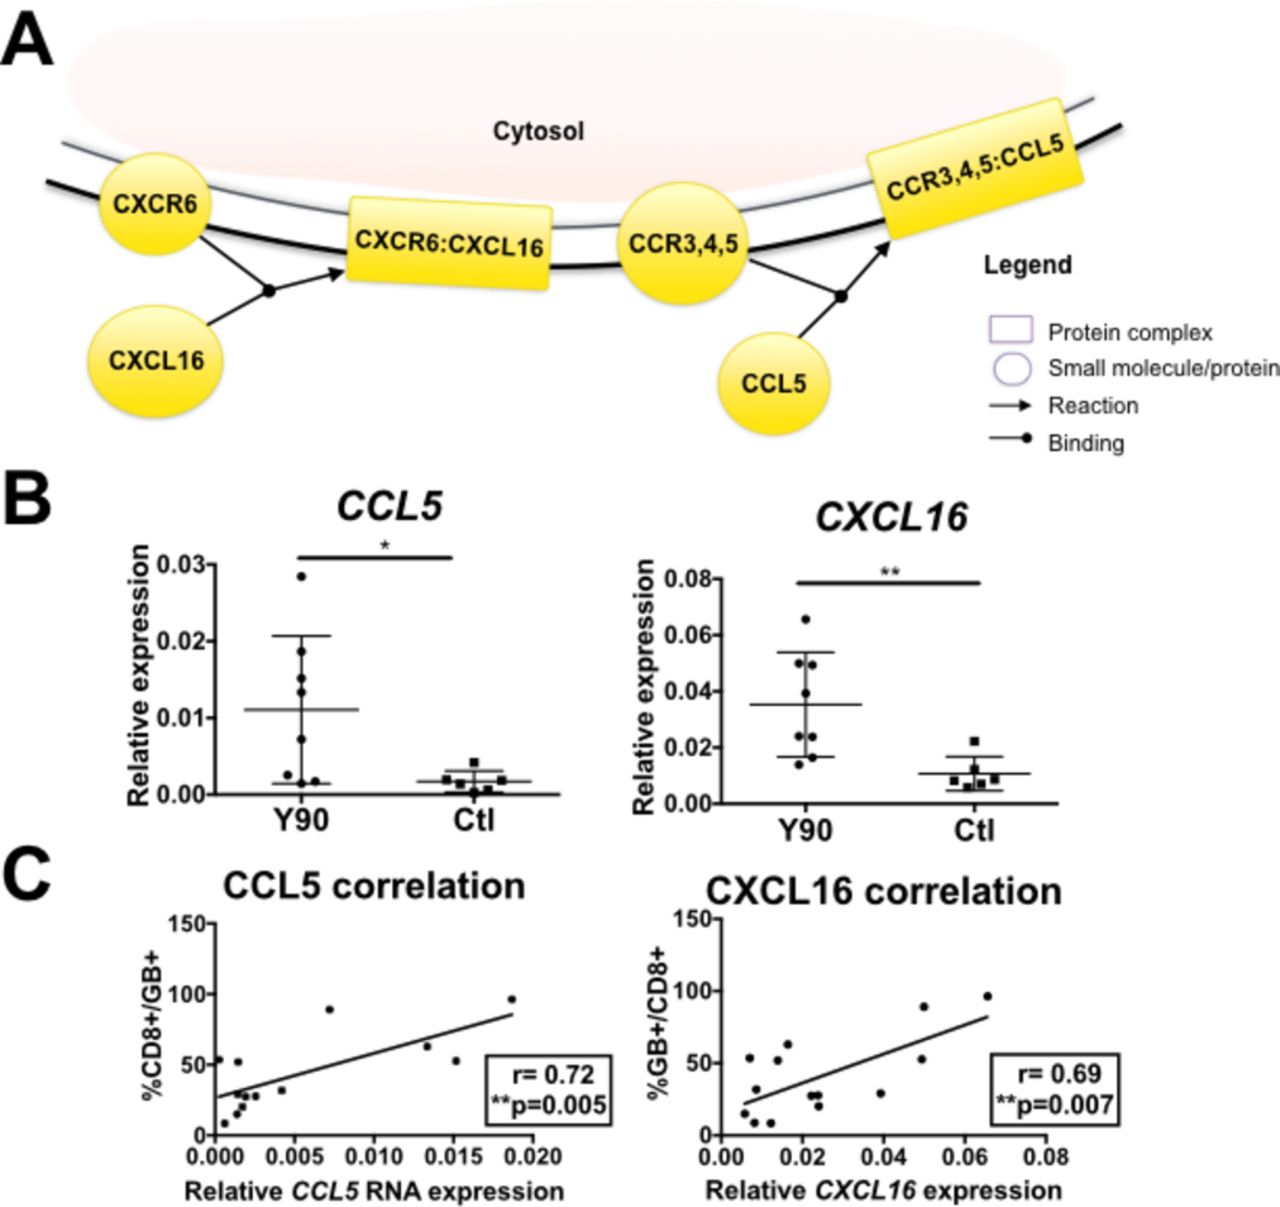
Chemotatic pathways involving CCL5 and CXCL16 induced by Yttrium-90 (Y90)-radioembolisation (RE). (A) Reactome pathway analysis showed CXCL16-CXCR6 and CCL5-CCR5 chemotaxis pathways indicated by enriched genes in post-Y90-RE tumours. Boxes indicate protein complexes while circles indicated individual molecule/proteins. Yellow indicates involvement of enriched genes identified by our next-generation sequencing data. (B) RNA expression of CCL5 and CXCL16 in Y90-treated (n=8) vs control (Ctl) (n=6) tumour tissues by quantitative PCR analysis. (C) Correlation between RNA expression of CCL5 and CXCL16 and the percentage of tumour-infiltrating GB+CD8+-activated T cells (n=14). Graphical data represent the means±SD. P values and correlation coefficients (r) were calculated using the Pearson’s correlation test. *P<0.05 and **P<0.01.
We then performed qPCR on tumour samples obtained from the same patients (online supplementary table S1) to validate the NGS results, which indeed showed an increase in CCL5 and CXCL16 expression—two chemokines that bind CCR5 and CXCR6, respectively (figure 3B). In order to confirm their chemotactic effect for activated T cells, we correlated the RNA expression of CCL5 and CXCL16 with the immune subsets found in TILs and confirmed that CCL5 and CXCL16 were positively correlated with percentage of activated GB+CD8+ T cells (figure 3C). These findings demonstrated the ability of Y90-RE to shape the microenvironment of HCC tumours, by inducing tumour cell death and T cell recruitment and activation following therapy.
Early and late immune responses are induced by Y90-RE
In order to capture the Y90-RE-induced systemic immune response, we collected PBMCs from another 31 patients with HCC before and at various time points (1, 3 and 6 months) after Y90-RE (online supplementary table S2).
We segregated the 31 patients who received Y90-RE into two groups—SRs and NRs/TRs (online supplementary table S2; SRs are non-PD patients at any site at 6 months after Y90-RE; NRs are patients who did not show even SD at 3 months and TRs are patients who showed initial response at 3 months but progressed by 6 months) and performed paired-wise time points (1 month post-Y90-RE vs pre-Y90-RE) CyTOF analyses specifically on the SRs (figure 4A). Initial indications of immune activation were represented by an increase in tumour necrosis factor (TNF)-α expression on CD8+Tim-3+ and CD4+ T cells 1 month after Y90-RE, specifically in the SRs (figure 4B and figure 4C). Notably, TNF-α expression on these T cell subsets was also significantly higher in SRs versus NRs/TRs at 3 months after therapy (figure 4B and figure 4C).

Immune responses linked to clinical response detected in peripheral blood mononuclear cells (PBMCs) at 1 month and 3 months post-Yttrium-90 (Y90)-radioembolisation (RE). (A) Two-dimensional heat map showing the differential expression of 37 immune markers by enriched nodes from PBMCs isolated before (pre; green bar) and 1 month after (1 mo; red bar) Y90-RE. Immune subsets enriched 1 month after Y90-RE were CD8+, CD4+ and CD56+NK subsets indicated by colour-coded lines. n=5 paired-samples for each time point. (B) Representative plots showing the gating of CD8+Tim-3+ T cells (upper panels) and tumour necrosis factor (TNF)-α expression on these CD8+Tim-3+ T cells (lower panels) from PBMCs isolated before (pre) and 1 month (1 mo) after Y90-RE. Right panel shows the percentage of TNF-α expressing CD8+Tim-3+ T cells in sustained-responders (SRs) or non-responders (NRs) and transient responders (TRs) to Y90-RE before (pre) and after (1–6 mo) therapy. (C) Representative plots showing the gating on TNF-α expressing CD4+ T cells from PBMCs isolated before (pre) or 1 month (1 mo) after Y90 therapy. Right panels show the percentage of TNF-α expressing CD4+ T cells. (D) Representative plots showing the gating on CD14+HLA-DR+ cells from PBMCs isolated before (pre) and 3 months (3 mo) after Y90-RE. Right panel shows the percentage of CD14+HLADR+antigen-presenting cells. Graphical data represent the means±SD. Data were analysed by paired Student’s t-test (for pre vs 1 mo or 3 mo) or unpaired Student’s t-test (for 3 mo SRs vs NRs/TRs). *P<0.05. **P<0.01.
The same comparisons were made between 3 months post-Y90-RE and pre-Y90-RE (online supplementary figure S4A) and a significantly higher proportion of CD14+HLADR+antigen-presenting cells (APCs) was observed 3 months after therapy specifically in SRs (figure 4D and online supplementary figure S4B).
A less distinct difference in immune-cell subsets was identified when comparing PBMCs at 6 months with pre-Y90-RE except APCs (figure 4D). This result was consistent to the increased antigen presentation in post-Y90-RE tumours shown by NGS (online supplementary figure S2B).
Higher expression of PD-1 and Tim-3 identifies and predicts sustained response to Y90-RE
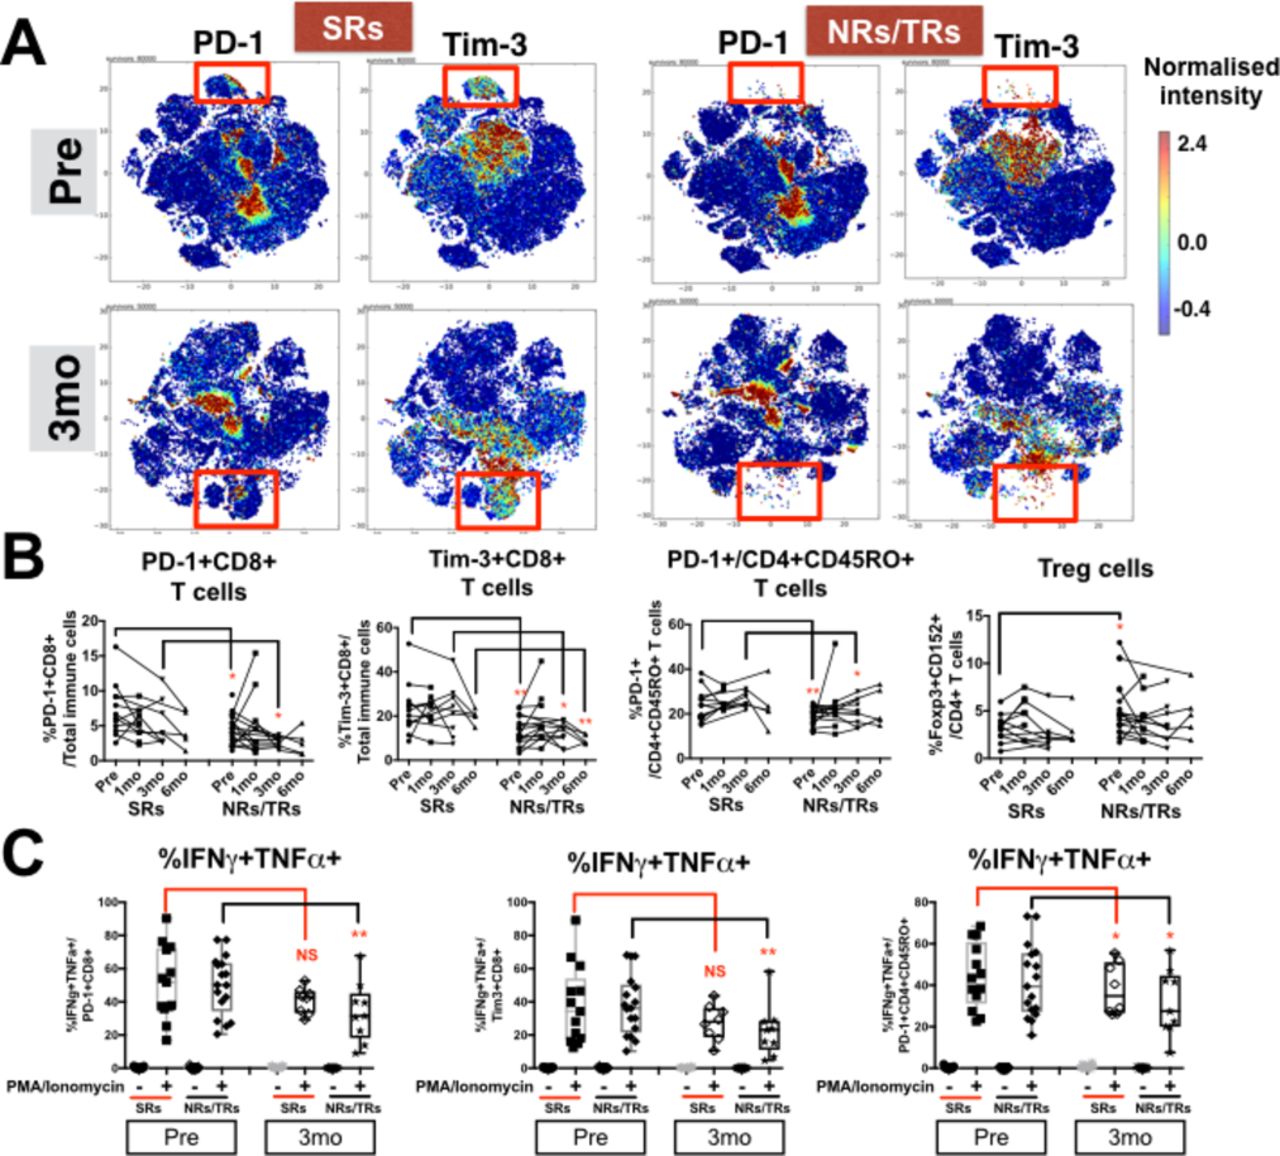
We next focused on comparing the systemic immune profiles of SRs versus NRs/TRs at pre-Y90-RE and 3 months after Y90-RE. We observed distinct CD4+ T cells and CD8+ T cell specific to SRs (online supplementary figure S5A and B). PD-1 and Tim-3 showed higher expression in SRs both pre-Y90-RE and 3 months after Y90-RE (figure 5A). Validated by FlowJo manual gating, the higher percentages of PD-1-expressing and Tim-3-expressing CD8+ T cells were shown in SRs at both time points (figure 5B and online supplementary figure S6A). Of note, Tim-3+CD8+ T cells remained higher in SRs up to 6 months after Y90-RE (figure 5B). We also observed a higher percentage of PD-1+ CD4 +CD45RO+ T cells in SRs before and 3 months after therapy (figure 5B and online supplementary figure S6B). This apparent higher expression of exhaustion markers may indicate a higher level of peripheral T cell activation that is specific to SRs both prior to and 3 or 6 months after the therapy. This may mediate in part the subsequent sustained response to Y90-RE.

Distinct T-cell subsets in sustained responders (SRs) vs non-responders (NRs)/transient responders (TRs) to Yttrium-90 (Y90)-radioembolisation (RE). (A) Two-dimensional cellular illustration of progressive disease-1 (PD-1) and Tim-3 on peripheral blood mononuclear cells (PBMCs) isolated before (pre) and at 3 months (3 mo) after Y90-RE from SRs or NRs/TRs patients. Images were generated using MARVis software. (B) Graphs show the percentages of PD-1+CD8+ T cells, Tim-3+CD8+ T cells, PD-1+CD45RO+CD4+ T cells and Foxp3+CD152+ Treg from PBMCs of SRs and NRs/TRs at various time points (1, 3 and 6 mo) after Y90-RE. Graphical data represent the means±SD and were analysed by unpaired Student’s t-test. *P<0.05 and **P<0.01. (C) Graphs show the percentages of intracellular cytokines interferon (IFN)-γ and tumour necrosis factor (TNF)-α expressed by PD-1+CD8+ T cells, Tim-3+CD8+ T cells or PD-1+CD45RO+CD4+ T cells with or without 5 hours PMA/Ionomycin stimulation. Graphical data represent the means±SD and were analysed by paired Student’s t-test. *P<0.05 and **P<0.01.
In order to understand the functionality of these exhausted peripheral T cell subsets marking the SRs from the NRs/TRs, we performed ex vivo stimulation with PMA/Ionomycin and analysed the cytokine expression from both PD-1+CD8+ or Tim-3+CD8+ T cells. By comparing stimulated PD-1+CD8+ and Tim-3+CD8+ T cells from 3 months post-Y90-RE versus pre-Y90-RE PBMCs, we noted a significant reduction in the expression of the pro-inflammatory cytokines, IFN-γ and TNF-α, specifically in NRs/TRs but not SRs (figure 5C). This observation indicated that these T cells, in SRs specifically, remained functional; (able to express pro-inflammatory cytokines) and hence able to exert a potential local antitumour effect when appropriately stimulated by tumour antigens released on radiotherapy. Of note, the expression of IFN-γ and TNF-α by PD-1+CD4+CD45RO+ T cells was however reduced in both SRs and NRs/TRs when comparing 3 months post-Y90-RE versus pre-Y90-RE (figure 5C).
By contrast, the immune subsets enriched in the NRs/TRs at pre-Y90-RE or 3 months post-Y90-RE included CD4+Foxp3+CD152+ Treg (figure 5B and online supplementary figure S6C); CD4+CD45RO+ T cells that do not express PD-1 and CD8+ T cells that do not express PD-1 or Tim-3 (online supplementary figure S6A and SB).
T cells from sustained responders of Y90-RE express specific homing receptors, CCR5 and CXCR6
Other than the various immune subsets, distinct differences in chemokine-receptor expression, namely CCR5 and CXCR6, were also observed when comparing SRs with NRs/TRs pre-Y90-RE and 3 months post-Y90-RE (figure 6A). FlowJo manual gating on all samples confirmed a significantly higher percentages of CCR5+CD8+ T cells and CXCR6+CD8+ T cells from SRs at both time points (figure 6B and online supplementary figure S6D). Interestingly, the expression of CCR5 and CXCR6 was also significantly higher on the Tim-3+CD8+ T cell subsets that were enriched in SRs (figure 6C). The higher percentages of CCR5-expressing and CXCR6-expressing CD8+ T cells is also consistent with the previous results showing the recruitment of activated CD8+ T cells to the tumour microenvironment on Y90-RE (figure 3C). Furthermore, a drop in percentage of both CCR5 and CXCR6 on CD8+ T cells and CD8+Tim-3+ T cells that was observed at 1 month post-Y90-RE further implicated the recruitment of activated T cells to the tumour site on Y90-RE (figure 6B and figure 6C).

CXCR6+ and CCR5+ CD8 T cell subsets identify patients with hepatocellular carcinoma with sustained response to Yttrium-90 (Y90)-radioembolisation (RE). (A) Two-dimensional cellular illustration of CXCR6 and CCR5 on peripheral blood mononuclear cells (PBMCs) isolated before (pre) and 3 months (3 mo) after Y90-RE from sustained responders (SRs) and non-responders (NRs)/transient responders (TRs) patients. Images were generated using MARVis software. (B) Graphs show the percentages of CXCR6+CD8+ and CCR5+CD8+ T cells and (C) graphs show the percentages of CXCR6+CD8+Tim-3+ or CCR5+ CD8+Tim-3+ T cells. B and C, data obtained from PBMCs isolated from SRs or NRs/TRs patients before (pre) and at various time points (1, 3 and 6 mo) after Y90-RE. Graphical data represent the means±SD and were analysed by unpaired Student’s t-test. *P<0.05 and **P<0.01.
Prediction model for sustained response based on the immune profiles of pre-Y90-RE PBMCs
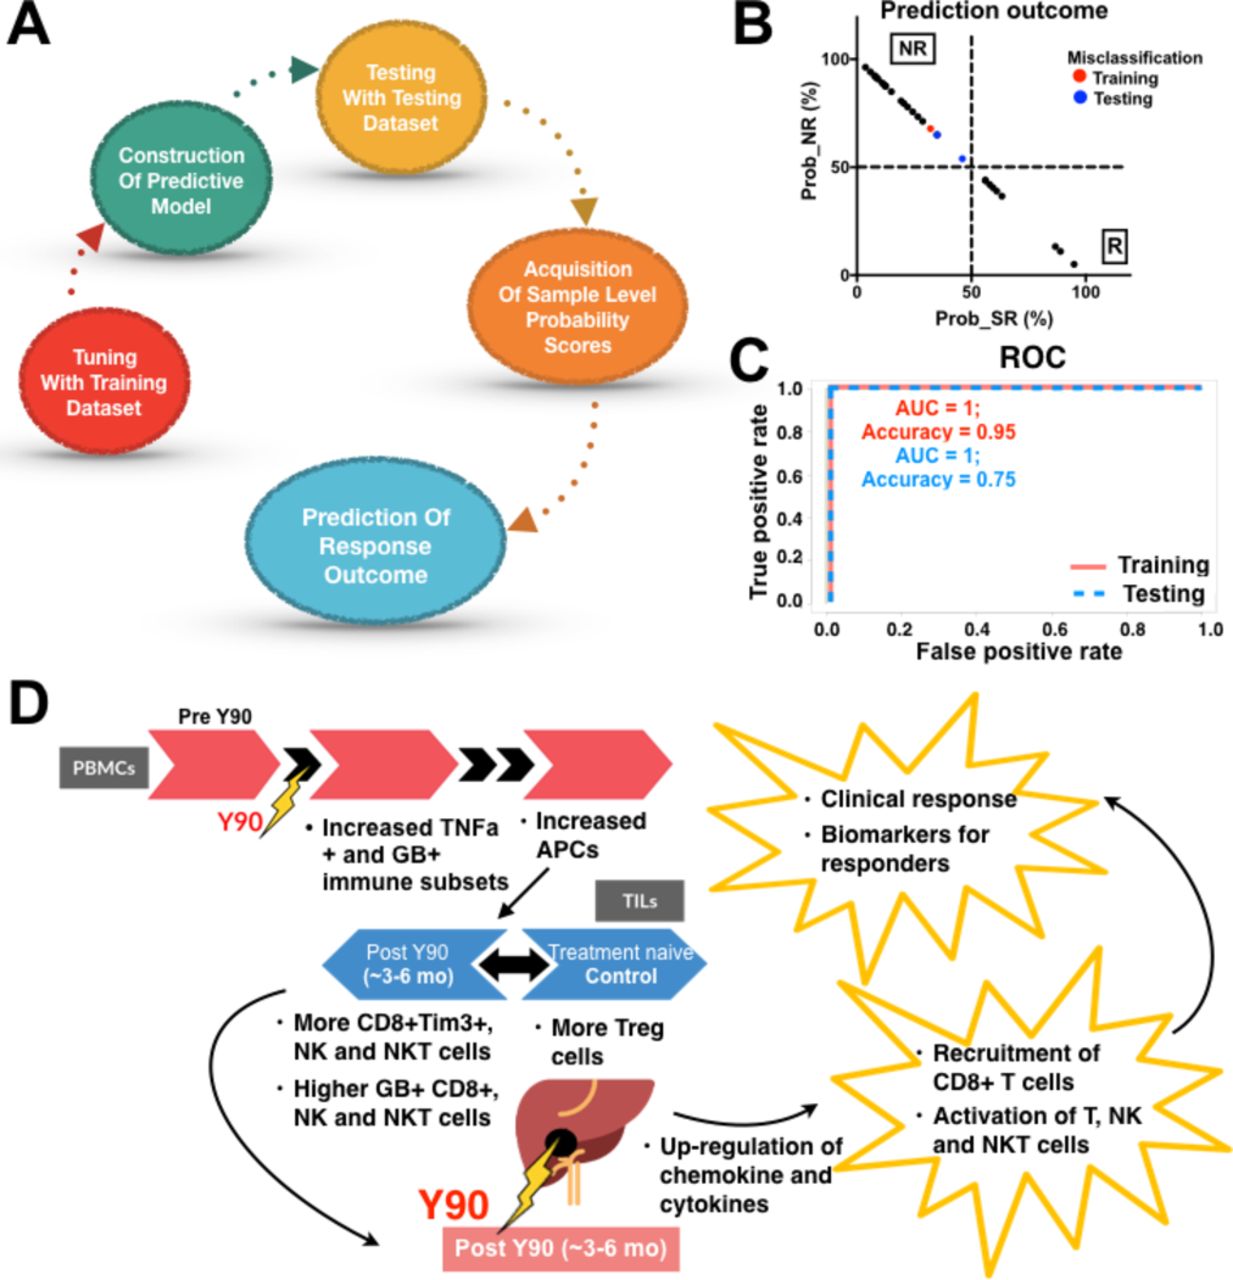
Based on the differences in immune markers expression from the peripheral blood, we were able to segregate the patients who demonstrated sustained response from the patients who showed no or transient response to Y90-RE. Next, we built a prediction model using Random Forests for predicting sustained response based on single-cell immune profiles (CyTOF data from 10 000 single cells with 37 markers expressions) of pre-Y90 PBMCs. The prediction model was selected based on the parameters: mtry (number of random variables) and ntree (number of trees) that provided the optimal accuracy (mtry=10 and ntree=2000 provided maximum accuracy of 76.8%, online supplementary figure S7A). Random Forests parameters were first tuned using a training dataset (randomly selected training cohort; n=22) to construct the final predictive model. The predictive model was then tested on a testing dataset (remaining samples; n=8) to provide the probability score for the prediction outcome (figure 7A). For each of the samples, the percentage of cells classified as R (SR) or NR (NRs/TRs) was computed and used as a voting system for probability scores, where R ≥50% classified the samples to the R group, whereas R <50% classified them to the NR group (figure 7B and online supplementary figure S7B). We found a high accuracy of 95.5% when cross-validating this model in the training cohort and accuracy of 75.0% when independently tested in a testing cohort (figure 7C).
Prediction model for sustained response to Yttrium-90 (Y90)-radioembolisation (RE). (A) Construction of the Random Forests predictive model from time-of-flight mass-cytometry data to predict a final response outcome for each patient. (B) Probability (Prob) of being classified as either NR (non-responders (NRs)/transient responders (TRs)) or R (sustained responders (SRs)). The cut-off was where R ≥50% classified the samples to the SR group while R<50% classified them to the NR group. Red (training) and blue (testing) highlight where cases were misclassified by the model. (C) Receiver operating characteristic (ROC) curve from Random Forests prediction method to predict sustained response after Y90-RE in the training cohort n=22 and validation cohort n=8. AUC, area under the curve. (D) Model showing a series of immune responses induced by Y90-RE in tumour-infiltrating lymphocytes (TILs) and peripheral blood mononuclear cells (PBMCs). In TILs from Y90-RE-treated tumours, an increase in infiltration of granzyme B (GB)-expressing CD8+, natural killer (NK) cells and NKT cells was observed after Y90-RE vs more TREG in the treatment-naïve control tumours. Y90-RE-induced upregulation of chemokines is hypothesised to link to CD8+ T cells recruitment and activation. At 1 mo and 3 mo post-Y90-RE, immune activation of tumour necrosis factor (TNF)-α-expressing and GB-expressing immune subsets and antigen-presenting cells (APCs) was observed in PBMCs. The immune profiles of SRs could serve as a superior biomarker for clinical response to Y90-RE.
In order to consider other clinical parameters potentially influencing the clinical outcome or response to Y90-RE, we performed a MANOVA to analyse the relationships between the actual clinical response with our prediction model and these parameters, which included: tumour stage, tumour multiplicity, tumour size, portal vein tumour thrombus (PVTT), AFP level, hepatitis status and pretherapy or post-therapy prior or after Y90-RE (see online supplementary table S2). Indeed, the current prediction model showed superior predictive power (P=1.006e−07) compared with stage (P=0.0012), tumour multiplicity (P=0.014) and all other parameters, which do not have significant predictive power (table 1). These data indicated that the immune status of pre-Y90-RE PBMC could be a more powerful and independent biomarker than other clinical parameters in predicting a sustained response to Y90-RE.
Multivariate analysis of variance
Taken together, this in-depth immunophenotyping approach has demonstrated the nature of the immune response after Y90-RE at the local and systemic level. Potential systemic biomarkers have been identified that classify and predict patients with HCC who showed sustained response to Y90-RE (figure 7D).
Discussion
Our data, analysing resected tumour tissue and PBMCs from patients with HCC, provide strong evidence that Y90-RE induces both a localised and systemic immune response that involves T cell, NK cell and NKT cell activation, antigen presentation and immune-cell motility. Systemic immune subsets unique to patients who demonstrated sustained response to Y90-RE included, exhaustion markers (PD-1 and Tim-3)-expressing CD8+ T cells and CD4+ T cells and homing receptors (CCR5 and CXCR6)-expressing CD8+ T cells and CD8+Tim-3+ T cells. A chemotaxis pathway triggered by Y90-RE for activated GB+CD8+ T cells via CCL5 and CXCL16 was also discovered. Importantly, the current study provided a prediction model for sustained clinical response based on the immune profiles of the pre-Y90-RE PBMCs.
In-depth immunophenotyping of TILs showed marked immune activation in the local tumour microenvironment, such as higher percentages of activated or GB-expressing CD8+ T cells, CD56+ NK cells and CD8+CD56+ NKT cells and lower percentage of TREG cells post-Y90-RE. Analysis of NGS data from tumour tissues also provided compelling evidence for enhanced T cell, NK cell and NKT cell activation. For instance, in patients who received Y90-RE, we observed the induction of CD28 costimulatory and CD28-dependent Vav1 and Akt pathways, which have been previously shown to positively regulate T cell activation and proliferation.31 The CyTOF and NGS analyses also identified an enhanced innate immune response as a result of Y90-RE that involved NK cells and NKT cells activation. Indeed, both NK cells and NKT cells have been previously implicated in liver diseases including HCC.32 33
Analysis of PBMCs before and after Y90-RE by CyTOF allowed us to capture the systemic immune response triggered by the therapy and identify potential biomarkers to predict clinical outcome. The immune response that we first detected at 1 month post-Y90-RE was an increase in cytokine TNF-α expression on CD8+ and CD4+ T cells, followed by increased APCs 3 months post-Y90-RE (figure 4). The high percentages of systemic CD8+ T cells and CD4+CD45RO+ T cells that expressed PD-1 and Tim-3 before Y90-RE denoted the patients who went on to elicit a sustained response after therapy with an increase in time-to-tumour progression of ≥6 months Figure 5. The same immune subset, CD8+Tim-3+ T cells, was also one of the key subsets enriched in TILs in tumours from post-Y90-RE (Figure 1D)(Figure 1C).
Tim-3 is a marker of immune-cell exhaustion and is associated with the progression of various cancers, including HCC.34 Coexpression of PD-1 and Tim-3 can enhance T cell impairment and is also associated with tumour progression.35 36 However, Tim-3 expression is also an indication of prior T cell activation,37 and indeed, the coexpression of Tim-3 and PD-1 on CD8+ T cells may indicate a prior immune response mounted towards tumour antigens.36 Another indication of heightened T cell activation was the coexpression of pro-inflammatory GB and TNF-α on TILs or PBMCs in patients after Y90-RE (FFigure 1C, figure 4B). In addition, both PD-1+CD8+ and Tim-3+CD8+ T cells from the peripheral blood of SRs maintained their ability to express the pro-inflammatory cytokines IFN-γ and TNF-α when stimulated ex vivo (figure 5C). Indeed, targeting both Tim-3 and PD-1 pathways can reverse T cell exhaustion and restore antitumour immune responses in murine cancer models.38 Given these data, we postulate that sequential therapy involving Y90-RE followed by immunotherapy using check-point inhibitors against the PD-1/PD-L1 or Tim-3 pathways, particularly in the sustained responders, may enhance the clinical response in HCC. Indeed, clinical trials combining radiotherapy and immunotherapy are currently ongoing in various cancers with promising efficacy.39
The coexpression of Tim-3 with the homing receptors CCR5 and CXCR6 on CD8+ T cells indicated their ability to home towards CCL5 and CXCL16 chemokines. Our data demonstrated that CCR5+CD8+ and CXCR6+CD8+ or CCR5+/CXCR6+Tim-3+CD8+ T cells are other biomarkers of responders to Y90-RE (Figure 6). Interestingly, NGS and qPCR indicated an upregulation of CCL5 and CXCL16 in tumour microenvironment of post-Y90-RE (figure 3). These results imply that Y90-RE-induced chemokine expression is required for the recruitment of cytotoxic CD8+ T cells to tumour sites via CCL5 and CXCL16 pathways, and that this effect leads to a clinical response to Y90-RE. Indeed, the importance of chemokines in the recruitment of cytotoxic immune cells towards the tumour microenvironment,40 41 as well as the infiltration of cytotoxic immune cells in controlling tumour progression and efficacy of cancer immunotherapeutics42 have been previously reported
Our study was restricted by the availability of tumour tissues from the same patients before and after Y90-RE because biopsies were not routinely performed on patients prior to Y90-RE. As such, our study relied on inferences from liquid biopsies taken before and after Y90-RE and comparisons with treatment-naïve tumour tissues as controls. These obstacles, however, did not compromise our conclusions, which were built from comprehensive, high-dimensional analyses of TILs, tumour tissues and PBMCs at various time points before and after Y90 treatment.
In conclusion, deep immunophenotyping and transcriptomic analysis demonstrated robust immune activation locally within the tumour microenvironment and systemically in the peripheral blood of patients with HCC, who showed sustained response to Y90-RE. By this approach, we could capture the immune activation and identified predictive biomarkers for sustained clinical response in the peripheral blood that may guide treatment choices for patients with HCC.
Acknowledgments
The authors would like to thank Fiona Ni Ni Moe and Phang Su Ting (NCCS) for coordinating the patient sample collection and for their assistance in obtaining patient consent. The authors also thank Dr Lakshmi Ramakrishna, Dr Pavanish Kumar and Dr Bhairav Suryakant Paleja (SHHQ) for their contributions in scientific discussion.
References
Footnotes
SA and PKHC contributed equally.
Contributors VC designed the study, performed some of the experiments, analysed all the data and wrote the paper. YHL and NJMN performed most experiments and analysed the data. LP performed CyTOF, RNAseq data analyses and Random Forest prediction model. CJL processed samples and performed some experiments. CC and SNH performed NGS experiments. LL performed some CyTOF experiments. TKHL prepared the FFPE samples. BKPG and AC recruited and provided surgical tissues samples. RHGL and DN delivered Y90-RE to patients and assisted in samples collections. RLFF recruited patients and analysed patient clinical responses. SA aided the study design and manuscript preparation. PKHC designed the study and recruited patients.
Funding This work was supported by the National Medical Research Council (NMRC), Singapore (Ref. no: MOHIAFCAT2001, TCR15Jun006, CIRG16may048, NMRC/STaR/020/2013, NMRC/MOHIAFCAT2/005/2015, CIRg13nov032 and NMRC/MOHIAFCAT186003), Duke8NUS, SingHealth and BMRC (BMRC8EDB IAF: IAF311020 and SPF2014/005).
Competing interests Valerie Chew and Pierce KH Chow have received honoraria from Sirtex Medical.
Patient consent Obtained.
Ethics approval SingHealth Centralised Institutional Review Board (CIRB).
Provenance and peer review Not commissioned; externally peer reviewed.