Article Text

Abstract
Objective Although anti-tumour necrosis factor alpha (anti-TNFα) therapies represent a major breakthrough in IBD therapy, their cost–benefit ratio is hampered by an overall 30% non-response rate, adverse side effects and high costs. Thus, finding predictive biomarkers of non-response prior to commencing anti-TNFα therapy is of high value.
Design We analysed publicly available whole-genome expression profiles of colon biopsies obtained from multiple cohorts of patients with IBD using a combined computational deconvolution—meta-analysis paradigm which allows to estimate immune cell contribution to the measured expression and capture differential regulatory programmes otherwise masked due to variation in cellular composition. Insights from this in silico approach were experimentally validated in biopsies and blood samples of three independent test cohorts.
Results We found the proportion of plasma cells as a robust pretreatment biomarker of non-response to therapy, which we validated in two independent cohorts of immune-stained colon biopsies, where a plasma cellular score from inflamed biopsies was predictive of non-response with an area under the curve (AUC) of 82%. Meta-analysis of the cell proportion-adjusted gene expression data suggested that an increase in inflammatory macrophages in anti-TNFα non-responding individuals is associated with the upregulation of the triggering receptor expressed on myeloid cells 1 (TREM-1) and chemokine receptor type 2 (CCR2)-chemokine ligand 7 (CCL7) –axes. Blood gene expression analysis of an independent cohort, identified TREM-1 downregulation in non-responders at baseline, which was predictive of response with an AUC of 94%.
Conclusions Our study proposes two clinically feasible assays, one in biopsy and one in blood, for predicting non-response to anti-TNFα therapy prior to initiation of treatment. Moreover, it suggests that mechanism-driven novel drugs for non-responders should be developed.
- Ibd
- meta-analysis
- gene expression
- infliximab
- tnf-alpha
This is an open access article distributed in accordance with the Creative Commons Attribution Non Commercial (CC BY-NC 4.0) license, which permits others to distribute, remix, adapt, build upon this work non-commercially, and license their derivative works on different terms, provided the original work is properly cited and the use is non-commercial. See: http://creativecommons.org/licenses/by-nc/4.0/
Statistics from Altmetric.com
Significance of this study
What is already known on this subject?
Antitumour necrosis factor alpha (anti-TNFα) therapy has been shown to be effective for treating patients with IBD.
Thirty per cent of patients will be primary non-responders to anti-TNFα.
Biological treatment is associated with side effects, tissue damage secondary to uncontrolled disease activity and high costs.
Predictive assays for non-response are hitherto not available.
What are the new findings?
A combined statistical deconvolution and meta-analysis methodology of anti-TNFα-naive patients with IBD has identified altered abundance of plasma cells and inflammatory macrophages in pretreatment intestinal biopsies of anti-TNFα responders versus non-responders.
Significantly high-plasma cell numbers in anti-TNFα non-responders were validated in two independent real-life cohorts of patients with IBD naive to anti-TNFα therapy.
Pathway analysis of the cell-adjusted differentially expressed genes in biopsy between responders and non-responders suggests an upregulation of the triggering receptor expressed on myeloid cells 1 (TREM-1) and chemokine receptor type 2 (CCR2)–chemokine ligand 7 (CCL7) axes in non-responders.
TREM-1 expression in the peripheral blood of patients with Crohn‘s disease is predictive of anti-TNFα response at baseline (downregulated in non-responders) with very high accuracy.
Significance of this study
How might it impact on clinical practice in the foreseeable future?
A clinically predictive assay to anti-TNFα therapy can be developed using immunohistochemistry staining of paraffin-embedded intestinal biopsy taken during colonoscopy.
TREM-1 expression in blood can be developed as a non-invasive diagnostic of non-response to anti-TNFα therapy at baseline.
TREM-1 and/or its downstream regulated axis CCR2–CCL7 can serve as an alternative therapeutic target for patients with refractory IBD.
Introduction
Inflammatory bowel diseases (IBDs) consist primarily of ulcerative colitis (UC) and Crohn’s disease (CD) and are prevalent in the industrialised world with increasing incidence in both Western and low/middle-income countries.1 IBD is characterised by chronic intestinal inflammation, driven both by the innate and adaptive immune systems, although their pathogenesis is not completely understood.2 The advent of anti-tumour necrosis factor alpha (anti-TNFα) therapy was a major breakthrough for IBD treatment and was shown to be effective for treating various forms of disease.3
However, anti-TNFα therapy remains suboptimal for several reasons: treatment choice and administration is empirical and based on data obtained from the ‘average patient’ in clinical trials. This practice is associated with insufficient remission rates that results from primary non-response (20%–40% in clinical trials; 10%–20% in real-life cohorts)4 and from loss of response commonly due to immunogenicity and increased anti-TNFα clearance in 13%–24% of patients at 12 months.5 Beyond that, the treatment is associated with adverse side effects,6 is expensive and each therapeutic attempt requires waiting the anticipated time for response during which the disease is active and damage accumulates. Taken together, there is an urgent unmet need for predicting response prior to treatment initiation to reduce healthcare costs and avoid unnecessary treatment.
Several attempts have been made to define a baseline signature of anti-TNF response in patients with IBD using genetics,7 8 microbiome9 and gene expression data.10–13 Yet, no predictive biomarker is in clinical practice. Here, we used a combined statistical deconvolution multicohort analysis approach to identify biomarkers in colon biopsies and peripheral blood to predict anti-TNFα response in patients with IBD and validated them in real-life cohorts.
Materials and methods
More detailed information is described in the online supplementary methods section.
Supplemental material
Public IBD gene expression data and reported gene signatures
We obtained colon biopsy gene expression data and patient infliximab (IFX, an anti-TNFα agent) responsiveness from published studies10 11 available in Gene Expression Omnibus (GEO) and consist of two cohorts of patients with UC (UC-A and UC-B) and one patient cohort with CD (CDc). No significant differences in clinical parameters were observed in any of these cohorts at baseline. In addition, we gathered six reported signatures10 11 14 15 predictive of IFX response consisting in total of 109 unique genes (table 1, online supplementary table 1 and methods), as well as blood gene expression data profiling patients with IBD for whom endoscopic disease activity was assessed.16
Colon biopsy discovery cohorts (in silico)—IBD predictive gene signatures and patient cohorts used in the immune contribution analysis and cell-type meta-analysis, respectively
For initial assessment of cell-type expression pattern of these signature genes, we created a combined cell-type gene expression matrix from 130 sorted cell-type samples from immune response in silico (IRIS) and the human body index (GSE7307), normalised each dataset, batch corrected and standardised by z-score (see online supplementary table 2). We enumerated signature genes to cell types and lineages by assigning the expression of each gene to the top-three most expressing subpopulations (see online supplementary table 3).
Computational deconvolution and meta-analysis
To estimate cell subset proportions, we used a linear regression framework,17–19 in which individual samples were regressed based on a characteristic expression of marker genes expressed in 17 cell-types (see online supplementary table 4). The resulting output of this procedure was an estimated frequency of each cell subset in each sample. These were then rescaled into proportions, arcsinh transformed and compared between groups within each cohort using Wilcoxon rank sum test. Meta-analysis across three cohorts was performed using Fisher’s combined probability test and corrected for multiple comparisons.20 Cell types having nominal P≤0.05 in at least two cohorts and a combined false discovery rate (FDR) ≤0.05 were selected for further analysis. Receiver operating characteristic analyses were performed by scoring individuals based on the mean gene expression scores per signature,21 whereas for cellular biomarkers we used estimated proportions for individual cell subsets or the average standardised proportions for combined signatures.
Patients in the validation cohorts
We performed analyses of archival slides of patients with IBD in two cohorts: First, in a preliminary cohort, we included 20 biopsies from 16 patients with IBD (eight CD, seven UC, one IBD unclassified, three patients had more than one biopsy) treated at the gastroenterology department of the Rambam Health Care Campus (RHCC). Patient characteristics are represented in table 2. Clinical response was defined by the attending physician as clinical and/or endoscopic improvement of IBD-related symptoms coupled with a decision to continue IFX therapy, at least 14 weeks after treatment initiation. Non-response was defined by lack of improvement or aggravation of clinical or endoscopic presentation or disease symptoms coupled with therapy change. Colonic biopsies were obtained during endoscopy performed prior to first IFX treatment. Biopsies were taken from inflamed and/or uninflamed areas of the colon or ileum.
Clinical and demographic characteristics of patients included in the study
Second, in a primary validation cohort, we obtained biopsies from 61 patients with IBD from RHCC and Tel-Aviv Sourasky Medical Center (TASMC). For this cohort, a decision algorithm was used to determine response (see online supplementary methods).
For blood validation by gene expression analysis, whole blood was obtained at baseline from 22 patients with IBD treated with IFX in PaxGene tubes. RNA was extracted and assayed using Affymetrix Clariom S chips. Data are available in GEO as GSE107865. Response was defined using the same algorithm (see online supplementary methods). No significant difference in C reactive protein (CRP) or Harvey-Bradshaw index (HBI) were noted at baseline between response groups (P=0.66, 0.22, respectively).
This study was performed in accordance with the Declaration of Helsinki and was approved by the institutional ethics committee of RHCC and TASMC (August 2016, Israel).
Immunohistochemistry
Formalin-fixed slides of paraffin-embedded colon or ileum tissues, sectioned at 4 µm, were immunostained for the expression of plasma cells (CD138+, obtained from Serotec, clone B-A38, dilution 1:250) in both cohorts and for inflammatory macrophages (CD68+ and CD86+ from Abcam, clone EP1158Y, 1:100) in the preliminary cohort. Slides were deparaffinised and Polink-1 HRP Broad Spectrum DAB Detection Kit (GBI labs) was used for detection according to the manufacturer’s instructions.
Staining data analysis
Slides were interpreted by an expert pathologist blind to response attributes. A specific cell abundance categorical index between 0 and 3 was determined by the pathologist for plasma cells and inflammatory macrophages. A minimal number of cells was scored as ‘0’, the highest abundance which was seen within all slides was scored as ‘3’. In addition, slides were coded and scanned by an automatic slide scanner 250 Flash. Intestinal crypts, muscles and lymphatic follicles were excluded in each tissue to evaluate cell proportions in the stroma only. Whole-tissue area quantification was performed using ImagePro Premier software V.9.3. CD138+ staining area was determined with the same colour cut-off for all patients, and the ratio between CD138+ staining and the whole-tissue area (in pixels) was evaluated by a researcher blind to response attributes.
Results
Gene expression signatures for anti-TNFα non-response show contributions from distinct immune cell subsets
Reported gene expression signatures of anti-TNFα response from biopsy show an enrichment for broad immune response categories but have not directly been implicated with particular immune cell subsets. We checked what was the likely cellular origin of expression of 109 genes extracted from six different reported signatures associated with baseline anti-TNFα non-response (table 1; online supplementary table 1 and figure 1). To do so, we analysed the relative expression pattern of these genes across a compendium of assembled profiles from sorted immune cell subsets and normal bulk colon tissue biopsies available in the public domain (see online supplementary table 2).
Clustering the expression profiles of these signature genes across sorted cell subsets suggested that three distinct lineages contribute to non-response to anti-TNFα treatment (figure 1): first, myeloid lineage cells subsets expressing 70% of signature genes; second, B-cell lineage cell subsets in which 30% of signature genes were expressed and third, T and NK cells genes, which together comprised 30% of genes in the collective signature (see online supplementary table 3). Of note, only 15% of signature genes were denoted as highly expressed in the bulk colon samples, and of these, the majority were also noted to be highly expressed in the B-cell lineage. Taken together, the majority of anti-TNF response signature genes are more highly expressed by immune cell subsets, with non-overlapping gene set contributions stemming from a myeloid and B-lineage-associated cell subsets. This further suggested that resident or infiltrating leucocyte populations within biopsy tissues could constitute a good baseline predictor of non-response.

Characteristic sorted cell type expression of gene signatures of anti-TNFα response reported from heterogeneous tissue biopsy show contributions from distinct immune cell subsets. Analysis of the immune contribution of 109 unique signature genes mapped to a compendium of sorted cell expression profiles, spanning 17 immune cell subpopulations as well as colon tissue samples. Shown are the contributions (x-axis), that is, number of genes assigned, for eight major cell lineages (y-axis), highlighted into resting (light shade) and activated/memory (dark shade) subpopulations. Lineages are ordered by decreasing total contribution, with most signature genes are expressed in the myeloid, B and T-cell lineages (68%, 13% and 19% of the genes, respectively). Eighty-five per cent of signature genes are expressed in low abundance in bulk healthy colon.
Meta-analysis identifies cell type proportion differences between response groups at baseline and following treatment
Bulk gene expression measurements of a tissue may be strongly confounded by variation in cell subsets.17 22 Given the distinct immune cell subset associated genes in anti-TNFα response gene signatures, we hypothesised that the signature-identified genes may be due to variations in cell subset proportions between individuals. To test this hypothesis, we used a computational gene expression deconvolution approach17 to estimate the relative composition of 17 immune cell subsets in each sample of three publicly available IBD cohorts (table 1, cohorts UC-A, UC-B and CDc, 65 samples total), from which the previously reported predictive gene signatures were individually derived (see online supplementary tables 3 and 4). We then tested for differences in cellular proportions between anti-TNFα therapy responders and non-responders (see online supplementary figure 2 and table 5). To ensure robustness of our downstream analyses, we considered only those cell types for which at least 75% of the samples had non-zero estimated proportions and performed a meta-analysis of cellular proportion differences across all three cohorts by combining P values for cell subset differences between response groups across cohorts. Our analysis identified two cell subsets, macrophages and plasma cells, which were significantly different in at least two out of the three discovery cohorts (nominal P value ≤0.05) and passed a combined false discovery rate of 5% (figure 2A, online supplementary figure 3). The proportions of both cell subsets were significantly higher in non-responders than in responders. These differences were maintained between response groups even following adjustment to CRP messenger RNA (mRNA) levels (P value for macrophage/plasma cell response differences in a linear model adjusted for CRP: 0.008/0.031, 0.021/0.869, 0.001/0.010). Repeating the same analysis in a second time point, available for UC-A and CDc for 4–6 weeks post-treatment, we observed a significant decrease in both cell subset abundances, which was independent of response in UC but statistically significant only in responders in CD (FDR≤0.05, figure 2C–D). Importantly, both cell subset proportions were still significantly higher in non-responders post-treatment (FDR≤0.05, online supplementary figure 4). Overall, this showed that the differences observed at baseline in macrophages and plasma cell abundances were maintained after treatment initiation, and that successful response to anti-TNFα was associated with a sharp decrease in these cell subsets.
Supplemental material
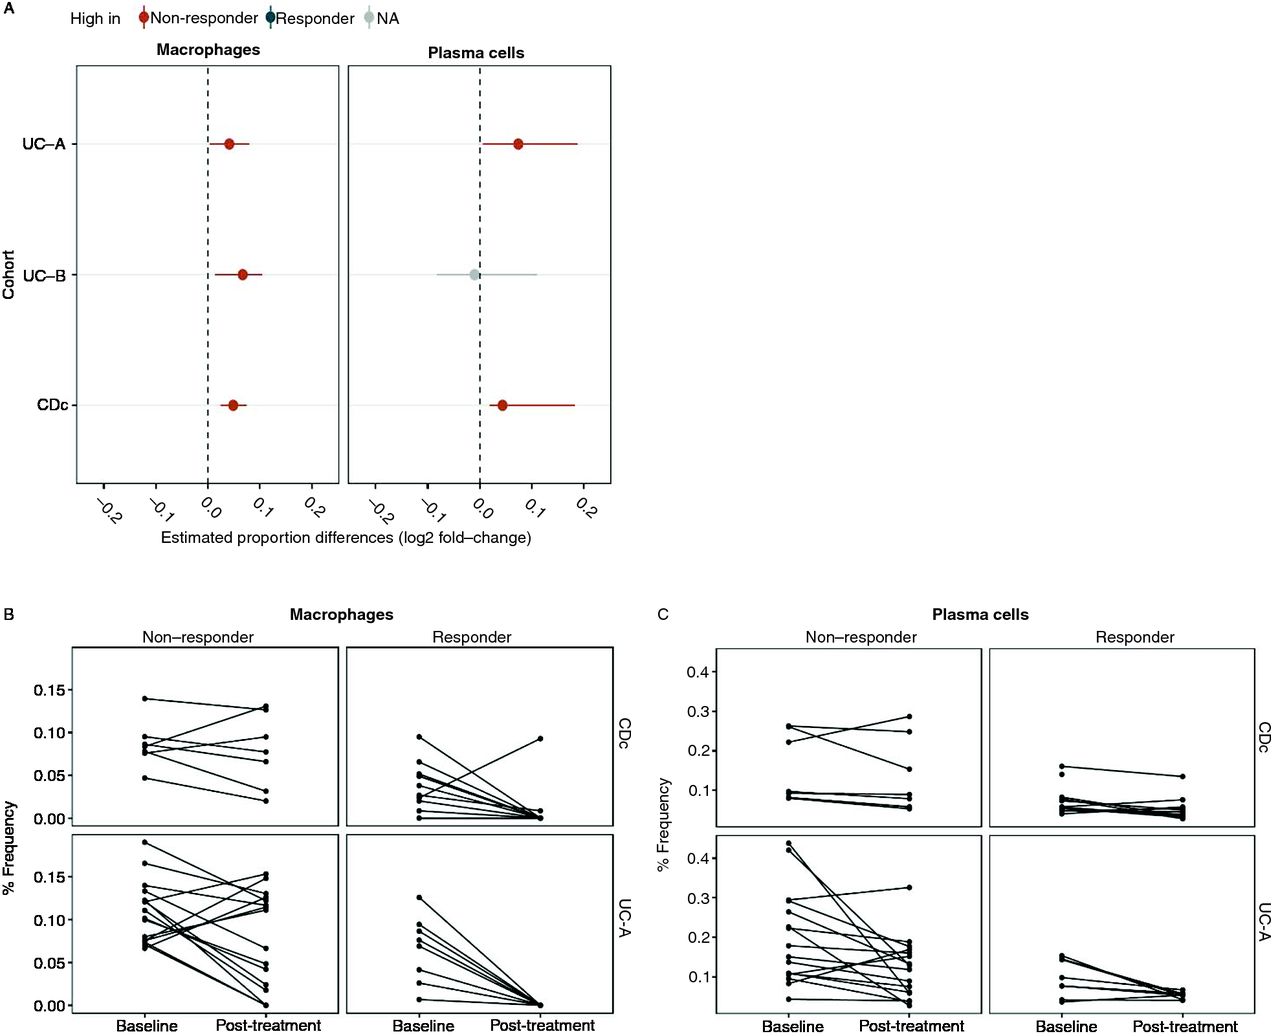
Meta-analysis of computationally deconvolved cell subset proportions identifies consistently higher proportions of inflammatory macrophages and plasma cells in non-responders. (A) Plasma cell and macrophage log2 proportion fold change between response groups, across three cohorts (P values ≤0.05 by Wilcoxon rank sum are shown in red and grey for significantly higher proportions in non-responders and no significant changes, respectively). (B,C) Cellular signature abundance decreases while differences persist after anti-TNFα treatment. Deconvolution-derived frequencies of inflammatory macrophages (B) and plasma cells (C) pre/post-anti-TNFα treatment (x-axis). TNFα, tumour necrosis factor alpha.
Baseline plasma cell proportions are predictive of anti-TNFα non-response
The significant differences we observed in immune cell subset proportions between response groups suggested they may serve as clinically feasible predictive biomarkers of non-response. Adjusting the expression data of each cohort for variations in the cellular biomarker proportions showed a significant decrease (a mean drop of 32%) in the ability of gene signature scores to discriminate responders from non-responders (see online supplementary figures 5 and 6). These results suggest that the predictive power of reported gene signatures is largely based on cell subset proportion differences, whose increase in colon biopsies of non-responders may serve for predictive purposes.
Next, we analysed an independent set of 20 paraffin-embedded colon biopsies collected as part of standard clinical care from patients with IBD for which anti-TNFα response status was available. These were stained for inflammatory macrophages and for plasma cells using IHC staining and assessed for cell type abundance using a discrete scoring (low/medium/high) performed by an expert pathologist who was blind to patient response status (see the Materials and methods section). In agreement with our computational analysis, we observed both plasma cells and inflammatory macrophages as associated with non-response to therapy (figure 3A,B plasma cell area under the curve (AUC)=71%, 81% by pathologist and quantification, respectively, inflammatory macrophages AUC=67% by pathologist), while total macrophages abundance was not predictive (AUC 48%).

Abundance of plasma cells and macrophage subtypes in biopsies of patients with IBD predicts anti-TNFα treatment outcome. (A) Plasma cells were immunostained with anti-CD138 antibody in an independent set of IBD biopsies. Example staining slides showing visual differences in plasma cells between responders and non-responders patients. CD138+ plasma cells are coloured in brown, showing a clear increased staining in non-responsive patients. (B) ROC curves showing the predictive power of plasma cells (cyan) and inflammatory macrophages (orange) proportions as quantified by a pathologist categorical score (solid line, AUC=71% and AUC=67%, respectively) and a quantitative score for plasma cells (dashed line, AUC=81%). (C) ROC curve analysis of a cohort of 52 patients with IBD collected from two medical centres whose biopsies were stained by CD138+ IHC staining. Plasma cell abundance classifies non-response at baseline (AUC=71% and AUC=74% by the pathologist and quantitative scores, respectively). (D) This predictive power increases when restricting to highly inflamed tissues according to the pathologist score (AUC=82% and AUC=84% by the pathologist and quantitative scores respectively). AUC, area under the curve; CD, Crohn’s disease; IHC, immunohistochemistry; ROC, receiver operating characteristic.
For clinical feasibility, a biomarker must exhibit reproducibility and ease of use. Plasma cells have a unique morphology and can be sufficiently defined by a single marker, CD138.23 24 We thus decided to focus on plasma cells and collected a second cohort consisting of 61 patients from two medical centres (35 responders and 26 non-responders, table 2). We examined plasma cell frequencies by CD138+ IHC staining and again observed a significantly higher frequency of plasma cells in non-responders as evaluated by an expert pathologist and by automated quantification (P=0.02 and P=0.0005 by Student’s t-test, online supplementary figures 7A–B). This difference enabled predicting non-response class at baseline (figure 3C, 71% and 74% AUC, n=52, supplementary methods), which was further increased when we restricted our analyses only to highly inflamed tissues (figure 3D, AUC=82% and 84% by an expert pathologist and quantitatively, n=20, P=0.005/P=0.002 by Student’s t-test, online supplementary figure 7C). Taken together, our computational deconvolution predictions and external validations confirmed that pretreatment plasma cell abundance is associated with non-response to anti-TNF treatment and suggested that relevant immune pathways should be further studied to understand non-response pathophysiology.
A dysregulated gene network masked by cell proportion variation
Given the differential abundance of inflammatory macrophages and plasma cells between the two response groups, we reasoned that underlying biological signals may be masked by this difference. To characterise the biological processes associated with non-response that cannot be explained by cell subsets differences, we searched for pathways and genes differentially expressed while adjusting each individual’s gene expression profile for variations in the two cell subsets (see the Materials and methods section). We found 15 pathways that were dysregulated across all cohorts (FDR=0.05) using gene set enrichment analysis (GSEA),25 all of which were upregulated in non-responders and related to immune signalling and inflammation (figure 4A, online supplementary figure 8A,B). Most prominent was the association of non-response with the MyD88 deficiency (which impairs toll-like receptors (TLR2/4) function), interleukin 6 signalling and antigen activation of B-cell receptor, which had a substantial fraction of genes in the GSEA-leading edge (64%, 30% and 26% of genes, respectively (see online supplementary figure 8C)).
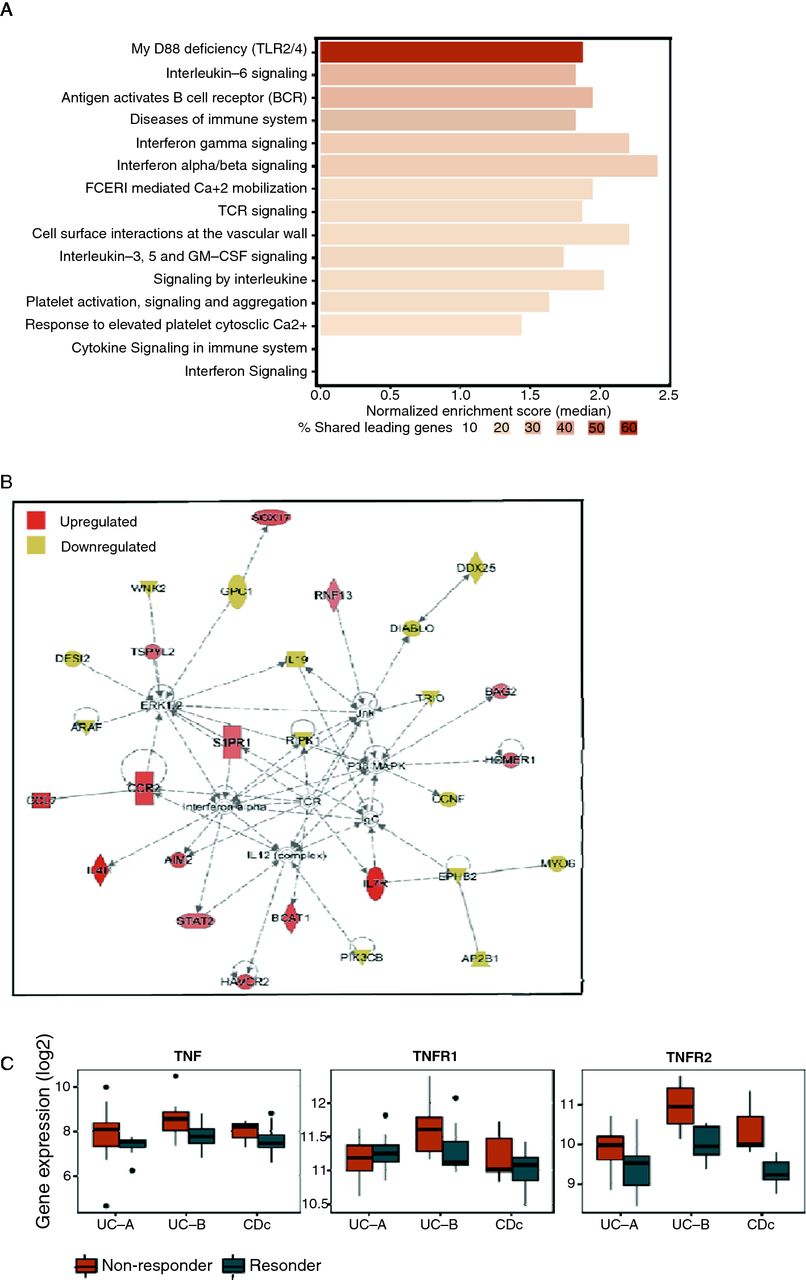
Adjusting samples for cell subset variation unmasks upregulated pathways in biopsies of anti-TNF non-responders. (A) Meta-analysis of non-response associated biological pathways by GSEA on cell subset adjusted expression data supports upregulation of TLR2/4, IL-6 and B cell receptor signalling, as well as other inflammatory pathways. (B) Top enriched IPA network identified from meta-analysis of cell subset adjusted gene expression data. The CCL7-CCR2 axis is upregulated in non-responders (C) Box plots showing the expression of TNFα and its receptors, TNFR1 and TNFR2 in the three biopsy cohorts in the original unadjusted data. CCL7, chemokine ligand 7; CCR2, chemokine receptor 2; GSEA, gene set enrichment analysis; IL-6, interleukin 6; IPA, Ingenuity pathway analysis; TLR, toll-like receptor; TNFα, tumour necrosis factor alpha.
At the gene level, we identified 166 differentially expressed genes (DEG) in at least two cohorts following adjustment to plasma cells and activated monocytes (62 upregulated and 104 downregulated, P≤0.05, online supplementary table 9). We analysed this set of genes using Ingenuity Pathway Analysis (IPA), in particular, searching for links to our predictive cellular biomarkers. One of the topmost enriched networks included 28 genes, including the ligand–receptor pair, chemokine ligand 7 (CCL7)–chemokine receptor 2 (CCR2), which we found to be upregulated in non-responders (figure 4B, online supplementary table 11). The CCL7–CCR2 axis has been associated with inflammation26 and upregulated in IBD.27 28 In the mucosa of patients with IBD, CCL7 is produced by epithelial cells and correlates with the degree of epithelial destruction at inflammation sites.29 CCL7 is also produced by inflammatory lymphocytes including plasma cells, whereas CCR2 is expressed primarily on monocytes and mediates their recruitment to inflamed tissues.28
Interestingly, IPA analysis identified triggering receptor expressed on myeloid cells 1 (TREM-1) as an upstream regulator of six of the adjustment-derived DEG, including CCL7.30 TREM-1 is expressed on myeloid lineage cells including monocytes and macrophages, has well-documented proinflammatory functions and its blockade has shown promising results in attenuation of symptoms in IBD models.31 32 Meta-analysis of TREM-1, CCL7 and CCR2 gene expression across the public data biopsy cohorts showed all these genes to be consistently upregulated in the non-responder group in the original unadjusted measured data (meta-FDR <0.037). In addition, we directly tested differential expression of TNF-related genes and found TNFα and TNFR2 as upregulated in non-responders in the original unadjusted data (figure 4C), possibly due to TREM-1 activation via synergism with TLR signalling. Unlike CCL7 and CCR2, their expression difference post-adjustment was reduced, suggesting that TNFα secretion originates from the inflammatory macrophages (see online supplementary figure 9).33 Taken together, these results suggest that CCL7–CCR2 axis is responsible for the recruitment of inflammatory TNFα secreting macrophages to the inflamed area, which ultimately impacts response potential.
TREM-1 expression is a predictive biomarker in blood
From the point of view of clinical application, prognostic tests performed on blood samples are non-invasive and hence of high value. We looked at whether our findings could lead towards cellular or molecular biomarkers in blood samples. To do so, we profiled whole-blood gene expression from a cohort of 22 patients with CD prior to anti-TNFα therapy, whose subsequent response status has been determined similarly to the primary biopsy validation cohort criteria (cohort 3 in table 2, and the Materials and methods section). We focused our analysis on the TREM-1–CCL7–CCR2 axis and tested these genes in a hypothesis-directed manner only. Of these, TREM-1 was the only gene differentially expressed between responders and non-responders (downregulated in non-responders, adjusted P value=0.007, figure 5A and online supplementary figure 10) in blood and notably showed a very high prediction accuracy (figure 5B, AUC=94%). Importantly, TREM-1 was overall highly expressed (average log2-expression≥11.9) providing further confidence in the measured signal. In addition, we observed that TREM-1 and CCR2 gene expression levels in blood were correlated with endoscopic activity in an additional cohort of patients with UC16 (see the Materials and methods section), further supporting monitoring of this axis in blood as an important clinical non-invasive biomarker.

TREM-1 expression in blood predicts anti-TNF non-response at baseline in Crohn’s patients. (A) Box plot showing TREM-1 mRNA expression as measured in whole blood of 22 responding (blue) and non-responding (red) patients with CD, prior to initiation of infliximab therapy. (B) Receiver operating characteristic curve of classifier of anti-TNF response at baseline based on TREM-1 expression in whole blood. CD, Crohn’s disease; mRNA, messenger RNA; TREM-1, triggering receptor expressed on myeloid cells 1.
Discussion
Infiltrating and resident immune cells in the intestinal tissue are key factors in IBD aetiology and progression,34 as such, we undertook a cell-centred approach to analyse publicly available datasets of colon biopsies of patients with IBD. As cell subset variation is the biggest confounder of gene expression data signals,22 our analysis differs from previous studies of the same data10 11 13 15 and clearly delineates cell abundance changes from alterations in mRNA expression. We estimated immune cell subsets proportion in colon biopsies and show for the first time that the pretreatment abundances of intestinal plasma cells and inflammatory macrophages are increased in anti-TNFα non-responders. We validated plasma cell abundance as a robust biomarker of anti-TNFα non-response at baseline in two independent cohorts. Akin to how pathway-level analyses are more reproducible than single gene-level analysis,35 we expect the findings at the cell level to be more robust and reproducible than gene biomarkers and easier to derive immunological insights and mechanistic hypotheses. Beyond this, by explicitly accounting for cellular variation in the data, we show that the CCR2–CCL7 axis and its upstream regulator TREM-1 are involved in anti-TNFα responsiveness mechanism and identify TREM-1 expression in peripheral blood as a predictor of non-response.
Our findings suggest a link between chronic inflammation and anti-TNFα non-response physiology: during intestinal inflammation, inflammatory macrophages secrete proinflammatory cytokines including TNFα.33 36 In the case of anti-TNFα non-responders, our analysis suggests increased abundance of inflammatory macrophages in the tissue, even prior to treatment. This likely results in elevated TNFα secretion at the inflammation site, as evidenced by the increased TNFα mRNA expression we detected in biopsies. Increased levels of TNFα have been shown to support plasma cell survival,30 37 and those in turn, in non-responders, are also at an increased abundance, as we validated in two separate patient cohorts. Ongoing inflammation and epithelial damage trigger epithelial-mediated and lymphocyte-mediated secretion of CCL7, a promigratory cytokine, which increases monocyte migration to the inflamed colon where they differentiate into macrophages. TREM-1 which is an upstream regulator of the CCL7-CCR2 axis is expressed on monocytes and macrophages, supported by its reduced differential expression following cell proportion adjustment. TREM-1 is known to promote inflammation by driving robust production of inflammatory cytokines, including interleukin 8 and TNFα, especially in context of TLR pathways activation.38 39 In addition, TREM-1 was shown to be upregulated by various stimuli such as the TLR ligands, including distinct microbial structures, and directly by TNFα, possibly suggesting that an altered microbiome composition between anti-TNFα responders and non-responders9 can influence its differential expression as well.
From a physiological perspective, this entire intercellular proinflammatory circuitry appears to be upregulated in non-responding individuals and is also supported by plasma cell accumulation in the colon mucosa being an early feature of IBD and predictor of shorter time to clinical relapse.40 41 During IFX therapy, circulating monocytes undergo apoptosis, and a shift towards proresolving macrophages occurs in the lamina propria, yielding reduced inflammation, tissue repair and remission.36 42 43 Our analysis post-treatment suggests this process occurs to a lesser extent in non-responding individuals implying that the immune milieu we observe in patients lies along a continuous immune-phenotypic inflammatory space, in which non-responders represent an extreme. If a non-responsive profile is merely a more exacerbated form of inflammation,16 then an increased drug dose may bring effective disease remission. In support of this, patients with acute severe colitis showed increased efficacy when treated with higher drug doses.44
Conversely, non-responders may represent a phenotypic niche which is difficult to resolve therapeutically via anti-TNFα treatments, in which case based on baseline detection of non-response one may elect an alternative therapeutic. Our findings suggest that blocking the mechanism that draws increased numbers of plasma cells and inflammatory macrophages to intestinal mucosa would be of benefit. Indeed, experiments in mice showed that blocking CCR2, simultaneously with CCR5 and CXCR3, prevents experimental colitis.45–47
From a clinical perspective, a major implication of the current study is the possibility to predict response to anti-TNF treatment. As noted, the primary failure rate to anti-TNFα therapy is significant,4 resulting in accumulation of tissue damage and significant costs. We have demonstrated two approaches for predicting therapy response. The first is the quantitation of plasma cell frequency in the intestinal tissue as quantitated both by an expert pathologist and digital quantitation. Although yielding valuable physiological information, this approach is disadvantaged by the need to perform pretreatment endoscopy. In addition, the performance of plasma cells as a cellular biomarker of response was improved as a function of inflammation severity in the biopsied tissue, indicating that plasma cell differences between response groups are likely a secondary outcome of inflammation. Importantly, our results indicate that measurement of pretreatment peripheral blood TREM-1 expression may serve as a practical, easy to measure predictor for anti-TNF response. Once relevant cut-off values are determined, such measurements will allow to personalise treatment, prevent unnecessary tissue damage and expenditures.
Our study has several limitations. From an analysis perspective, the reference cell subset gene expression we used for the cellular deconvolution analysis is not a complete compendium of all of the immune cell types in the intestine (eg, missing are stromal cells, innate lymphoid cells, gamma delta T cells and others), and thus this may affect our interpretation. The biopsy validation study was performed using real-life pretreatment biopsies obtained without a predefined study protocol. While reassuring in terms of clinical relevance and unbiased study population, a predefined study protocol would potentially allow better clinical correlation and standardisation needed in the clinical setting, as well as more standardised tissue sampling. Similarly, the results obtained from peripheral blood were correlated with clinical scores and biomarker measurements but not with endoscopic scoring. Although CRP is more sensitive than clinical scoring to detect disease activity48 and faecal calprotectin correlates well with endoscopic scoring,49 the results require further confirmation in a larger standardised clinical trial including endoscopic treatment outcomes. Additionally, we used data obtained from both UC and CD patients. While not conforming with the accepted regulatory approaches for the differential study of these diseases, this approach may actually represent an investigational advantage since it relates directly to the biological characteristics of drug response and thus aids in the dissection of the relevant molecular events associated with it. Last, our results do not yet provide an understanding of how these distinct immune milieus we observed between the response groups come about; to do so will require longitudinal studies tracking patients with early IBD.
In conclusion, we identify here novel predictors for anti-TNF therapy in biopsy and blood, stemming from public domain data and validated on real-life patient cohorts. The statistical methodology we use for discovery, combining cell-centred deconvolution17 with meta-analysis,21 allows to unmask and better interpret signals normally hidden from view while increasing detection power and reproducibility of findings. This methodology may of course be extended further into other scenarios and disease conditions, especially with the vast amounts of data now available in the public domain.
Supplemental material
Acknowledgments
The authors wish to thank the Israeli IBD Research Network (IIRN) for discussions and advice. D Cohen for high performance computing, E Suss-Tuby for imaging support and members of our laboratories for fruitful discussions.
References
Footnotes
RG, ES and NM contributed equally.
YC, PK and SSS-O contributed equally.
Contributors RG, FV, ESt, NM,SP, PK, YC and SSS-O designed the research; RG, ESt, NM, FV and ESa analysed the data; ESt, NM, ESa and SP performed the experiments; HB-Y, SP, RW, IG, MW,KR, HY, ID, ESa and YC contributed to clinical part; RG, ESt, NM, FV, PK, YC and SSS-O wrote the manuscript.
Funding This work was supported by funding of the Helmsley Charitable Trust to YC, SSS-O and ID. PK is funded by the NIH’NIAID (grants U19AI109662, U 19AI057229, and U54I117925) and the Bill and Melinda Gates Foundation. FV by NIH K12 fellowship #5K12HL120001-02, RG was funded by the Lady Davis postdoctoral fellowship and by NIH’NIAID U19AI090019.
Competing interests YC declares Abbvie grant support, advisory and lecture fees, Janssen advisory and lecture fees, Takeda grant support and advisory and lecture fees, Pfizer advisory and lecture fees and Protalix Advisory fees. RG and ESt declares CytoReason equity and advisory fees. RG declares equity in CytoReason. SSO-O declares CytoReason equity and advisory fees and Takeda grant support.
Patient consent Obtained.
Ethics approval RAMBAM hospital IRB, Ichilov hospital IRB.
Provenance and peer review Not commissioned; externally peer reviewed.