Article Text

Abstract
Objective Bacterial translocation to various organs including human adipose tissue (AT) due to increased intestinal permeability remains poorly understood. We hypothesised that: (1) bacterial presence is highly tissue specific and (2) related in composition and quantity to immune inflammatory and metabolic burden.
Design We quantified and sequenced the bacterial 16S rRNA gene in blood and AT samples (omental, mesenteric and subcutaneous) of 75 subjects with obesity with or without type 2 diabetes (T2D) and used catalysed reporter deposition (CARD) – fluorescence in situ hybridisation (FISH) to detect bacteria in AT.
Results Under stringent experimental and bioinformatic control for contaminants, bacterial DNA was detected in blood and omental, subcutaneous and mesenteric AT samples in the range of 0.1 to 5 pg/µg DNA isolate. Moreover, CARD-FISH allowed the detection of living, AT-borne bacteria. Proteobacteria and Firmicutes were the predominant phyla, and bacterial quantity was associated with immune cell infiltration, inflammatory and metabolic parameters in a tissue-specific manner. Bacterial composition differed between subjects with and without T2D and was associated with related clinical measures, including systemic and tissues-specific inflammatory markers. Finally, treatment of adipocytes with bacterial DNA in vitro stimulated the expression of TNFA and IL6.
Conclusions Our study provides contaminant aware evidence for the presence of bacteria and bacterial DNA in several ATs in obesity and T2D and suggests an important role of bacteria in initiating and sustaining local AT subclinical inflammation and therefore impacting metabolic sequelae of obesity.
- obesity
- inflammation
- intestinal permeability
- obesity surgery
- bacterial translocation
Statistics from Altmetric.com
Significance of this study
What is already known on this subject?
Intestinal microbial composition and function can be altered by a western diet.
Alterations in gut microbiome result in host pathologies, including obesity, inflammation, insulin resistance and type 2 diabetes.
Metabolic phenotypes like obesity are transmissible via microbiota transfer.
Studies in animal models revealed ‘leaky gut’ as a mechanism whereby diet-induced intestinal microbiota shifts contribute to metabolic disease states.
Bacterial translocation to human adipose tissue remains poorly understood, and its impact on metabolism remains elusive.
What are the new findings?
Bacteria is present in human adipose tissue.
Bacterial DNA is present in human omental, subcutaneous and mesenteric adipose tissue in the range of 0.1–5 pg/µg DNA isolate.
Bacterial composition in human adipose tissue is reminiscent of the gut microbiome.
Proteobacteria and Firmicutes are the predominant phyla in adipose tissue.
Mesenteric adipose tissue is the primary site of bacterial translocation reflected in the highest bacterial diversity across tissues.
Bacterial quantity in adipose tissue is associated with immune cell infiltration, inflammatory and metabolic parameters.
How might it impact on clinical practice in theforeseeable future?
Our study provides contaminant aware evidence for the presence of bacteria and bacterial DNA in several adipose tissues in obesity and type 2 diabetes.
The study suggests an important role of bacteria in initiating, and sustaining local adipose tissue subclinical inflammation and therefore impacting metabolic sequelae of obesity.
Understanding of specific bacterial contribution to local and systemic metabolic status could lead to novel treatments based on tissue-specific delivery of protective bacterial component as has been done systemically with pasteurised bacteria (eg, Akkermansia muciniphila) leading to reduced obesity and metabolic improvement.
Introduction
There is compelling evidence that the intestinal microbial composition and function can be altered by a western diet and that these alterations result in host pathologies, including obesity, inflammation, insulin resistance and type 2 diabetes (T2D), phenotypes that are transmissible via microbiota transfer.1–5 In this context, one poorly understood feature of metabolic disease is the alteration and dysfunction of the intestinal barrier accompanied by an increase in intestinal permeability. Intestinal permeability is regulated through two major routes: transcellular, which is controlling the transport of solutes across the epithelial cells, and paracellular, which is regulated by cellular junctions between the cells. Disruptions in this intricately balanced system through toxins, microorganisms, nutrients or food contaminants can lead to an alteration of the intestinal permeability, mainly by an increased and inadequately controlled influx via the paracellular route.6 First studies in the 1950s suggested that increased endotoxins, which are lipopolysaccharides of Gram-negative bacteria in the circulation are a result of an increased intestinal permeability.7 Recently, altered intestinal permeability has been proposed as a mechanism whereby diet-induced intestinal microbiota shifts contribute to these metabolic disease states in animal models: intestinal microbiota alterations in high-fat diet (HFD)-fed mice associate with intestinal inflammation, increased intestinal permeability, bacterial intestinal mucosal adherence and transmucosal bacterial translocation to mesenteric adipose tissue (AT) and blood.8–11 These events correlate with increases in adiposity and weight gain, mesenteric AT inflammation, systemic and tissue inflammatory markers leading to metabolic dysregulation and insulin resistance in mice.8–11 Antibiotics intervention significantly improves these abnormalities, including intestinal integrity, even under HFD challenge.8 12 Combined, these results advocate for a contributing role of bacterial translocation to obesity, inflammation and metabolic dysfunction in mouse models. Moreover, differences in bacterial translocation may contribute to the large variance in obesity-related pathologies. However, obesity and diabetes itself may affect the intestinal permeability as shown by Wang et al,13 who observed a significantly increased permeability in leptin-deficient (ob/ob) and hyperleptinaemic but leptin-receptor mutant (db/db) mice,14 which constitute widely used animal models in obesity and T2D. However, it remains to be determined whether similar mechanisms of microbial-induced pathology exist in humans, and whether specific bacterial taxa might have a key role.15 16 Few human studies have demonstrated that intestinal permeability is associated with visceral adiposity17 and metabolic syndrome in obese individuals,18 is increased in patients with T2D and is significantly correlated with serum C reactive protein (CRP) levels.19 Moreover, the amount of circulating bacterial DNA has been shown to play a role in the development of cardiovascular events20 and T2D.21 Based on these results, it was hypothesised that bacteria in the circulation might also migrate into other organs such as AT, contributing to the commonly observed chronic low grade inflammation in insulin resistance and T2D. Yet, the pathological process leading thereto is ill-defined in humans.
Therefore, we aimed to investigate whether bacterial DNA is present in different AT depots of subjects with obesity and if the amount and composition of these bacteria can be attributed to their metabolic and/or inflammatory state.
Methods
The overall study design is provided in the online supplementary figure 1.
Supplemental material
Study subjects
Seventy-five patients with obesity undergoing laparoscopic Roux-en-Y gastric bypass surgery were recruited at the University of Leipzig Medical Center, Germany. Exclusion criteria included chronic or acute inflammatory disease as defined by white cell counts and/or high-sensitive CRP (hsCRP) alongside clinical symptoms, antibiotics treatment within 2 months prior to surgery, pregnancy and/or nursing. All subjects underwent routine clinical phenotyping including oral glucose tolerance test, collection of anthropometric (age, sex and body mass index (BMI)) and metabolic parameters such as fasting plasma glucose (FPG), fasting plasma insulin, high-density lipoprotein (HDL) cholesterol, homeostasis model assessment for insulin resistance (HOMA-IR), haemoglobin A1c (HbA1c) as well as blood cell count.
Assessment of inflammatory status
White cell count and hsCRP were measured according to local laboratory routine practice. Circulating levels of tumour necrosis factor alpha (TNF-α) and interleukin 6 (IL-6) were measured by high-sensitive ELISA (R&D Systems, Minneapolis; HSTA00E and HS600B) using undiluted serum according to the manufacturer’s protocol. Lipopolysaccharide binding protein (LBP) was measured by ELISA (Hycult Biotech, Uden, Netherlands, #HK315-02) using diluted plasma (1:1000) according to the manufacturers’ protocol.
Sample preparation
AT biopsies (abdominal subcutaneous, omental-visceral and mesenteric-visceral) were collected before opening the intestine to prevent spill-over contamination during laparoscopy. Surgeries were routinely performed under filter CO2, minimising the contact collected tissues had with air in the operation theatre. Subcutaneous AT was taken from the incision of the first trocar in the left paramedian midabdomen, omental tissue was taken from the mid of the pars libera of the greater omentum and mesenteric tissue was excised from the mesenterium of the midjejunum close to the bowel wall and immediately put in pretreated falcons with UV and subsequently put on ice by the operating surgeon himself. Prior to processing of the tissues in a pre-PCR lab, the laminar flow-hood as well as the required lab ware (tubes, pipettes and instruments including centrifuge) were pretreated with UV for at least 90 min. After transferring and aliquoting, samples were immediately frozen in liquid nitrogen and stored at −80°C. All handling steps were done by personal wearing long surgical gloves, disposable surgical gowns and surgical caps. A summary of all taken countermeasures is illustrated in online supplementary figure 1.
DNA was isolated using Qiagen DNeasy Kit with an additional lysozyme degradation step at a 0.25 mg/mL dilution (L7615, Sigma-Aldrich, Missouri, USA). A negative control (UV-treated PBS) was included for each isolation and included in all subsequent steps. RNA was isolated using Qiagen RNeasy Lipid tissue mini kit and was reversely transcribed using Super Script III (ThermoFisher Scientific, Massachusetts, USA).
Immunohistochemistry (IHC) and catalysed reporter deposition fluorescence in situ hybridisation (CARD-FISH)
Sample aliquots for IHC were incubated in 4% paraformaldehyde in PBS for at least 24 hours and embedded in paraffin. Paraffin blocks were sliced into 6 µm slides and treated with DAKO retrieval solution (pH=9) for 30 min by applying hot steam. Adipocytes were stained with anti-perilipin-1 (goat, 1:200; Abcam, Cambridge, UK) and macrophages with anti-Iba1 (rabbit, 1:500; Fujifilm Wako Chemicals, Tokyo, Japan). Donkey serum was used as blocking buffer, and the primary antibody was incubated at 4°C overnight. As secondary antibodies, donkey anti-goat with Alexa Fluor 488 (1:200) and donkey anti-rabbit with Alexa Fluor 568 (1:200; both Invitrogen, California, USA) were used for 1 hour at RT. Supervised automated analysis was performed using CellSens software (OLYMPUS Life Science, Shinjuku, Japan) to assess adipocyte count and diameter as well as counts of macrophages and crown-like structures in AT.
Furthermore, paraffin-embedded sections were collected on polylysine-coated glass slides for visualisation of bacterial cells using CARD-FISH. An extended protocol including all buffer recipes can be found in the supplements (online supplementary methods and tables). All steps were performed under sterile conditions, and all lab-ware was either UV treated or autoclaved, and Milli-Q water to prepare buffers was autoclaved and filter sterilised using 0.2 µm PC Isopore Membrane (Merck, Darmstadt, Germany). Buffers were always prepared immediately before use and adequate negative controls to verify sterility of all steps, that is, empty polylisine slide, paraffin sections containing slide and filters containing filtrate of the hybridisation buffer, were included. Briefly, deparaffinised sections were sequentially treated with Proteinase K buffer, SDS buffer, lysozyme buffer as well as achromopeptidase buffer for 5 min at 37°C to achieve permeabilisation. Hybridisation with HRP-labelled CARD-FISH probes (EUB338I, II, III and NON338; 0.17 ng/mL)22–24 was performed at 46°C for 3 hours, and afterwards slides were treated with wash buffer for 15 min at 48°C and for 15 min at room temperature in 1×PBS. CARD-FISH was performed by incubating the sections for 20 min at 46°C in amplification buffer, rinsing the sections for 10 min at room temperature with 1×PBS and staining with DAPI (1 µg/mL) for 10 min at room temperature. After embedding in mounting medium, sections were stored at −20°C prior to imaging. CARD-FISH was performed on 30 different consecutive and randomly selected sections with at least 60 µm intervals from each other from subcutaneous AT collected from patients selected based on quantification results and belonging to the high, medium and low tercile.
Supplemental material
Gene expression
Gene expression was measured using TaqMan probes with 2x PCR mastermix (Applied Biosystems, Foster City, USA) on a LightCyler 480 (Roche, Basel, Switzerland) in a 384-well format. Plates were pipetted on a Pipetmax platform (Gilson, Wisconsin, USA). For optimal normalisation, nine reference genes were tested for their stability over all analysed tissues between insulin sensitive and insulin resistant subjects. Two genes, GAPDH and B2M, were chosen as final reference genes. PCR efficiency was calculated using a duplicated standard curve in each run. Standard curves needed to have an R²>0.98 for the run to be included. Mean PCR efficiency was 1.85±0.06. Analysis was done according to the ΔΔCt method.25
Cell culture
Conditionally immortalised human subcutaneous preadipocytes from a non-diabetic, 30–40 year old male donor (LONZA Walkersville, Maryland, USA) were grown in SkBM-2 medium (LONZA) supplemented with human epidermal growth factor, dexamethasone, l-glutamine, fetal bovine serum and gentamicin/amphotericin-B. Preadipocytes were split onto 6-well plates and cultured until reaching 95% confluency in 5 mL growing medium at 33°C with 5% CO2 and 90% humidity before starting differentiation. Differentiation medium contained DMEM with 4.5 g/L glucose and was supplemented with L-glutamine, fetal bovine serum, gentamicin/amphotericin-B, dexamethasone, insulin, isobutyl-methyl xanthine and indomethacin. Culture conditions in differentiation medium changed to 37°C with 5% CO2 and 90% humidity and preadipocytes were differentiated for 10 days and contained about 380 000 viable cells. All cell culture experiments described below were run in triplicates. Bacterial DNA equivalent to 1% (~0.014 ng/well) of human cells was used as lowest treatment condition, taking a standard Escherichia coli genome (4.7 MBp) as reference. Additional concentrations in 10-fold increments were used as positive controls, and cells were incubated for 4, 24 or 72 hours. An equivalent volume of water was used as negative control for each time point and experiment to calculate fold changes.
Quantification of bacterial DNA
Quantification of bacterial DNA in blood and AT was performed according to Amar et al.20 The primers (5′-CGGTGAATACGTTCCCGG-3′ and 5′-TACGGCTACCTTGTTACGACTT-3′) were used accordingly with optimised PCR conditions (98°C for 2 min; 42 cycles of 95°C/15 s, 60°C/30 s, 72°C/20 s) with a High Resolution Melting master mix (Roche, Basel, Switzerland 04909631001). A duplicated standard curve using purchased E. coli JM 109 DNA dilutions (Promega, Madison, USA) was used for quantification. Results were in concordance with a commercially available kit (Zymoresearch, California, USA) (n=13, r=0.74, p=0.004) and proved more sensitive (ΔCt=3.9).
Amplification and sequencing of V4V5 region of 16S rRNA
A variety of 16S primers were tested; however, non-specific human DNA amplification was observed for most due to very low amounts of bacterial DNA in the samples. Consequently, primers adapted from the Ribosomal Database Project26 and Claesson et al 27 amplifying the V4/V5 region (V4-F: 5′-actgggcgtaaagcg-3′; V5-R: 5′-ccgtcaattcctttgagttt-3′) were used. In addition, based on the current literature, the V4V5 region introduced little to no bias,28 more reproducible results29 and more amplicons compared with other regions.30 After extensive testing of various polymerases, the high-fidelity Q5 proof reading polymerase was chosen for amplification (New England BioLabs, Ipswich, USA). A detailed summary of all tested primers and polymerases can be found in online supplementary tables S4 and S5. All negative controls as well as additional PCR-negative controls for each run were included, amplified and sequenced. Paired-end sequencing was performed by BGI Genomics (Shenzhen, Guangdong, China) on a HiSeq 2500 platform with an average of 2×1 57 045 (±68 730) raw reads.
Statistics
All statistics were performed in R 3.5.1 (R Core Team, 2018) and SPSS V.24 (IBM, Armonk, New York). All figures were generated in R 3.5.1 using ggplot2 v3.1.1,31 phyloseq v1.26.1,32 vegan v2.5–433 and circlize v0.4.734 and were relabeled using Adobe Illustrator (Adobe Inc, California, USA). Spearman’s rank correlation test was used for correlation analyses of non-normally distributed data. Student’s t-test and Wilcoxon signed-rank test/Mann-Whitney U test were used for group comparisons based on data distribution, which was tested by Kolmogorov-Smirnov test. Multiple testing problems were addressed by FDR adjustment if not stated otherwise and nominal (p) and adjusted (q) values are given.
Analysis of 16S data
Preprocessed and quality-filtered paired end sequencing data (avg. 112,973±48 825 reads) were obtained from BGI Genomics. Preprocessing included removal of reads with a certain proportion of low quality (20) bases (20% of read original length), removal of reads contaminated by adapter (five bases overlapped by reads and adapter with maximal three bases mismatch allowed), removal of reads with ambiguous bases and removal of reads with low complexity (reads with 10 consecutive same base). Data were imported to Qiime2 v2018-1135 with all subsequent steps performed using QIIME2 plugins for the cited software packages. Paired-end joining and denoising was performed with DADA2,36 leaving 3663 features in 370 samples (including negative controls) with a median frequency of 77 601 (40 141–103 152) reads and a mean length of 325.6±15.1 base pairs. A rooted tree was generated using the align-to-tree-mafft-fasttree.37 Taxonomic assignment was performed using the q2-feature-classifier,38 which was trained for the used primers using the 99% OTU data set of the SILVA 132 release.39 Subsequently, taxonomy and generated feature tables were imported to phyloseq v1.26.132 for further analysis. All features not assigned to bacteria, as well as mitochondrial and chloroplast features were excluded (∑=193). Decontam V.1.2.140 was used to filter out features on genus level with a high chance of being contaminants using sequenced negative controls. Prevalence-based contaminant identification was used with a threshold score of 0.5, filtering out 41% of features as potential contaminants and leaving 309 genera. Additionally, samples with only contaminants were excluded, resulting in 317 samples taken forward for further analysis. Comparison of alpha diversity (Observed, Shannon) was done in phyloseq and ordination analysis including calculating Bray-Curtis dissimilarity,41 multivariate homogeneity of Groups dispersions and distance-based redundancy analysis were performed using vegan v2.5–4.33 Differential abundance was calculated with DESeq2 v1.22.2,42 applying poscount type for size factor estimation, followed by a Wald significance test employing a local fit. Correlation of genera with markers of interest was performed using the microbiome package for R v1.4.243 employing Spearman’s rank correlation.
Results
Inflammatory burden and metabolic impairment in the study cohort
Seventy-five patients undergoing bariatric surgery were recruited for this study, whereof 33 had T2D. Parameters of glucose metabolism including FPG, HOMA-IR and HbA1c and circulating inflammatory markers such as TNF-α, IL6 and CRP were significantly higher in subjects with T2D compared with individuals without T2D (table 1). Subjects with T2D were significantly older (45.2±11.0 vs 52.5±11.3 years, p=0.006). As expected, measures of inflammation correlated positively with HOMA-IR and HbA1c and negatively correlated with HDL-cholesterol.
Cohort characteristics
Furthermore, circulating inflammatory parameters such as TNF-α (rho=0.29, p=0.02) and CRP (rho=0.32, p=0.01) correlated significantly with LBP levels, which in turn were correlated positively with BMI (rho=0.32, p=0.01) and fasting plasma insulin (rho=0.28, p=0.03) and increased in patients with T2D although not significantly (11.5±3.9 vs 13.9±5.7 ng/µL, p=0.05) (table 1).
Bacterial DNA is detectable in AT
We detected bacterial 16S rRNA gene in human AT as well as blood in a range of 0.1–5 pg per µg total DNA. All biological samples had significantly higher amounts of bacterial DNA compared with negative controls carried through the whole experimental process including DNA isolation (figure 1A). Highest values were observed in blood with 1.12 (0.58–1.84) pg/µg total DNA, followed by mesenteric AT (0.65 (0.49–1.02) pg/µg and subcutaneous (0.64 (0.25–1.62) pg/µg). Omental AT had only slightly higher values compared with the negative controls (0.24 vs 0.21 pg/µg, p=0.04). A percentage of 88.0 of all blood samples, 78.7% of mesenteric, 69.3% of subcutaneous and 46.7% of omental AT samples had higher amounts of bacterial DNA when compared with the mean quantity of the negative controls (figure 1A). As a positive reference, DNA isolated from stool samples was included, which contained 0.39 (0.20–0.72) µg/µg total DNA bacterial DNA (figure 1B). Using the E. coli genome (4.6 Mbp) as reference, up to 0.7% of the cells were estimated to be of bacterial origin in AT.

Bacterial DNA quantity. (A) Amount of bacterial DNA in pg/µg DNA isolate in all adipose tissues and blood compared with all negative controls and (B) comparing all adipose tissues with stool samples on a logarithmic scale (ng/µg DNA isolate), boxplots with Tukey-Whiskers and mean (◆); p values and FDR-adjusted q values are given; (C) Spearman’s rank correlation plot of bacterial quantity with adipose tissue macrophages (ATM) (Sc and Om), tissue-specific gene expression (mes, SC and Om) and circulating inflammatory markers (all). Nominal significant values are indicated: *: p<0.05, **: p<0.01, ***: p<0.001 and results significant after FDR-adjustment are highlighted and the respective q values stated. ADIPOQ, adiponectin; Bact, bacterial; CEBPA, CCAAT enhancer-binding protein alpha; IGT, impaired glucose tolerance; IL1B and 6, interleukin 1β and 6; LBP, lipopolysaccharide binding protein; LEP, leptin; Mes, mesenteric; NC, negative control; NGT, normal glucose tolerance; Om, omental; PPARG, peroxisome proliferator-activated receptor γ; SC, subcutaneous; T2D, type 2 diabetes; TNF-α, tumour necrosis factor alpha.
CARD-FISH allows the detection of living bacterial cells in AT
Visualisation of living bacterial cells in subcutaneous AT was achieved using catalysed reporter deposition fluorescence in situ hybridisation (CARD-FISH) employing general eubacterial single-strand DNA probes under sterile conditions. We could visualise a median of 13 (IQR: 8–25) EUB positively hybridised bacterial cells per tissue section, each containing about 900 adipocytes. The hybridised bacterial cells were usually observed as singles or pairs (figure 2A,C,E) and rarely in a cluster of more cells (figure 2G). Bacterial cell numbers were highly heterogeneous within the consecutive sections and sections of the same patient. The positively hybridised cells were constantly observed in independent hybridisation events using EUB338I-III, in all hybridised sections of all three patients. Hybridisations with nonsense probe (NON338) and without probe addition showed no false-positive hybridised cells (online supplementary figure 2A, C, E, G), although the presence of microbial cells in the AT could be observed by DAPI staining (online supplementary figure 2B, D, F, H) pertaining to the specificity of the probe in binding bacterial rRNA. Sterility controls did not show any positively hybridised or DAPI-stained cell on their surface.
Supplemental material

Visualisation of living bacteria using CARD-FISH. Representative epifluorescence micrographs obtained by CARD-FISH using HRP-labelled EUB338 I-III probe mixture (in red) and DAPI staining (in blue), showing the presence and distribution of hybridised bacterial cells in subcutaneous adipose tissue cross-sections; (A and B) overview image of subcutaneous adipose tissue cross-section (DAPI-blue) with hybridised cells (Alexa594-red); (C–F) distribution of single bacterial cells within the cross-section adipocyte; (G and H) single cell cluster of hybridised bacteria (red) in adipose tissue (purple). CARD-FISH, catalysed reporter deposition fluorescence in situ hybridisation; HRP, horseradish peroxidase.
Quantity of bacterial DNA correlates with markers of inflammation
In a fat depot-specific manner, bacterial DNA load correlated with markers of inflammation including the expression of TNFA (rho=0.25, p=0.04 in subcutaneous AT) and IL1B (rho=0.34, p=0.007 in mesenteric AT) as well as macrophage infiltration in omental AT (rho=0.46, p=2.0×10⁻⁴; figure 1C). Subgroup analyses revealed that some of the observed correlations were driven by T2D status with strong correlations, for example, between tissue macrophages and bacterial load in omental AT (rho=0.62, p=3.1×10⁻⁴) in subjects with T2D (figure 1C). However, the quantity of bacterial DNA in AT did not correlate with any anthropometric, glucose or lipid metabolism parameters, except for a negative correlation between mesenteric AT and BMI (rho=−0.32, p=0.01). Moreover, the amount of bacterial DNA in AT did not differ between subjects with and without T2D.
Host compartments display significant differences in diversity of harboured bacterial DNA
Observed bacterial richness as well as Shannon distance, were significantly higher in stool compared with blood and AT depots combined (17.9±4.0 vs 4.9±3.2, p=2.8×10-43 and 1.3±0.3 vs 0.6±0.52, p=3.3×10⁻⁷, respectively) (figure 3A). Considering AT depots and blood, mesenteric AT showed the highest alpha diversity in both observed diversity and Shannon distance (5.7±0.3 and 0.82±0.06, respectively), which was significantly higher compared with blood and visceral AT (p<0.001). Subcutaneous AT also had a slightly higher alpha diversity compared with blood and omental AT (p<0.01). Measures of alpha diversity were not different between subjects with and without T2D (online supplementary figure S1).
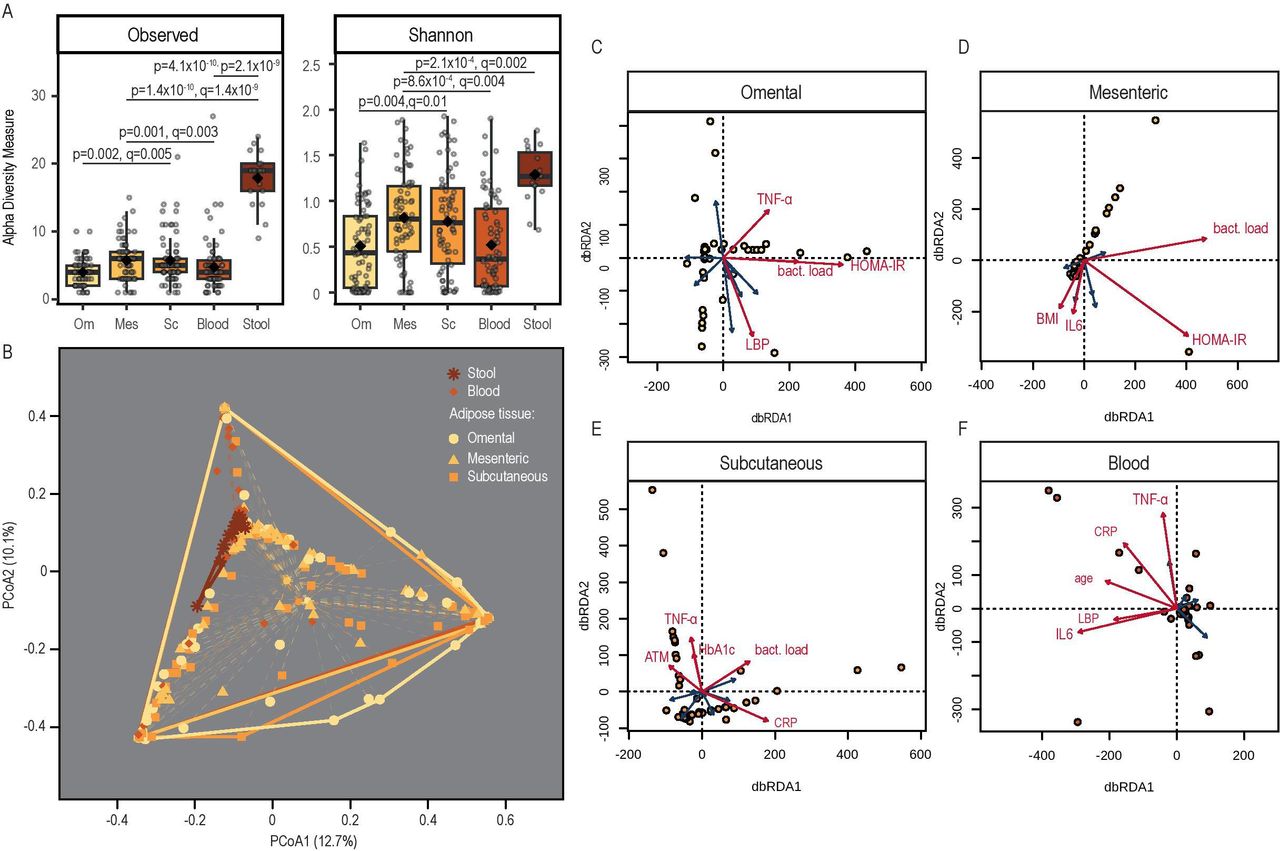
Bacterial diversity. (A) Observed diversity and Shannon index in all adipose tissues, blood and stool after controlling for contaminants based on genus level, (B) PcoA on Bray-Curtis dissimilarity with indication of group variances (betadisper); (C–F) distance-based redundancy analysis (dbRDA) with fitting of explanatory variables; significantly impactful variables after permutation analysis are shown in red; complete explanatory variables included (if applicable): lipopolysaccharide binding protein (LBP), tumour necrosis factor alpha (TNF-α), interleukin (IL)-6, age, body mass index, C reactive protein (CRP), homeostatic model assessment for insulin resistance (HOMA-IR), glycated haemoglobin (Hb) A1c, adipocyte size, adipose tissue macrophages (ATM) and bacterial load. Mes, mesenteric; Om, omental; SC, subcutaneous.
Inflammation and insulin resistance determine the compositional dissimilarity between tissues
Bray-Curtis dissimilarity was used to assess compositional dissimilarity between the tissues of interest. There was no homogeneity of the dispersion among the tissues, that is, variances between the different tissues were significantly different (figure 3B). Distance-based redundancy analysis on Bray-Curtis dissimilarity was used to estimate the impact of collected variables on the ordination and therefore bacterial community composition. In all three ATs, bacterial load, inflammatory markers like tissue macrophages, TNF-α and IL-6 as well as markers of insulin resistance such as HOMA-IR represented parameters significantly shaping community composition (online supplementary table S1, figure 3C–E). In blood, only inflammation markers (circulating TNF-α and IL-6, CRP and LBP) and the age of the subjects accounted for the clustering of the samples (online supplementary table S1, figure 3F).
Proteobacteria and Firmicutes are the predominant phyla in AT
Taxonomy on phylum level was dominated by Proteobacteria and Firmicutes in all AT depots. Other prominent phyla common to all adipose depots included Actinobacteria and Patescibacteria (figure 4A). Chloroflexi and Planctomycetes were mostly observed in blood (average q=0.001 and q=0.01, respectively; figure 3D). Both mesenteric and subcutaneous AT had a large portion of phyla with a mean abundance below 1% which, among others, included Bacteroidetes and Tenericutes. In contrast, omental AT had a smaller fraction of low abundant phyla. Tested tissues displayed specific taxonomic signatures (displayed on genus level in figure 4B–D, online supplementary table S2).

Taxonomy. Relative distribution of phyla (A) and relative distribution of genera belonging to Proteobacteria (B) and Firmicutes (C); (D) circularised plot showing log-transformed mean abundance of all observed genera in bar plots (outermost track) sorted by phyla (labelled on the edge of the plot) for each analysed tissue as indicated on the second track going inwards. The following track shows the cumulative amount of all genera per phylum reflecting the outer bar plots. The innermost circle depicts phyla (transparently coloured area) and genera (coloured lines, selected genera are labelled) with significant differential abundance between tissues; colour indicates increased presence in the tissue of the respective colour, that is, genera Enterobacter (coloured in orange) is significantly more abundant in subcutaneous adipose tissue compared with all other tissues, and Streptococcus is more abundant in both omental and subcutaneous adipose tissue compared with blood. Mes, mesenteric; mesenteric; Om, omental; SC, subcutaneous.
Bacterial composition reflects unique blood and AT signatures on genus level
In general, fewer genera were differentially abundant between the analysed ATs (avg. 5.3), and with 12 differentially abundant genera, most differences were observed between subcutaneous AT and blood. Among those genera, Acinetobacter showed significantly higher (avg. log(2)FC=6.7, q=2.2×10⁻⁸) and Tahibacter significantly lower (avg. log(2)FC=−20.7, q=1.7×10⁻³) abundance in all AT compared with blood. Another genera that was more present in blood compared with both visceral AT depots was Delftia (avg. log(2)FC=−27.7, q=7.5×10⁻²⁰) (figure 3D). Both genera dominantly found in blood were associated with diabetes status, Thahibacter positively (log(2)FC=26.8, q=1.1×10⁻¹⁸), whereas Delftia negatively (log(2)FC=−27.3, q=3.3×10⁻¹⁹) (figure 4A). Among the AT, omental and mesenteric AT were more similar and showed more differentially abundant genera compared with subcutaneous AT. Among them Enterobacter (avg. log(2)FC=28.9, q=1.6×10⁻²²) and Gemella (avg. log(2)FC=25.0, q=3.6×10⁻²²) were significantly increased in subcutaneous AT (figure 4D).
Bacterial composition and its differential abundance in AT is related to metabolic disease
Out of 309 analysed genera, 18 were found to be differentially abundant between subjects with or without T2D. Most differences were observed in blood and mesenteric AT. For three genera, directionally consistent overlaps between tissues were observed: Rhodoferax was less abundant in subjects with diabetes in subcutaneous and mesenteric AT (log(2)FC=−27.0, q=1.2×10⁻¹⁸; log(2)FC=−8.0, q=0.03), Lactococcus in blood and subcutaneous AT (log(2)FC=−30.0, q=8.9×10⁻²³; log(2)FC=−30.0, q=2.3×10⁻²²) and Lactobacillus in blood and omental AT (log(2)FC=−30.0, q=8.9×10⁻²³; log(2)FC=−27.3, q=7.6×10⁻¹⁹)(figure 5A). Corresponding associations with related clinical markers were also observed for those genera (figure 5B). Amounts of Lactococcus correlated negatively with HOMA-IR in blood and BMI in subcutaneous AT. Most correlations were observed in subcutaneous tissue, especially with age, bacterial DNA quantity and HOMA-IR. Least correlations were observed in blood, where genera mostly correlated with circulating IL-6 and the amount of circulating bacterial DNA.

Tissue bacteria and their metabolic links; (A) differential abundant genera between subjects with and without diabetes for all at and blood; (B) correlation analysis between presence and amount of genera with inflammatory, anthropometric and metabolic parameters. ADIP, adipocyte; ATM, adipose tissue macrophages; Bact, bacterial; BMI, body mass index; CRP, C reactive protein; HbA1c, glycated haemoglobin A1c; HOMA-IR, homeostatic model assessment for insulin resistance; IL6, interleukin 6; LBP, lipopolysaccharide binding protein; TNF-α: tumour necrosis factor alpha.
Bacterial DNA induces inflammatory response in adipocytes
Minuscule amounts of bacterial DNA, equivalent to approximately one bacterial cell per 100 adipocytes or 0.014 ng per well in a six-well plate reflecting initial quantification results, were sufficient to induce an increased expression of adipocytokines IL6 and TNFA in immortalised subcutaneous adipocytes of an apparently healthy, lean subject after 4 hours incubation time (IL6 FC0.014ng=1.36±0.08; TNFA FC0.014ng=1.41±0.1, both p<0.001; figure 6A). The response was dose dependent and strongest after 4 hours of incubation (IL6 FC1.4ng=16.4±0.6; TNFA FC1.4ng=19.4±1.3, both p<1×10⁻⁷) with reduced effects after 24 hours and barely any changes after 72 hours of incubation (figure 6A). This response was reproducible, and further increasing the concentration likewise increased the expression of both genes (IL6 FC14ng=105.8±6.3; TNFA FC14ng=124.4±11.1, both p<1×10⁻⁷, figure 6B). Furthermore, an increased expression of IL1B and NFKB was observed (IL1B FC14ng=6.7±0.4; NFKB FC14ng=5.6±0.3, both p<1×10⁻⁷, figure 6B). Contrary, treatment with bacterial DNA did not alter the expression of TLR9, IRAK4, MyD88, CASP1 and CASP8 at any time point or concentration (data not shown). In addition, expression of various adipokines was tested, and high concentrations of bacterial DNA slightly impaired the expression of PPARG (FC14ng=0.64±0.1, p=5.4×10⁻⁴), chemerin (FC14ng=0.76±0.07, p=8.7×10⁻⁴), adiponectin (FC14ng=0.88±0.06, p=0.006) and leptin (FC14ng=0.72±0.06, p=7.7×10⁻⁵).

Treatment of adipocytes with bacterial DNA in vitro. Immortalised subcutaneous adipocytes were treated with increasing amounts of bacterial DNA (Escherichia coli), incubated for 4, 24 and 72 hours, and gene expression was measured (A), and the experiment was repeated with a further increased dilution with 4 hours of incubation (B); all experiments were run in repeated triplicates (n=6); values are given as mean fold change compared with untreated controls which were seperately generated for each time point, and error bars depict SD, and asterisks indicate significant changes compared with negative controls after Benjamini-Hochberg adjustment (one sample t-test). IL1B, interleukin 1 beta; IL6, interleukin 6; NFkB, nuclear factor kappa-light-chain-enhancer of activated B cells; TNFA, tumour necrosis factor alpha.
Discussion
There is emerging yet controversial evidence for the presence of bacteria in the circulation and AT.10 15 16 20 44 45 In the present study, under stringent experimental conditions focusing on sterile handling and bioinformatic control for contaminants, we detected bacterial DNA, which was correlated with macrophage infiltration in various human fat depots. Moreover, we evidenced tissue-specific quantitative, taxonomic as well as compositional bacterial signatures driven by and significantly associated with inflammatory markers and metabolic traits in a tissue-dependent manner.
Despite the appealing evidence for the presence of bacteria in AT in animal studies,10 validation in human AT remains challenging. Burcelin et al 44 presented first exploratory data when they proposed the ‘tissue microbiota’ hypothesis. Until of late, these data lacked robust support with most publications failing to account for contamination; in 2016, Zulian et al failed to amplify bacterial DNA from human AT and declared the subject an open issue.45 More recently, Anhê et al 46 reported the presence of bacterial DNA in several AT depots, liver and plasma and pointed to a tissue-specific compartmentalisation of bacterial fragments and a T2D bacterial signature in mesenteric AT. Taking into account the inconsistencies in previous studies, one would expect that bacterial DNA in AT would be of very low abundance, making its experimental validation highly challenging. Predominantly present human DNA is one of the major factors hindering a successful amplification of the bacterial 16S rRNA gene. Reagents, handling and cross-contamination can introduce further noise, largely affecting the outcome of experimental procedures. Thus, experimental optimisation and controlling for contaminants represent two major issues to be addressed in studies aimed at bacterial detection in human tissues.47 Here, we used high-fidelity Q5 proof reading polymerase and a primer pair for the V4/5 16S region, which did not tend to amplify human 18S or other related genes in the abundance of genomic human DNA. The selection of the adequate polymerase and primer pairs seems crucial, as most of the tested primer pairs and polymerases did not amplify bacterial DNA (online supplementary table S3, S4). To reduce contamination, all steps were performed under a laminar flow hood in a pre-PCR room, and it appeared essential to have all utensils UV treated for at least 90 min.47 In addition, negative controls (with UV treated PBS) were carried through the whole protocol for each run including sequencing. We also accounted for potential contamination by employing a bioinformatical statistical approach largely based on the carried through negative controls.40 After rigorous experimental and bioinformatic control for high-risk contamination in our low bacterial biomass samples, our results are in line with recent findings,46 thereby providing further evidence for the presence of low amounts of bacterial DNA in AT of subjects with obesity and T2D. Beyond this, we provide first evidence for the presence of living bacteria in subcutaneous AT using CARD-FISH, which could not be similarly shown in negative controls run alongside AT sections. The quantity of bacterial cells per adipocyte, being around 1.4 %, reflects the quantity of bacterial DNA per whole isolated DNA from AT further delineating that the bacterial quantity we report is indeed, at least in part, eminent from living bacteria. More importantly, the observed bacterial cells are enclosed within adipocytes and usually evidenced at adipocyte–adipocyte border, underscoring their tissue-borne origin. These results corroborate previous findings from experiments using mice treated with orally administered, labelled E. coli by Denou et al, who reported the translocation and presence of these living bacteria to visceral AT as well as the AT stroma vascular fraction.48
Admittedly, we can only speculate about the origin of the detected bacterial DNA. Measurements of intestinal permeability such as lactulose/mannitol test, which could indicate the translocation of bacteria from gut into AT, were not available for our study cohort. Moreover, we have recently shown that the commonly used biomarker for intestinal permeability, zonulin (prehaptoglobin 2), was not an adequate option, since commercially available ELISA kits do not detect prehaptoglobin 2, but rather unspecifically measure other proteins potentially related to the ‘zonulin family’49 with unclear role in gut leakiness and bacterial translocation.
One of our most compelling findings was that mesenteric AT harboured the highest bacterial quantity and diversity among tested ATs. Mesenteric AT could be a ‘gate keeper’ between the gut and systemic exposure to bacteria, clearing bacterial components before they reach other tissues. In support of our data, experiments in mouse models show that bacterial DNA can be robustly tracked along the intestine into AT in mice with diet-induced obesity.10 This has also been corroborated in human studies where hyperglycaemic has been shown to be associated with intestinal barrier impairment50 and the influx of bacterial components such as LPS51 and bacterial DNA in the circulation.10 A contradictory finding was that blood had the highest amount of bacterial DNA underlining the relevance of other sources of bacterial DNA in the blood, such as oral cavity52 53 and skin.54
The most commonly observed phyla in tissues tested in the present study were Firmicutes and Proteobacteria, followed by Actinobacteria. This is in line with data by Burcelin et al and Anhê et al, who reported bacterial DNA in the stromal vascular fraction of human AT44 or whole AT samples.46 Similar bacterial composition have been shown for the blood microbiome55 56 where a bacterial signature has been associated with pathologies in obesity such as liver fibrosis55 but also with systemic inflammation in subjects with liver cirrhosis.57
Consistent with the ‘leaky gut’ hypothesis and low-grade inflammation of AT caused by bacterial translocation, both quantity and distribution of bacteria were closely linked to the patients’ systemic inflammation as well as the tissue-specific inflammation in our study. Admittedly, the term ‘leaky gut’ is poorly defined and has been equated with either increased intestinal permeability, increased circulation of bacterial products or increased reactive host markers. To this extent, the evidence we propose of bacteria in AT and increased inflammatory response after bacterial DNA challenge constitute the most direct evidence for the concept of increased bacterial translocation in metabolic disease as well as local host–microbe interaction and extend the explanatory power of increased endotoxaemia and intestinal permeability following overnutrition.58 Our data are, in this aspect, in line with the published literature devoted to the leaky gut hypothesis and low-grade systemic and tissue inflammation in AT. For instance, the potential role of bacterial components was demonstrated by stimulation of AT macrophages and adipocytes with LPS, which led to an increased inflammation via TLR2 and 4 and a higher expression of TNF-α and IL-6.59 60 Consequently, bacterial signature in AT was linked to metabolic changes as well as inflammation, whereas blood bacterial composition was mostly related to inflammation without association to circulatory metabolic parameters. Beyond the associative link between presence of bacterial DNA and AT inflammation, we show that in vitro treatment of adipocytes with bacterial DNA increased inflammatory cytokines expression proportional to the amount of bacterial DNA, further supporting that bacterially caused local inflammation is a putative underlying pathway for the link between increased intestinal permeability, AT inflammation and subsequent systemic inflammation in obesity and insulin resistance. Understanding of specific bacterial contribution to local and systemic metabolic status could lead to novel treatments based on tissue-specific delivery of protective bacterial component as has been done systemically with pasteurised bacteria (eg, Akkermansia muciniphila) leading to reduced obesity and metabolic improvement.61 62
There are several strengths and weaknesses of the study, which have to be acknowledged. To the best of our knowledge, this is the first contamination-aware study to provide evidence for the presence of bacterial DNA and living bacteria in human AT and to suggest its link to the metabolic and inflammatory status of obese patients. The relatively large sample size with 75 metabolically well-characterised subjects and three AT depots did allow for generating robust and reproducible data on bacterial DNA and testing for correlations between the bacterial load, AT immune cell infiltration and clinical phenotypes. It may also be desirable in the future to include lean subjects with a healthy metabolic phenotype to be compared with patients with obesity. It also has to be acknowledged that comparative analyses between subjects with and without diabetes were limited by the fact that subjects with diabetes were significantly older. Finally, the presented correlations with R2 <0.2 should be seen with caution, since despite their statistical significance, the biological relevance of such relationships might be questionable and requires further replications.
In conclusion, our study provides evidence for the presence and depot-specific differences in the amount and composition of bacterial DNA in AT of obese patients and suggests an important role of bacteria in molecular signatures of various AT depots potentially contributing to metabolic sequelae of obesity.
Acknowledgments
We would like to thank all those who participated in the studies, in particular our study subjects. The authors want to thank Ingo Bechmann for helpful advice and discussions, and Stefanie Ziesche, Eileen Bösenberg and Judith Kammer for their continuous excellent technical support. We acknowledge the Centre for Chemical Microscopy (ProVIS) at the Helmholtz Centre for Environmental Research for using their sample preparation and microscopy facilities. Special thanks to Katja Nerlich for support during in situ hybridisation and fluorescence microscopy image acquisition.
Footnotes
LM and RC contributed equally.
Contributors LM, RC, AC, HH and PK designed the study; LM, RC, AC, MS and PK wrote and edited the manuscript. LM, RC and AC performed all experiments; LM and RC analysed the data; ST and MG performed immunohistochemistry; NM planned and supervised catalysed reporter deposition fluorescence in situ hybridisation (CARD-FISH) protocol, and ST executed CARD-FISH protocol and subsequent analysis; KDD performed real time expression experiments; JF, MvB, S-BH and HH provided bioinformatical expertise, and HH collected patient data; AD and MB were responsible for sample collection.
Funding This work was supported by grants from the Deutsche Forschungsgemeinschaft (DFG, German Research Foundation – Projektnummer 209933838 – SFB 1052; B01, B03 and B09) and from IFB AdiposityDiseases (AD2-060E, AD2-06E95 and AD2-K7-117). IFB Adiposity Diseases is supported by the Federal Ministry of Education and Research (BMBF), Germany, FKZ: 01EO1501. ProVIS is supported by European Regional Development Funds (EFRE – Europe funds Saxony).
Competing interests None declared.
Patient and public involvement Patients and/or the public were not involved in the design, or conduct, or reporting, or dissemination plans of this research.
Patient consent for publication Not required.
Provenance and peer review Not commissioned; externally peer reviewed.
Data availability statement Data are available on reasonable request. All data relevant to the study are included in the article or uploaded as supplementary information.