Article Text

Abstract
Objective The ethiopathogenesis of irritable bowel syndrome (IBS) is unknown. While a link to the gut microbiome is postulated, the heterogeneity of the healthy gut makes it difficult to draw definitive conclusions. We aimed to describe the faecal and mucosa-associated microbiome (MAM) and health correlates on a community cohort of healthy and IBS individuals with no colonoscopic findings.
Design The PopCol study recruited a random sample of 3556 adults; 745 underwent colonoscopy. IBS was defined by Rome IV criteria and organic disease excluded. 16S rRNA gene sequencing was conducted on sigmoid biopsy samples from 376 representative individuals (63 IBS cases) and faecal samples from 185 individuals (32 IBS cases).
Results While sigmoid MAM was dominated by Lachnospiraceae, faeces presented a higher relative abundance of Ruminococcaceae. Microbial richness in MAM was linearly correlated to that in faeces from the same individual (R²=0.255, p<3E-11) as was diversity (R²=0.06, p=0.0022). MAM diversity decreased with increasing body mass index (BMI; Pearson’s r=−0.1, p=0.08) and poorer self-rated health (r=−0.15, p=0.007), but no other health correlates. Faecal microbiome diversity was correlated to stool consistency (r=−0.16, p=0.043). Several taxonomic groups were correlated to age, BMI, depression and self-reported health, including Coprococcus catus associated with lower levels of depression (r=−0.003, p=0.00017). The degree of heterogeneity observed between IBS patients is higher than that observed between healthy individuals.
Conclusions No distinct microbial signature was observed in IBS. Individuals presenting with low self-rated health or high BMI have lower gut microbiome richness.
- irritable bowel syndrome
- colonic microflora
- colonic bacteria
- colonoscopy
- environmental health
This is an open access article distributed in accordance with the Creative Commons Attribution Non Commercial (CC BY-NC 4.0) license, which permits others to distribute, remix, adapt, build upon this work non-commercially, and license their derivative works on different terms, provided the original work is properly cited, appropriate credit is given, any changes made indicated, and the use is non-commercial. See: http://creativecommons.org/licenses/by-nc/4.0/.
Statistics from Altmetric.com
Significance of this study
What is already known on this subject?
Irritable bowel syndrome (IBS) is a functional bowel disorder of unknown aetiology affecting up to 15% of the population.
There may be a link between the gut microbiome and IBS symptoms, since a subset of patients seems to respond to antibiotics.
Several studies have described gut microbiome composition in IBS, but found different taxa to be over-represented or under-represented.
Pathologies might confound microbiome results in IBS studies, however population-studies where pathology has been excluded by colonoscopy have not been conducted yet.
What are the new findings?
In a population sample, IBS was not associated with an altered microbiome either in stool nor mucosa.
The degree of heterogeneity observed between IBS patients is higher than that observed between healthy individuals.
A significant correlation was observed between microbiome diversity and self-rated health for both stool and sigmoid biopsies.
How might it impact on clinical practice in the foreseeable future?
Although commercial testing of stool microbiome is available, such testing in IBS is unlikely to help guide current therapeutic interventions as IBS did not have a clear microbial signature.
Introduction
The pivotal role played by the human microbiome in health and disease is being increasingly recognised.1 2 At the same time, there is a growing understanding of the heterogeneity of the healthy human microbiome, which has led to population-based cohorts of faecal microbiome communities, such as the Flemish Gut Flora and Dutch LifeLines-Deep studies.3 Without an adequate understanding of which demographic parameters influence the gut microbiome, it is difficult to plan adequate studies into its role in disease.
A major area of clinical interest is the role of the microbiome in functional gastrointestinal disorders, including the irritable bowel syndrome (IBS).4 IBS is estimated to affect 15% of the population, but its aetiopathogenesis remains unclear.5 In addition to dietary, behavioural and lifestyle risk factors, mounting evidence suggests a role for the gut microbiome. Among the indirect evidence for this is IBS induction6 or amelioration7 in response to antibiotics. Several studies have attempted to identify IBS-specific alterations of the gut microbiome (reviewed in4 ,8). There is, however, still no clearly delineated IBS gut microbiome profile.
Most large-scale studies of the human gut microbiome have focused on faecal samples. However, the bulk luminal microbial community only partially reflects the mucosa-associated microbiome (MAM).9 While numerically smaller, the mucosal community’s close association to the host epithelium and its immune system may be more important in protecting the host or promoting disease.9 The logistic difficulties in attaining a broad cohort of human gut mucosal samples has meant that its role in health has been relatively neglected, with published studies settling for low numbers (9–29 individuals).10–13
Here, we take advantage of the PopCol cohort to analyse the faecal and MAM of a representative sample of an adult urban population. This study recruited a random sample of 3556 adults living in Stockholm, of which 745 agreed to a colonoscopy.14 During colonoscopy, biopsies of the large bowel were collected. Faecal samples were collected in a subset of participants.
In addition to these samples, volunteers filled extensive questionnaires on their health, lifestyle and bowel habits to define phenotypes. The colonoscopy provided information on disease state, including the presence of polyps, diverticula, and inflammation, as described in previous studies.15–17 However, except for a smaller cohort of faecal samples with a focus on abdominal pain,18, the microbiome of these patients has not been studied.
In the present study, we aimed to compare the sigmoid MAM and faecal microbiome of a representative population-sample. We hypothesised that while the microbial composition of faeces differs from the MAM in an individual, factors specific to each individual would also be observable. Furthermore, we hypothesised that IBS would be characterised by an altered MAM. To our knowledge, this is the first study to investigate the mucosa-associated gut microbiome of an adult population-based cohort.
Methods
Participants
The present study is part of PopCol, a population-based colonoscopy study previously described in detail.14 A random sample of 3556 adults living in Stockholm, Sweden, were sent a validated Abdominal Symptom Questionnaire (ASQ).19 All responders (n=2293) were contacted by phone with an invitation to a hospital visit, including medical history taken by a gastroenterologist, blood sampling and completion of further questionnaires. All participants partaking in the hospital visit (n=1244), except for those fulfilling exclusion criteria for colonoscopy (see15), were invited to undergo a colonoscopy with biopsies. A total of 745 participants accepted (mean age=51.7 years (range 18–70); 57.2% women). Individuals participating in colonoscopy reported in general more symptoms, although one third were still symptom free.14 A subset of participants (n=741; all participants recruited in the latter half of the study) were also asked to collect a faecal sample at home and send it by post to the study centre (all but four complied). The colonoscopy procedure has been previously described.14 In this study, the sigmoid biopsies and the faecal samples were analysed in the volunteers without any observed colonic pathology at colonoscopy or on histopathological examination of the biopsy.
Variables
Irritable bowel syndrome
At the time of sampling, volunteers filled in the ASQ19, which contains all questions later included in Rome IV. IBS was therefore defined in accordance with the Rome IV definition as recurrent abdominal pain, at least 1 day/week in the last 3 months, associated with two or more of the following criteria: (1) related to defecation (relieved or induced by defecation), (2) associated with a change in frequency of stool and (3) associated with a change in form (appearance) of stool using the ASQ.19 In total, 152 IBS cases were identified.
Four questions were used to define the IBS types:
Do you have looser stools when you have abdominal pain or discomfort?
Do you use the toilet more often when you have abdominal pain or discomfort?
Do you have harder stools when you have abdominal pain or discomfort?
Do you use the toilet less often when you have abdominal pain or discomfort?
Volunteers answering ‘yes’ to questions 1 or 2 but neither to 3 nor 4 were classified as IBS-D. Conversely, those answering ‘yes’ to questions 3 or 4 but neither to 1 nor 2 were classified as IBS-C. Those who answered ‘yes’ to either one of 1 or 2 as well as either one of 3 or 4 were classified as IBS-M. The remaining were labelled IBS-U (unclassified).
IBS symptom burden was assessed using the Gastrointestinal Symptom Rating Scale (GSRS).20
Proxy for stool consistency
Stool form correlates with colonic transit time.21 Questions on stool pattern were used to estimate a score, based on the following questions from the ASQ:
Have you had any of the following symptoms at least one-fourth of the time (occasions or days) in the last 3 months (check all that apply):
Fewer than three bowel movements a week.
More than three bowel movements a day.
Hard or lumpy stools.
Loose, mushy or watery stools.
Did you have loose, mushy or watery stools, during more than three quarters (3/4) of your bowel movements?
Questions associated with a faster transit time (a2, a4, b) were given a score of +1 for each question. Questions associated with a slower transit time (a1, a3) were given a score of −1 for each question. In this way, each participant’s estimated stool consistency could be placed on a scale from −2 to +3.
Body mass index
Body mass index (BMI) was calculated from height and weight measurements taken at the first hospital visit.
Use of antibiotics and probiotics
Participants were asked at the hospital visit whether they had taken any antibiotics or probiotics during the last 3 months.
Tobacco usage
Smoking and use of Scandinavian snus were reported at the hospital visit. Number of cigarettes smoked per day were categorised into four categories: 0=none, 1=<10, 2=10–19 and 3>=20 cigarettes per day. Snus was categorised as current user (at least one dose/week) or non-user. Smoking and snus were combined into four categories such that one unit was added to the tobacco score if the volunteer used snus on a weekly basis.
Depression and anxiety
Psychological distress was assessed using the validated Hospital Anxiety and Depression (HAD) scale,22 a widely used self-assessment scale.
Self-rated health
Self-rated health was assessed using the question: “How would you rate your general state of health” rated on a 5-point scale from ‘1=Excellent’ to ‘5=Poor’.
Microbiome analysis
Sample collection and selection
Bowel preparation and ileocolonoscopy were performed as previously described.14 During ileocolonoscopy, a biopsy from the sigmoid was taken by pinch biopsy and immediately preserved in freezer medium at −80°C. Faecal samples were collected by the participants at home, up to 3 months before ileocolonoscopy, posted to the hospital and frozen at −80°C on arrival. Seven hundred and forty-five ileocolonoscopies were performed, and 284 faecal samples delivered, of which 423 and 186, respectively, had DNA extracted and amplified as described below.
Library preparation and sequencing
Biopsy samples were thawed, spun-down and had DNA extracted for 16S rRNA gene sequencing as previously described.22 About 170 ng of DNA, or 25 µL of DNA solution in case an appropriate concentration could not be reached, were submitted to a 30 cycle 1-step PCR amplification.22 Samples were spread randomly across 9 DNA extraction runs and four sequencing runs, yielding 12 004–241 925 high-quality 16S read-pairs per approved sample (median 28 335). There were small but significant effects of DNA extraction batch (Analysis of Similarity ANOSIM r=0.044, p=0.004) and of sequencing run (r=0.059, p=0.004) on Jensen-Shannon beta-diversity.
Faecal samples were thawed, spun-down and had DNA extracted as previously described.22 About 50 ng of DNA were submitted to a 25 cycle 1-step PCR amplification. Samples were spread randomly across 6 DNA extraction runs and four sequencing runs, yielding 12 565–57 537 high-quality 16S read-pairs per approved sample (median 32 964). No batch effects were observed.
At each extraction run, a mock sample (ZymoBIOMICS Microbial Community Standard, Zymo Research, Irvine, California, USA) was included as a positive control and an extraction blank was performed as negative control. Likewise, during PCR a DNA mock sample (ZymoBIOMICS Microbial Community DNA Standard, Zymo Research) was included as the positive control and a PCR as negative. All four controls were sequenced together with its respective plate and any run where one or more of the controls did not perform as expected was performed again. All sequencing was conducted on an Illumina MiSeq with 2×300 bp reads.
Bioinformatics processing
Cutadapt v1.1423 was used to trim 3′ bases with Phred score lower than 15 and 5′ primer sequences. Reads that did not contain both primer sequences, that had less than 120 bp left after trimming or that contained more than 3 n calls were discarded. Reads were merged and dereplicated with Usearch v10.0.240.24 Singleton sequences and non-merging reads were discarded. ASV (amplified sequence variants) were picked with the unoise3 denoising algorithm. All merged reads from each sample were mapped back to the centroids at a minimal identity of 98% for quantification. A total of 4297 ASV were produced from the combined faecal and biopsy dataset. Function isContaminant from the Decontam package25 was used to assess for the presence of taxa overly abundant in the negative controls. Fisher’s method was used to combine across extraction plates. Four ASV were flagged as contaminants and removed from the analysis. Taxonomy was assigned to centroids by mapping them to a curated taxonomy of the SILVA v132 database26 as implemented in the DADA2 package (v1.6.0) with functions assignTaxonomy and addSpecies. 27 The final ASV table is available as online supplementary table 1. Samples were kept if they reached 12 000 approved reads. This excluded one faecal sample and 50 MAM samples, leaving a total of 185 faecal samples and 376 MAM samples. ASV were kept if their total counts reached at least 5% of the total number of samples, that is, 29 counts or higher. In total, 2793 ASV were kept.
Supplemental material
Statistics
Each sample was normalised to one before all analyses except richness. In the case of richness and diversity, subsampling to 12 000 reads was performed. Chao1 was used for estimating sample richness and Shannon’s entropy for alpha-diversity. All computations were performed in R v3.3.2 using the packages Vegan v.2.4–3,28 Pheatmap v.1.0.829 and Vioplot v. 0.2.30
Linear models were calculated between Shannon’s entropy and Chao1 richness for each dataset against the following variables: age (years), BMI, self-assessed health, anxiety HAD score, depression HAD score, stool consistency and GSRS score, both by stepwise forward and reverse regressions. Linear models were also used to assess the relationship between richness and diversity in paired samples from the same individual.
Correlation between taxa across paired samples was analysed with Pearson’s and Spearman’s rank correlation and corrected for multiple testing with the Benjamini-Hochberg procedure separately at each taxonomic level. Only clades with an observed abundance larger than 0 in at least 10 faecal samples and 10 biopsies were analysed.
Multivariate Association with Linear Models (Maaslin31) was run separately for faecal and biopsy samples, with Benjamini-Hochberg correction and only analysing clades with abundance and prevalence >1%. The metadata included was sex, age, BMI, self-rated health, anxiety HAD score, depression HAD score, GSRS sum and IBS type.
For variation partitioning, these data were used in addition to the technical parameters month of ileocolonoscopy and DNA extraction plate. Month was included as a proxy of sample temperature during sample transport. Mantel’s test was performed with Pearson’s correlation and 999 permutations.
Beta-diversity was calculated on Bray-Curtis distance except on cluster analyses, where Jensen-Shannon was used. Heatmap rows and columns are clustered by ward-linkage. Presence of discrete clusters was assessed both at the genus- and at the ASV-level, but only the former results are shown. Scatter plots are based on non-metric multidimensional scaling (NMDS).
Results
Sample selection
The PopCol cohort is highly comparable to the background population.14 However, since a subset of individuals and samples were excluded in this study (figure 1), the representativeness of this subcohort was assessed. Sigmoid biopsy samples from 376 individuals and faecal samples from 185 individuals were kept (overlap of 178). This is summarised in table 1. The exclusion of individuals with diverticulosis leads to a somewhat younger cohort (all: mean age 51.7 years; included faecal: mean 50.4, p=0.07; included MAM: mean 49.1, p<10E-10). As a consequence, the cohort is also less overweight (all: mean BMI 24.9 kg/m2; included faecal: mean 24.0, p=0.0015; included MAM: mean 24.4, p=0.0005). There was a significant correlation between age and BMI in our population (r=0.22, p=2E-9).
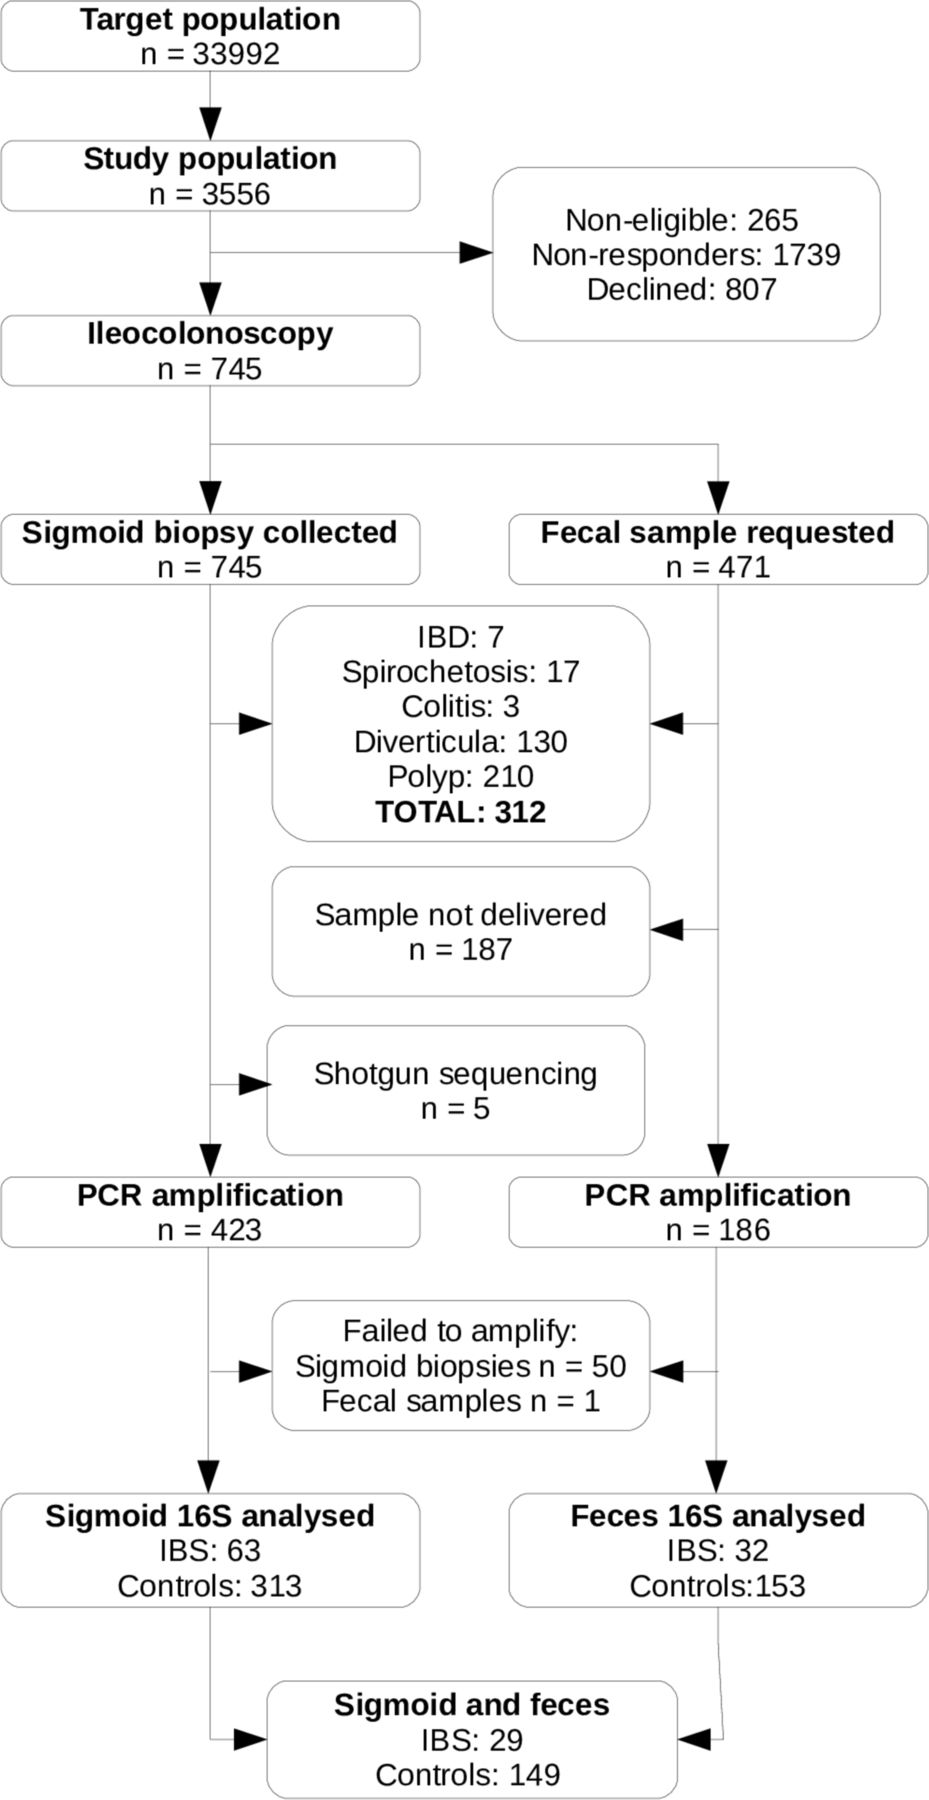
Flow diagram of participants and samples included in this study. IBD, inflammatory bowel disease; IBS, irritable bowel syndrome.
Comparison of crucial clinical and demographic parameters between included and excluded samples
The prevalence of IBS subtypes was similar in the included individuals and in those excluded due to the presence of polyps, diverticula or spirochaetosis. Individuals with inflammatory bowel disease (IBD, n=6) and/or microscopic colitis (n=3) were more likely to present with IBS-D like symptoms (table 2).
Co-occurrence of IBS and other diseases, and prevalence of IBS in the population study and the samples analysed
Within-sample (alpha) diversity
The effect of seven quantitative factors on microbiome richness and diversity of non-diseased subjects was assessed: age, BMI, self-rated health, anxiety (HAD score), depression (HAD score), severity of symptoms (GSRS score) and a proxy measure of stool consistency. Online supplementary table S2 presents the correlation strength and uncorrected significance for richness, evenness and diversity for each of the parameters assessed. MAM diversity was negatively correlated to self-rated health (r=−0.15, p=0.007). Faecal microbiome diversity was correlated to consistency (r=−0.16, p=0.04). Looser stools were associated to lower richness, but this trend was not significant (stool: r=−0.11, p=0.18; MAM: r=−0.94, p=0.097).
Since no strong effects were found on the richness and diversity of the gut microbiome among healthy individuals, the comparison between these and IBS individuals was done on the full cohort. No significant differences were found between the richness or diversity of either faeces or MAM between healthy controls and IBS cases or in IBS subtypes.
About 24 faecal sample donors and 41 biopsy donors had used antibiotics on the 3 months prior to the study, comprising at least 15 different antibiotic classes. Of these individuals, 12 had also taken probiotics in the same time period. Individuals exposed to antibiotics did not display reduced richness or diversity in their MAM or stool microbiome at the time of sampling, considering either IBS-free or all individuals. No difference was observed concerning probiotic usage. Likewise, tobacco usage had no significant effect on richness and diversity, treating it either as a Boolean or a quantitative variable.
Taxonomic composition
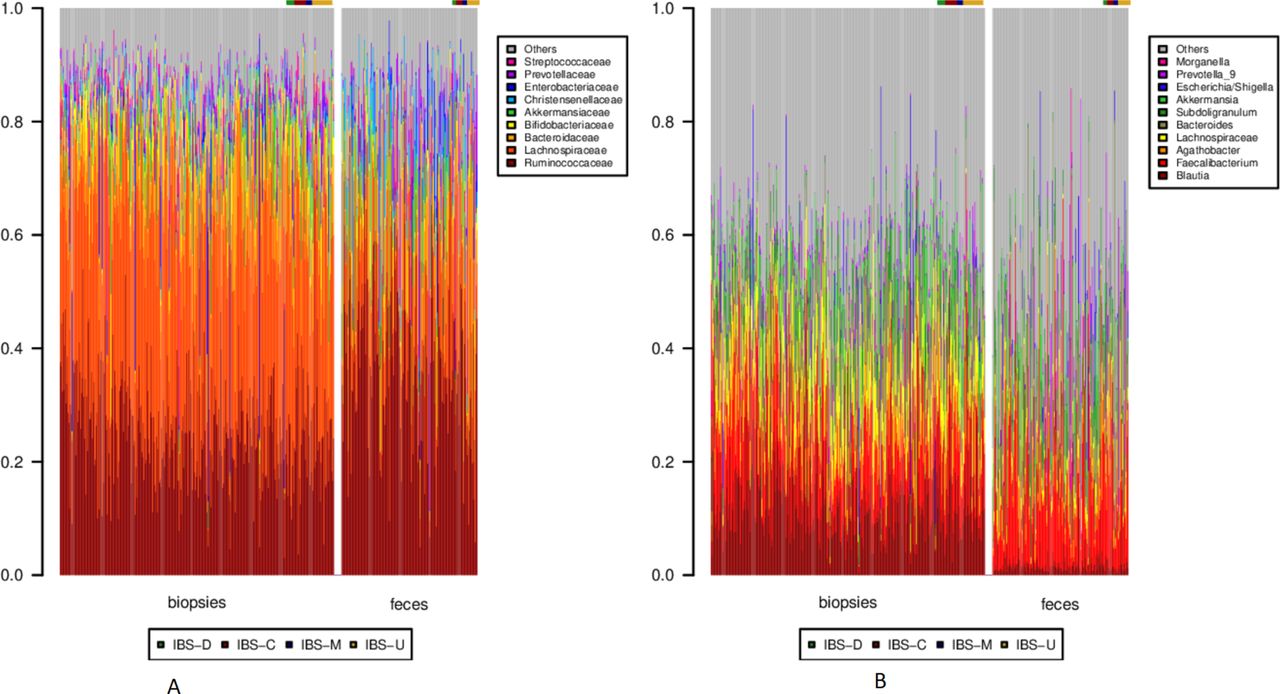
Both faecal samples and biopsies were dominated by Clostridiales, followed by Bacteroidales. Differences between faeces and MAM became more notable at the family and genus levels. While MAM was dominated by Lachnospiraceae, faeces presented a higher relative abundance of Ruminococcaceae (figure 2A). At the genus level, Blautia and other, unclassified, Lachnospiraceae were conspicuous in MAM, while faecal samples presented a higher proportion of Faecalibacterium (figure 2B).

Taxonomy barplots for each sample at the (A) family and (B) genus level. In each panel, biopsies are to the left, and faecal samples to the right. Within each sample type, healthy individuals are depicted first, followed by the IBS cases, as noted by the colour bar above each barplot. Only clades corresponding to on average >10% over all samples or >30% of a single sample are depicted. IBS, irritable bowel syndrome.
To mine biomarkers, we ran Multivariate Association with Linear Models (Maaslin). The parameters considered were the same quantitative factors as in the alpha-diversity analysis, as well as IBS subtype. On the faecal dataset, the only significant association was a negative correlation between Lachnospira pectinoschiza and BMI (L. pectinoschiza ~0.0032×BMI; p<3E-10). For the biopsy dataset, four clades were found to covary with different demographic parameters (table 3). No associations were found with diagnosis of IBS, IBS type or GSRS score.
Association between bacterial clades in the MAM and patient data
Between-sample (beta) diversity and cluster analysis
The vast majority of the inter-sample variation in the datasets cannot be explained by any of the demographic, technical or clinical parameters assessed (90.2% for biopsies; 96.5% for faecal samples; online supplementary figure S1). Indeed, the largest fraction of the variability is explained by technical artefacts alone (5% of total).
Supplemental material
Nevertheless, IBS might have an effect on MAM, as evidenced by an ANOSIM analysis of beta-diversity (figure 3). Individuals without IBS are more similar to each other, and those with IBS are less (MAM: r=0.131, p=0.003; faeces: r=0.078, p=0.089). When splitting by IBS type, this observation still holds for IBS-U and IBS-M (online supplementary figure 2a,b; MAM: r=0.155, p=0.001; r=0.091, p=0.09).
Supplemental material

Comparison of the Bray-Curtis beta-diversity dispersion between IBS and healthy individuals (A) MAM (B) faeces. IBS, irritable bowel syndrome; MAM, mucosa-associated microbiome.
BMI also has an effect on MAM composition, with underweight (BMI <18.5) and obese (BMI >30) individuals presenting a greater spread in their sample composition than individuals with normal weight (online supplementary figure S2c; r= 0.093, p=0.002). Self-rated health was also associated with beta-diversity spread, with increasing spread in the MAM of individuals with lower self-rated health (online supplementary figure S2d; r= 0.042, p=0.016). No significant effect was found for faecal samples.
Generally, the observed microbiome profiles did not segregate on the basis of IBS type or total GSRS sum (figure 4; online supplementary figure S3).
Supplemental material

NMDS highlighting IBS diagnosis (red: IBS-D; blue: IBS-C; orange: IBS-M; purple: IBS-U) and total GSRS score (circle size). (A) MAM (B) inset of (A), highlighting the most densely populated area of the NMDS. (C) Faecal samples. (D) Inset of (C), highlighting the most densely populated area of the NMDS. IBS, irritable bowel syndrome; MAM, mucosa-associated microbiome.
Comparison of stool and sigmoid MAM
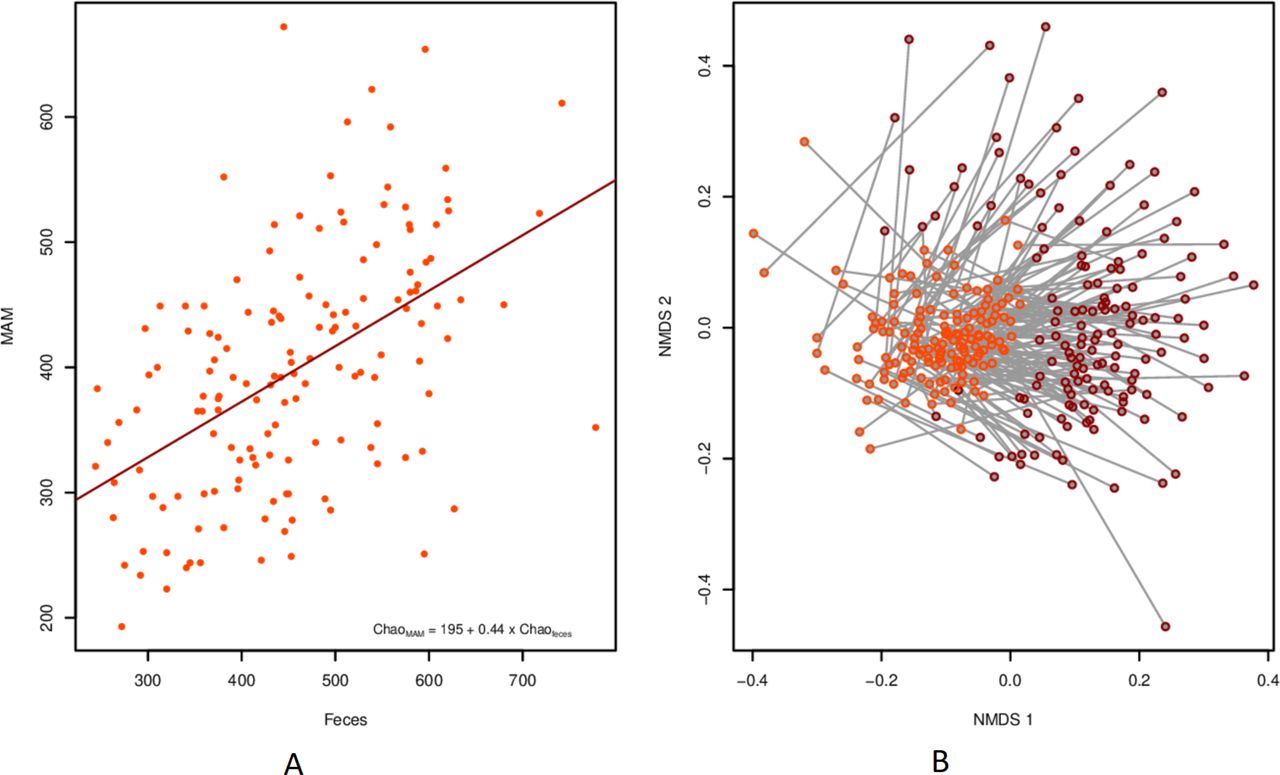
To directly contrast the microbiome in stool and sigmoid MAM, a pairwise analysis was done on the subset of individuals for which both sample types were present (n=29 IBS, 149 controls). The microbial richness in MAM was linearly correlated to that in faeces from the same individual (R²=0.255, p<3E-11; figure 5A). This was also true for diversity, but to a lesser extent (R²=0.06, p=0.0022). Bray-Curtis divergence was smaller between faecal and biopsy samples taken from the same individual than between MAM and faecal samples taken from different individuals (mean values: 0.641 vs 0.791; p<2.2E-16; Mantel’s test r=286, p=0.001; online supplementary figure 4). Importantly, the difference in sample type dominated over the individual signature (figure 5B).
Supplemental material
Relationship between faeces and MAM from the same individual. (A) Scatterplot of Chao1 richness for each sample type per individual, including linear trend line. (B) NMDS with a line connecting each pair of samples. biopsies are highlighted in orange and faecal samples in red. MAM, mucosa-associated microbiome.
We also assessed how each taxon correlates between these paired samples. For each taxonomic level from phylum to genus, the correlation between taxa was calculated, showing that 57 out of 242 (24%) clades analysed have a significant Pearson correlation between paired samples, while 98 (41%) had a significant Spearman rank correlation (online supplementary table S3). Likewise, 171 of 528 (32%) ASV analysed presented a significant Pearson correlation (Spearman: 208 (39%)) (online supplementary table S3). Correlations are generally stronger at the ASV level (Pearson’s third quartile 0.229, maximum 0.966) than at lower taxonomic levels (Pearson’s third quartile 0.159, maximum 0.637).
Discussion
In this study, we present the microbial composition of paired sigmoid biopsy and faecal samples from a broad randomly selected population cohort with and without IBS and with an otherwise healthy gut. We observed that faecal microbiome diversity correlated to a proxy measure of stool consistency. We also observed that those with poorer self-rated health had a decreased MAM diversity. The between-sample divergence was higher in IBS compared with controls from the same population sampling frame, but no clear biomarker of IBS was found.
There is emerging evidence that the microbiome may play a role in IBS, but the data are conflicting in terms of associations with specific bacterial taxa. Unlike some previous IBS studies,8 32–36 we did not find any significant differences in the faecal sample composition of IBS subjects and healthy controls. It is possible that this reflects the larger size of the current cohort (379 sigmoid biopsies, 185 faecal samples) as well as the relatively low number of IBS individuals included (20%). However, we argue that this is at least in part due to the exclusion of subjects with comorbidities, honing in on the true microbiological effects of IBS, and not on other intestinal alterations that may induce IBS-like symptoms. Our findings may also explain the limited effects from faecal microbial transfer in IBS.37 While rifaximin, a non-absorbable antibiotic, is efficacious in a subset of IBS cases, it is unknown whether this is due to an antimicrobial or anti-inflammatory effect, or where the site of action may occur.38 39
In a recent meta-analysis by Pittayanon and colleagues,40 22 papers were included; two Chinese studies assessed colonic tissue while the rest only assessed stool microbiome. The reported data at the phylum level was conflicting. Similarly, of the nine papers reporting alpha-diversity, five showed a decrease and four did not, while two studies reported no beta-diversity differences. These results are in general consistent with ours, but the current study is conducted in a random population sample with adequate controls, and our sample size is much larger than any reported by Pittayanon et al. 40 One previous study by Pozuelo et al with a comparably large faecal cohort (113 IBS cases and 66 healthy controls) did observe differences in the stool microbiome of IBS-M and IBS-D.41 Specifically, families Methanobacteriaceae, Ruminococcaceae, Erysipleotrichaceae, and one unknown Clostridiales family were all found to be decreased in these patients. While Methanobacteriaceae are methane producers, the latter three are butyrate producers. Whether differences in the cohort or in methodology account for this difference is unclear. Pozuelo et al also reported many discrepancies with the previous literature.
Gut transit time, or its proxy, the Bristol stool scale, is recognised as one of the most important factors shaping the faecal microbiome.42 In good agreement with this and with a preliminary analysis of this cohort,43 we found that diversity in the faecal microbiome was dependent on frequency of defecation and stool consistency, but that this did not impact the MAM. Diversity was affected by self-rated health, BMI and stool consistency. These parameters were not correlated to each other in our cohort, although loose stools were associated to BMI >25. While the link between obesity and diarrhoea is well established (eg44 45), a connection between BMI and alpha-diversity is less clear. Although it has been reported several times, recent meta-analyses have not found sufficient evidence to support lower alpha-diversity as a biomarker of obesity.46 47 A single bacterial species, Lachnospira pectinoschiza, was found to correlate between faecal samples and BMI. This is a butyrate-producing pectinophile.48 49 Family Lachnospiraceae has previously been connected to a Westernised lifestyle and to obesity,50 the latter possibly due to the butyrate-producing members of this family.51
A particular strength of this work is presenting both colonoscopic findings and MAM from individuals of the general population. The communities observed in faecal samples were markedly different from those attached to the sigmoid following colonoscopy preparation.11 13 There was a significant subject-specific signature between stool samples and distal colonic samples,12 13 but only 24% of the taxa assessed present a significant linear correlation between their relative abundances in faeces and in MAM. Therefore, the choice of sample type has to take into account the hypotheses being tested. Here we have sequenced a biopsy from the sigmoid, but previous studies have found that the colonic MAM is, despite patchiness, fairly unchanging along its length.10 52 Our results do not exclude a role for MAM in IBS pathogenesis at other sites. We did not evaluate the small intestinal microbiome, which is important as increased small intestinal permeability and increased circulating small intestinal T cells may be found in a subset of the IBS population.53 54
Interestingly, richness was not correlated to the same factors as diversity, which suggests that a similar number of species is present in every individual, but in individuals with short transit time, only fast-growing bacteria have time to proliferate. Unfortunately, it wasn’t possible in this cohort to assess total bacterial density per gram of stool, which might play a related role.32
Another intriguing aspect of our observations is the connection between MAM diversity and self-rated health. While this measure is significantly correlated to anxiety, depression and GSRS score, none of these factors, by themselves or in combination, were correlated to diversity. Most diagnoses that have been studied in connection to the gut microbiome have been characterised by decreased richness.42 Therefore, it is not entirely surprising that individuals with low self-rated health also have a lower gut microbiome richness. Still, it is possible that the connection between a general feeling of health and the richness of the gut microbiome could be mediated by immune or neurological pathways. Coprococcus catus was associated to lower levels of depression. A similar connection at the genus level has been previously reported.3 Genus Coprococcus_2 which includes C. eutactus and uncultured organisms, was also associated to higher self-rated health. We also found a negative correlation between age and genus Bifidobacterium and B. bifidum in particular. This association, together with 11 others, was also found in the LLDeep study,3 but has not been reported for other large cohort studies, possibly due to regional effects.55
A common thread in our findings is that healthy individuals were more similar to each other than diseased ones, a phenomenon sometimes called the Anna Karenina effect.56 Individuals with IBS, most notably IBS-U and IBS-M, were less alike than healthy individuals. A greater spread in beta-diversity in the MAM was also observed for both underweight and overweight individuals. This spread also increased with decreasing self-rated health.
A limiting factor in our analysis of the faecal microbiome is that samples were transported at room temperature without preservatives. To assess what effect, if any, this had on our results, every analysis was performed twice, once with the full dataset and once excluding six common bloom bacteria, namely Enterobacteriaceae, Enterococcaceae, Lactobacillaceae, Pseudomonadaceae, Bacillaceae and Staphylococcaceae. These six families did not make up more than 1.1% of the total community in any sample, and typically less than 0.001%. Excluding them had, accordingly, no effect on our analyses. In recent studies sampling faeces from thousands of individuals, no more than 10%–15% of the observed variance in the microbial community could be explained by the extensive metadata gathered.57 The metadata available here was not as comprehensive, and the explained variance is comparably smaller. It is clear that some important factors cannot be accounted for in our study, as evidenced by the lack of observed effect of probiotics and antibiotics. While the use of antibiotics has most likely had an effect on individual microbiomes, these effects were not severe enough to differentiate the antibiotic users from the general population weeks or months after treatment.
In conclusion, no distinct microbial signature was observed in IBS. The degree of heterogeneity in the gut of healthy individuals is in the same order of magnitude as the difference between healthy and IBS individuals, but individuals presenting with poor self-rated health have, on average, a lower gut microbiome richness and a larger spread in composition. This same spread in composition was observed for individuals with IBS-U and IBS-M, as well as for underweight and overweight individuals.
Footnotes
Twitter @luhugerth
Contributors Study design and data collection: LK, LA, LE; data analysis: LWH, AA, NJT; reporting of the findings: LWH, AA, NJT, AMF, PTS, LA, LE.
Funding This study was financed by Ferring Pharmaceuticals and the Söderbergs Foundation.
Competing interests None declared.
Patient consent for publication Not required.
Provenance and peer review Not commissioned; externally peer reviewed.
Data availability statement Data are available in a public, open access repository. The raw sequencing data is freely available from the European Nucleotide Archive as study PRJEB31817, samples ERS3379832-ERS3380418, available at https://www.ebi.ac.uk/ena/data/view/PRJEB31817.