Article Text

Abstract
Objective Food intake normally stimulates release of satiety and insulin-stimulating intestinal hormones, such as glucagon-like peptide (GLP)-1. This response is blunted in obese insulin resistant subjects, but is rapidly restored following Roux-en-Y gastric bypass (RYGB) surgery. We hypothesised this to be a result of the metabolic changes taking place in the small intestinal mucosa following the anatomical rearrangement after RYGB surgery, and aimed at identifying such mechanisms.
Design Jejunal mucosa biopsies from patients undergoing RYGB surgery were retrieved before and after very-low calorie diet, at time of surgery and 6 months postoperatively. Samples were analysed by global protein expression analysis and Western blotting. Biological functionality of these findings was explored in mice and enteroendocrine cells (EECs) primary mouse jejunal cell cultures.
Results The most prominent change found after RYGB was decreased jejunal expression of the rate-limiting ketogenic enzyme mitochondrial 3-hydroxy-3-methylglutaryl-CoA synthase (mHMGCS), corroborated by decreased ketone body levels. In mice, prolonged high-fat feeding induced the expression of mHMGCS and functional ketogenesis in jejunum. The effect of ketone bodies on gut peptide secretion in EECs showed a ∼40% inhibition of GLP-1 release compared with baseline.
Conclusion Intestinal ketogenesis is induced by high-fat diet and inhibited by RYGB surgery. In cell culture, ketone bodies inhibited GLP-1 release from EECs. Thus, we suggest that this may be a mechanism by which RYGB can remove the inhibitory effect of ketone bodies on EECs, thereby restituting the responsiveness of EECs resulting in increased meal-stimulated levels of GLP-1 after surgery.
- obesity surgery
- glucagen-like peptides
- small bowel
- diabetes mellitus
- enterocyte biology
This is an open access article distributed in accordance with the Creative Commons Attribution Non Commercial (CC BY-NC 4.0) license, which permits others to distribute, remix, adapt, build upon this work non-commercially, and license their derivative works on different terms, provided the original work is properly cited, appropriate credit is given, any changes made indicated, and the use is non-commercial. See: http://creativecommons.org/licenses/by-nc/4.0/.
Statistics from Altmetric.com
Significance of this study
What is already known on this subject?
Roux-en-Y gastric bypass surgery for obesity has rapid, non-weight-dependent effects on glucose metabolism that cannot be explained by perioperative starvation alone.
What are the new findings?
Intestinal ketogenesis, induced by prolonged high-fat feeding, may be a mechanism blunting GLP-1 responsiveness in obese subjects before surgery. After gastric bypass-surgery, this mechanism may be relieved by the inhibition of intestinal ketogenesis, promoting the rapid improvement of the GLP-1 response after surgery.
How might it impact on clinical practice in the foreseeable future?
It may be possible to pharmaceutically target intestinal ketogenesis and thereby counteract the diabetogenic effect of obesity without the need for gastric bypass surgery.
INTRODUCTION
Roux-en-Y gastric bypass (RYGB) is effective in long-term treatment of morbid obesity and type-2 diabetes.1 Weight loss per se is an important factor behind the improved metabolic state, but RYGB also activates early postoperative weight-independent mechanisms, for example, the meal-induced release of gut peptides.2 3 Such RYGB associated effects have highlighted the effects of the anatomical reconfiguration of the alimentary tract in whole-body metabolism. Therefore, we used RYGB as a model to try to find novel intestinal-associated mechanisms in the proximal small intestine to improved glucose metabolism.
Following RYGB the former midgut jejunum becomes the alimentary limb anastomosed to a 30 mL gastric pouch at the esophagogastric junction. Food has to pass 1.5 m in the alimentary limb to the jejuno-jejunostomy before enzymatic digestion starts. Surprisingly small changes occur in the morphological appearance of the jejunal mucosa of the alimentary limb.4 5 However, functional studies suggest that the digestion-deprived alimentary limb fails to assimilate luminal glucose.6–8 Apparently, it undergoes an induction of glucose uptake from the blood circulation, potentially with a glycaemia lowering effect.8 9 It is likely that pre-processing of triglycerides by bile and gastric and pancreatic lipase is deficient. Therefore, food digestion and nutrient-absorption become localised mainly to the distal jejunum and ileum. Increased stimulation of enteroendocrine cells (EECs) by undigested food in the distal small intestine has been suggested as the main mechanism causing the augmented release of enteroendocrine gut peptides, for example, gastric inhibitory peptide, peptide YY and glucagon-like peptide-1 (GLP-1). As additional theory, it has been suggested that preventing exposure of proximal gastrointestinal tract to food could inhibit the release of a hitherto unknown ‘anti-incretin’ factor that reduces insulin release or decreases insulin sensitivity, and its demise could explain the rapid improvement of gut-peptide release and glucose metabolism after RYGB surgery.9 10 The present study was initiated in order to search for such novel glucose-lowering mechanisms after RYGB.
Materials and methods
Surgery and patients
Anthropometric characteristics of the patient pilot study cohorts are shown in table 1. Patients in the proteomics cohort either underwent primary RYGB (four patients) or a conversion from vertical banded gastroplasty to RYGB (three patients). In the confirmatory cohort, nine patients were included, eight of whom underwent a primary RYGB and one underwent conversion from vertical banded gastroplasty to RYGB. In the diet cohort, 12 patients were recruited to also include mucosa sampling before the start of the 2-week very-low-calorie diet (VLCD) preceding RYGB surgery. Samples were retrieved as previously described.5 In brief, during RYGB surgery, a few centimetres of the jejunum 50–60 cm distal to ligament of Treitz was retrieved for research purposes when the omega-loop, between the gastro-enterostomy and the jejuno-jejunostomy, was divided to create the final Roux-en-Y construction (online supplementary figure 1A, left panel). The mucosa/submucosa was separated from the musculature by sharp dissection. Before surgery in the diet cohort, and 6–8 months after surgery in all cohorts, patients underwent an endoscopic examination of the jejunum/Roux limb to retrieve mucosa samples (online supplementary figure 1A, right panel). All endoscopies were performed for research purposes. Mucosal tissue specimens were snap-frozen in liquid nitrogen and kept frozen at −70°C. In these pilot studies, the number of patients included was arbitrarily based on estimations of feasibility of samples size in the global proteomics analysis. The confirmatory samples were retrieved from cohorts where all preoperative, perioperative and postoperative samples were available.
Supplemental material
Patient characteristics in proteomics, confirmation and diet groups
Global protein expression analysis of human jejunal mucosa
The technique has been described earlier.11 Only proteins being consistently changed in all patients and with at least a 50% change from baseline were included for further analysis.
Animal studies
Four-week to 5-week-old male C57BL/6J mice were purchased from Harlan (Horst, The Netherlands). Animals were maintained under controlled temperature (23°C) and light (lights on, 06:30–18:30 hours), with ad libitum access to water and pelleted food (R34 Lactamin, Kimstad, Sweden) with a nutrient content of g%: fat 4%, protein 16.5%, carbohydrate 58.0%; total calorific content: 3 kcal/g. Starting at 6 to 8 weeks of age the mice were fed HFD or low-fat diet (LFD) for 3 weeks or 3 months. The HFD consisted of pelleted food (Surwit Diabetogenic Rodent Diet, D12309; Research Diets, New Brunswick, New Jersey, USA) and had a nutrient content in g%: fat 35.9%, protein 23%, carbohydrate 35.5%; total calorific content: 5.6 kcal/g. The LFD animals continued to receive their usual diet (R34).
In the first set of experiments the mice were sacrificed after 3 weeks of either LFD or HFD and different parts of the small intestine; duodenum (proximal 3 cm), jejunum (middle 3 cm) and ileum (distal 3 cm), as well as the liver, were sampled. Full thickness samples of intestinal wall and one liver lobe were snap-frozen in liquid nitrogen and kept frozen (−70°C) for later analysis of protein expression by Western blotting (see below).
In a second set of experiments the mice were fed LFD or HFD for 3 months. On the study day, food was removed for 45 min before experimentation in order to synchronise feeding status. At the start of the experiment an oral gavage with 250 µL of Intralipid (Soy oil 200 mg/mL, purified egg phospholipids, glycerol, sodium hydroxide, water; Fresenius Kabi, Sweden) was given, containing either vehicle (20 µL of ethyl acetate), 2.5 mg of the mitochondrial 3-hydroxy-3-methylglutaryl-CoA synthase (mHMGCS) inhibitor hymeglusin (Santa Cruz Biotechnology, Santa Cruz, California, USA; dissolved in vehicle) or 25 mg of β-hydroxybutyrate (βHB, Sigma-Aldrich, St Louis, MO; dissolved in vehicle). At 15, 30 or 120 min, venous blood samples were retrieved from the tail and βHB was analysed using a GlucoMen LX β-ketone sensor (A. Menarini Diagnostics, Firenze, IT).
In a third set of experiments the mice were kept on LFD or HFD for 3 weeks and fasted for 6 hours before start of the experiment. Then an oral gavage with 500 µL of Intralipid (Fresenius Kabi) was given and after an additional 90 min the mice were anaesthetised using isoflurane. A laparotomy was performed and the portal vein was identified and punctured using a thin needle and blood was collected. Peripheral blood samples were concomitantly drawn from the eye. Blood samples were centrifuged to prepare serum. βHB was analysed in serum using an EnzyChrom Ketone Body Assay kit (BioAssay Systems, Hayward, California, USA).
Biopsy homogenisation, Western blotting and βHB quantification
For all human cohorts, and all murine frozen jejunal mucosa specimens, tissue samples were prepared as described earlier.11 For each detected band, density was quantified, and expressed as a percentage of the total densities of all bands of that specific size on the same membrane. Glyceraldehyde-3-phosphate dehydrogenase (GAPDH) was used as loading control. For antibodies see online supplementary table 1.
Supplemental material
For βHB quantification, tissue homogenates peri-RYGB and post-RYGB from the ‘diet cohort’ were analysed using βHB Colorimetric Assay Kit (Cayman Chemical, Ann Arbor, Michigan, USA) and results normalised to homogenate protein content.
Histology of human jejunal mucosa
Jejunal mucosal specimens retrieved from patients peri-RYGB and post-RYGB (n=5, random selection from confirmatory cohort) were processed according to standard procedures for histology specimen preparation. Briefly, biopsies were fixed in phosphate-buffered 4% formaldehyde, dehydrated and embedded in paraffin. Embedded biopsies were cut in 5 µm sections. For immunofluorescence, sections were rehydrated, antigens were retrieved and sections were blocked in 5% normal goat serum (31872, ThermoFisher Scientific, Rockford, Illinois, USA) before incubation with primary antibody overnight at 4°C. Slides were then washed and incubated with the secondary antibody for 2 hours at room temperature and counter-stained with Hoechst staining (H6024, Sigma-Aldrich). For antibodies see online supplementary table 1. Sections with blocking buffer instead of primary antibody were included as negative controls. For general histology, H&E staining was performed according to standard procedures.
Mouse jejunal primary culture and GLP-1 secretion quantification
Jejunal primary cultures were prepared from mice on C57BL6 background as previously described.12 In brief, the intermediate 10–15 cm region of the small intestine was isolated, digested and crypts were isolated. Crypts were then seeded on Matrigel-coated 24-well plates in high glucose DMEM supplemented with 10% FBS, 2 mM L-Glutamine and 100 U/mL penicillin and 0.1 mg/mL streptomycin and 10 µM Y-27632. The day after plating, cells were washed with saline secretion buffer (138 mM NaCl, 4.5 mM KCl, 4.2 mM NaHCO3, 1.2 mM NaH2PO4, 2.6 mM CaCl2, 1.2 mM MgCl2, 10 mM HEPES and 0.1% BSA, pH 7.4) with 1 mM glucose for 30 min. A first hour incubation was performed in secretion buffer with 1 mM glucose, supernatant collected and replaced for a second hour with secretion buffer with different additives: 10 mM glucose +0.1 mM 3-isobutyl-1-methylxanthine (IBMX), 10 mM glucose +0.1 mM IBMX +10 mM βHB, 10 mM glucose +0.1 mM IBMX +0.1 µM somatostatin. Supernatants were centrifuged for 5 min 1000 g at 4°C to remove any cell debris and directly snap-frozen until analysis. Samples were analysed for total GLP-1 (Mesoscale Discovery, Rockville, Maryland, USA) and data were normalised to the first hour secretion from the same well. Pertussis toxin (PTX, 500 ng/mL), when used, was added to cells 4–5 hours after plating, allowing a 16 hours preincubation before the start of the secretion experiment, and was included during the secretion experiment.
Patient and public involvement
The public and patients were not involved in the design, recruitment or conduct of this study.
Statistical analyses
Student’s t-test was used for analysis of statistical changes in protein levels in the proteomics analysis of spot intensities on two-dimensional gel electrophoresis. Two-way analysis of variance (ANOVA) followed by Tukey’s honestly significant difference (HSD) test was used for analysis of GLP-1 secretion data. Non-parametric Wilcoxon signed-rank test was used for paired human data and non-parametric Mann-Whitney U test for unpaired mice data. All statistics were performed using Prism 7 and 8 (GraphPad, La Jolla, California, USA). If not otherwise stated, mean and SEM are presented in figures.
Results
RYGB reduced jejunal mHMGCS protein expression
Intraindividual global protein expression analysis was performed to identify changes in the proteome of human mucosal jejunal biopsies retrieved during operation and 6–8 months postoperatively. In total, 27 protein spots corresponding to 12 unique proteins passed the selection criteria (unidirectionally, regulated by at least 50% from baseline following RYGB). The four protein spots with the strongest down-regulation (mean decrease of −3.8-fold; p<0.001) following RYGB were identified by tandem mass spectrometry as mHMGCS. Representative images of the 2D gel electrophoresis are shown in online supplementary figure 1B. Other proteins identified by this proteomic approach have been published previously.11 13 A list of all regulated proteins is shown in online supplementary table 2.
Supplemental material
Confirmation of surgery-associated reduction in mucosal mHMGCS and ketone body levels
Western blotting confirmed the decrease of mHMGCS using the same samples that were used for the global proteomics analysis (figure 1A; one sample from the proteomic analysis had to be omitted due to insufficient remaining volume). Blotting-analysis was performed on the confirmatory patient cohort showing similar reduction after RYGB (figure 1B). Characteristics for all cohorts are shown in table 1. Jejunal mucosal levels of the ketone body βHB were measured in perioperative samples from fasting patients who had undergone a 2-week preoperative VLCD, and the same patients 6–8 months after RYGB. The postoperative levels were found to be significantly decreased (figure 1C; peri-RYGB vs post-RYGB; mean±SEM; 70.5±4.7 vs 39.3±2.2 µM/µg protein, n=11; p<0.001; one sample had to be omitted due to technical difficulties).

Western blot analysis of jejunal mHMGCS protein expression peri-RYGB and post-RYGB. (A) Upper panel shows Western blots of mHMGCS in jejunal samples from the proteomics cohort of patients (n=6). Neighbouring samples represent pairs of perioperative (white bars above) and postoperative (grey bars above) samples from the same patient. GAPDH was used as loading control and is shown below each corresponding mHMGCS band. Lower panel shows densitometric measurement of mHMGCS normalised to GAPDH peri-RYGB and post-RYGB. (B) Upper panel shows Western blot of mHMGCS in jejunal samples from the confirmatory cohort of RYGB patients peri-RYGB and post-RYGB (n=9). Group pairs originating from multiple Western blots were merged for presentation of all pairs. Lower panel shows densitometric measurement of mHMGCS normalised to GAPDH peri-RYGB and post-RYGB. (C) Measurement of the ketone body βHB in human jejunal mucosa samples after a 2-week preoperative VLCD and 6–8 months postoperatively after RYGB surgery in the same patients (n=11). (D) mHMGCS-immunofluorescence from one patient perioperatively and (E) 6 months postoperatively after RYGB. (F) and (G) show corresponding H&E stainings to panels (D) and (E), respectively. Statistical analyses were performed using Wilcoxon signed-rank test. *p<0.05, **p<0.01, ***p<0.001. +ve, positive control. ADU, arbitrary densitometric units; GAPDH, glyceraldehyde-3-phosphate dehydrogenase; mHMGCS, mitochondrial 3-hydroxy-3-methylglutaryl-CoA synthase; RYGB, Roux-en-Y gastric bypass.
mHMGCS is localised to the surface epithelial layer in human jejunum
To study mHMGCS expression morphologically we performed immunostaining of samples taken perioperatively and postoperatively after RYGB (n=5 sample pairs, randomly selected from confirmatory cohort). mHMGCS-immunostaining was localised to the epithelium, indicating predominant expression in enterocytes. Six months after RYGB, the immunoreactivity to mHMGCS was low or absent in all investigated specimens, thus supporting the semi-quantitative results from the proteomic and blotting-analyses. Figure 1D–G show representative images of perioperative and postoperative staining of mHMGCS in one of the patients.
Reduction in mucosal mHMGCS is specific to surgery and is not decreased by preoperative VLCD
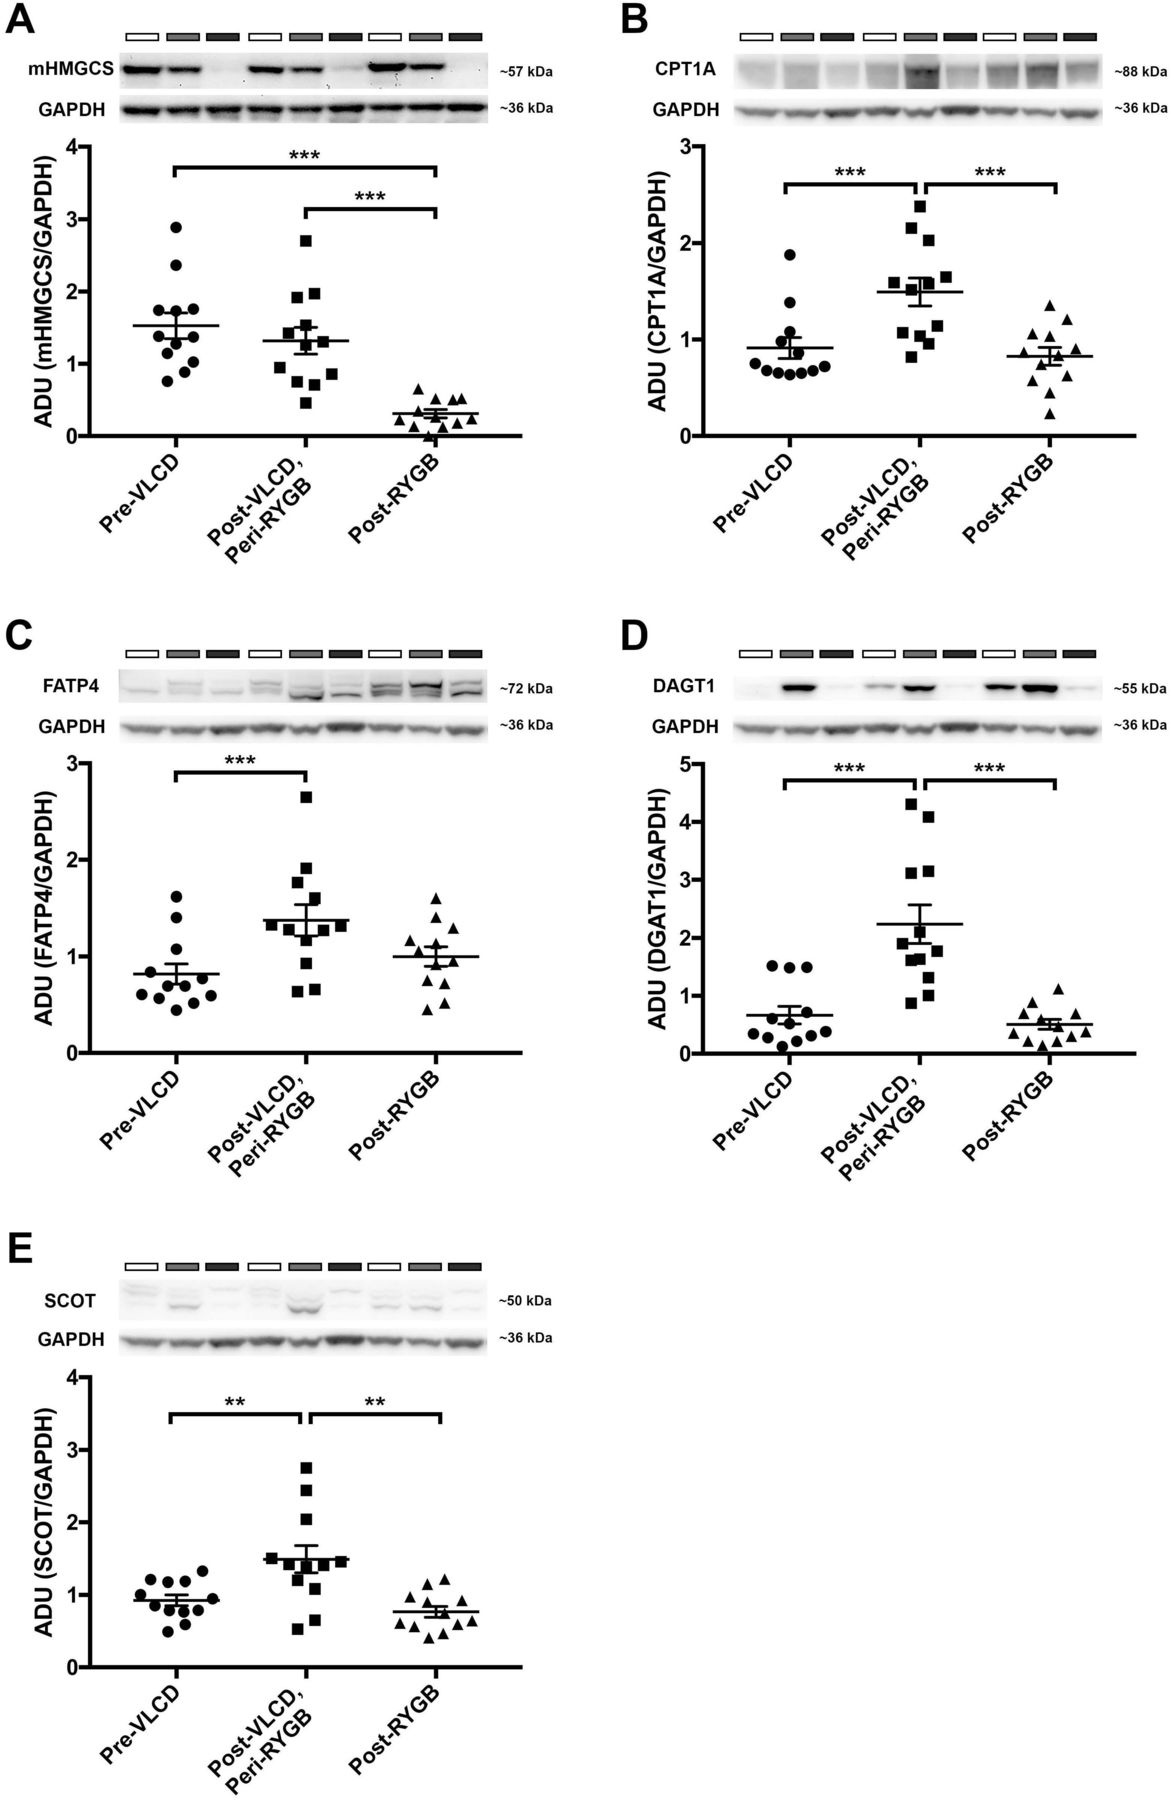
Blotting-analysis of mucosa samples retrieved from diet cohort before VLCD, at surgery and after surgery confirmed that reduction of mHMGCS was specific to surgery (figure 2A; pre-VLCD vs post-VLCD/peri-RYGB vs post-RYGB; mean±SEM; 1.53±0.18 vs 1.32±0.19 vs 0.31±0.06; n=12). Analysis of lipid metabolism markers CPT1A (figure 2B; mean±SEM; 0.91±0.11 vs 1.49±0.15 vs 0.83±0.09; n=12), FATP4 (figure 2C; mean±SEM; 0.82±0.11 vs 1.38±0.16 vs 1.00±0.10; n=12) and DGAT1 (figure 2D; mean±SEM; 0.67±0.15 vs 2.24±0.33 vs 0.51±0.09; n=12) revealed no change comparing samples retrieved before diet and after surgery, but an increased expression after VLCD. The ketone body utilising enzyme succinyl-CoA-3-oxaloacid CoA transferase (SCOT) was increased after VLCD but no change was seen after surgery compared with baseline (figure 2E; baseline vs VLCD vs RYGB; mean±SEM; 0.93±0.08 vs 1.49±0.19 vs 0.77±0.08; n=12).

Western blot analyses of jejunal mHMGCS, and several fat-metabolism associated proteins pre-VLCD, post-VLCD/peri-RYGB and post-RYGB from the diet cohort of patients (n=12). The upper panels show Western blots of (A) mHMGCS, (B) CPT1A, (C) FATP4, (D) DGAT1 and (E) the ketone body-catabolising enzyme SCOT. In each panel representative protein bands from three of the patients for the protein of interest and the corresponding loading control GAPDH are shown. Neighbouring samples represent pre-VLCD (white bars above Western blots), post-VLCD/peri-RYGB (grey bars) and post-RYGB (black bars) samples from the same patient. In the lower panels expression of each protein of interest has been normalised to the loading control GAPDH and is presented in the bar graphs . Statistical analyses were performed using Wilcoxon signed-rank test. *p<0.05, **p<0.01 and ***p<0.001. ADU; arbitrary densitometric units. GAPDH, glyceraldehyde-3-phosphate dehydrogenase; mHMGCS, mitochondrial 3-hydroxy-3-methylglutaryl-CoA synthase; CPT1A, carnitin-palmitoyl-transferase-1A; DGAT1, diacylglycerol O-acyltransferase 1; FATP4, long-chain fatty acid transport protein 4; SCOT, succinyl-CoA-3-oxaloacid CoA transferase; RYGB, Roux-en-Y gastric bypass; VLCD, very-low-calorie diet.
Mouse intestinal mHMGCS expression is fat sensitive and most pronounced in the jejunum
To confirm the induction and further investigate the potential functionality of small intestinal mucosal mHMGCS protein, animal studies were employed. C57bl/6J mice were fed either LFD or HFD over 3 weeks. HFD mice showed significantly higher weight gain compared with LFD mice (body weight gain LFD vs HFD; mean±SEM; 0.94±0.23 vs 5.84±0.53 g, n=8, p<0.001). Western blotting of mHMGCS was performed on specimens from the mucosa of the duodenum, the jejunum and the ileum, as well as liver. No difference in mHMGCS expression was observed in the duodenum when comparing mice on LFD and HFD (figure 3A; LFD vs HFD; mean±SEM; 1.10±0.23 vs 1.35±0.18, n=6, p=NS). However, the mHMGCS protein expression observed in the jejunum (figure 3B; LFD vs HFD; mean±SEM; 0.59±0.03 vs 1.43±0.20, n=5, p<0.01) and ileum (figure 3C; LFD vs HFD; mean±SEM; 0.84±0.06 vs 1.18±0.09, n=6, p<0.05) was significantly higher after HFD than LFD. A comparison of mHMGCS expression between the jejunum and the ileum revealed substantially higher levels of mHMGCS expression in the jejunum after HFD (figure 3D; jejunum vs ileum; mean±SEM; 1.39±0.13 vs 0.70±0.06, n=5/6, p<0.01). mHMGCS expression in the liver was somewhat increased (figure 3E; LFD vs HFD; mean±SEM; 0.87±0.04 vs 1.15±0.07, n=6, p<0.01).

Western blot analyses of the effects of low-fat diet (LFD; white bars above blots) versus high-fat diet (HFD; grey bars above blots) on mHMGCS protein expression. Upper panels show mHMGCS expression in (A) duodenum, (B) jejunum, (C) ileum, (D) jejunum versus ileum and (E) liver in C57BL/6J mice on LFD or HFD. GAPDH was used as loading control and is shown below each corresponding mHMGCS band. Lower panels show the corresponding densitometric quantifications of mHMGCS versus GAPDH. Note that (D) shows comparison of mHMGCS in the jejunum (light grey BAR) vs ileum (dark grey BAR) in HFD fed mice to demonstrate the difference in expression levels between jejunum and ileum. (F) Measurement of βHB at 0, 15, 30 and 120 min in venous blood of mice fed LFD or HFD for 3 months. prior to the experiment the mice were given an oral fat load (250 µL of intralipid) in order to supply substrate for ketogenesis. In some mice the oral fat load was mixed with βHB, or the mHMGCS-inhibitor hymeglusin, as indicated. (G) shows the measurements from (F) at 120 min in a scatter plot (n=7–8). βHB levels in venous blood were significantly higher in the HFD mice 120 min after oral gavage compared with LFD mice. Notably, the βHB levels in HFD mice pretreated with the mHMGCS-inhibitor hymeglusin did not increase. (H) Mice fed HFD for 3 weeks had significantly higher levels of ketone bodies in portal vein blood normalised to ketone bodies in peripheral blood, in contrast to mice fed LFD (n=9) after oral gavage with Intralipid (500 µL). (I) Absolute levels of ketone bodies (mM) in peripheral and portal blood in the same mice as in panel H (n=9). Statistical analyses were performed using Mann-Whitney U test. *p<0.05 and **p<0.01. +ve; positive control; ADU, arbitrary densitometric units; GAPDH, glyceraldehyde-3-phosphate dehydrogenase; mHMGCS, mitochondrial 3-hydroxy-3-methylglutaryl-CoA synthase.
Intralipid gavage in HFD-fed mice results in elevated ketone levels in portal blood
In order to examine the functionality of mHMGCS expression induced by HFD in mouse jejunum, we assessed βHB levels in portal and peripheral venous blood. C57bl/6J mice were fed either HFD or LFD during 3 months to robustly induce mHMGCS expression. After oral gavage with intralipid to the mice, venous blood was sampled at different times from the tail (figure 3F). HFD mice showed increased βHB levels after 120 min compared with LFD mice (figure 3G; LFD+intralipid vs HFD+intralipid; mean±SEM; 0.50±0.08 vs 0.87±0.10 mM, n=7, p<0.05). This increase was absent in HFD mice given the mHMGCS inhibitor hymeglusin in the oral gavage (figure 3G; HFD+intralipid vs HFD+intralipid+hymeglusin; mean±SEM; 0.87±0.10 vs 0.46±0.06 mM, n=7, p<0.01). For mice fed LFD no major increase in βHB levels could be seen 120 min after the oral gavage with intralipid, not even with addition of exogenous βHB in the oral gavage (figure 3G; LFD+intralipid+βHB vs HFD+intralipid; mean±SEM; 0.36±0.08 vs 0.87±0.10 mM, n=8/7, p<0.01). In another experiment, we examined βHB levels in portal versus peripheral venous blood in mice that were fed LFD or HFD for 3 weeks. Mice fed HFD had significantly higher baseline levels of βHB in the portal vein when normalised to levels in peripheral blood (portal/peripheral blood) in contrast to LFD mice (figure 3H; LFD portal/peripheral vs HFD portal/peripheral; mean±SEM; 0.62±0.04 vs 1.02±0.10, n=9, p<0.01), showing that the predominant source of βHB shifted between LFD and HFD; with a higher proportion originating from the intestine rather than the liver. In the HFD animals, the absolute levels of βHB in portal blood were also significantly higher compared with the LFD fed animals (figure 3I; LFD portal vs HFD portal; mean±SEM; 1.35±0.14 vs 3.82±0.89 mM, n=9, p<0.05); whereas there was no significant difference in the peripheral blood levels (figure 3I; LFD peripheral vs HFD peripheral; mean±SEM; 2.20±0.22 vs 3.47±0.65 mM, n=9, p=NS). In the LFD animals, βHB levels were significantly lower in portal blood compared with peripheral blood (figure 3I; LFD peripheral vs LFD portal; mean±SEM; 2.20±0.22 vs 1.35±0.14 mM, n=9, p<0.01), which was not the case in the HFD animals (figure 3I; HFD peripheral vs HFD portal; mean±SEM; 3.47±0.65 vs 3.82±0.89 mM, n=9, p=NS). These data indicate that the difference between LFD and HFD feeding was increased intestinal, rather than decreased hepatic production of βHB.
Ketone bodies inhibit glucose-stimulated GLP-1 release from mouse small intestinal EECs
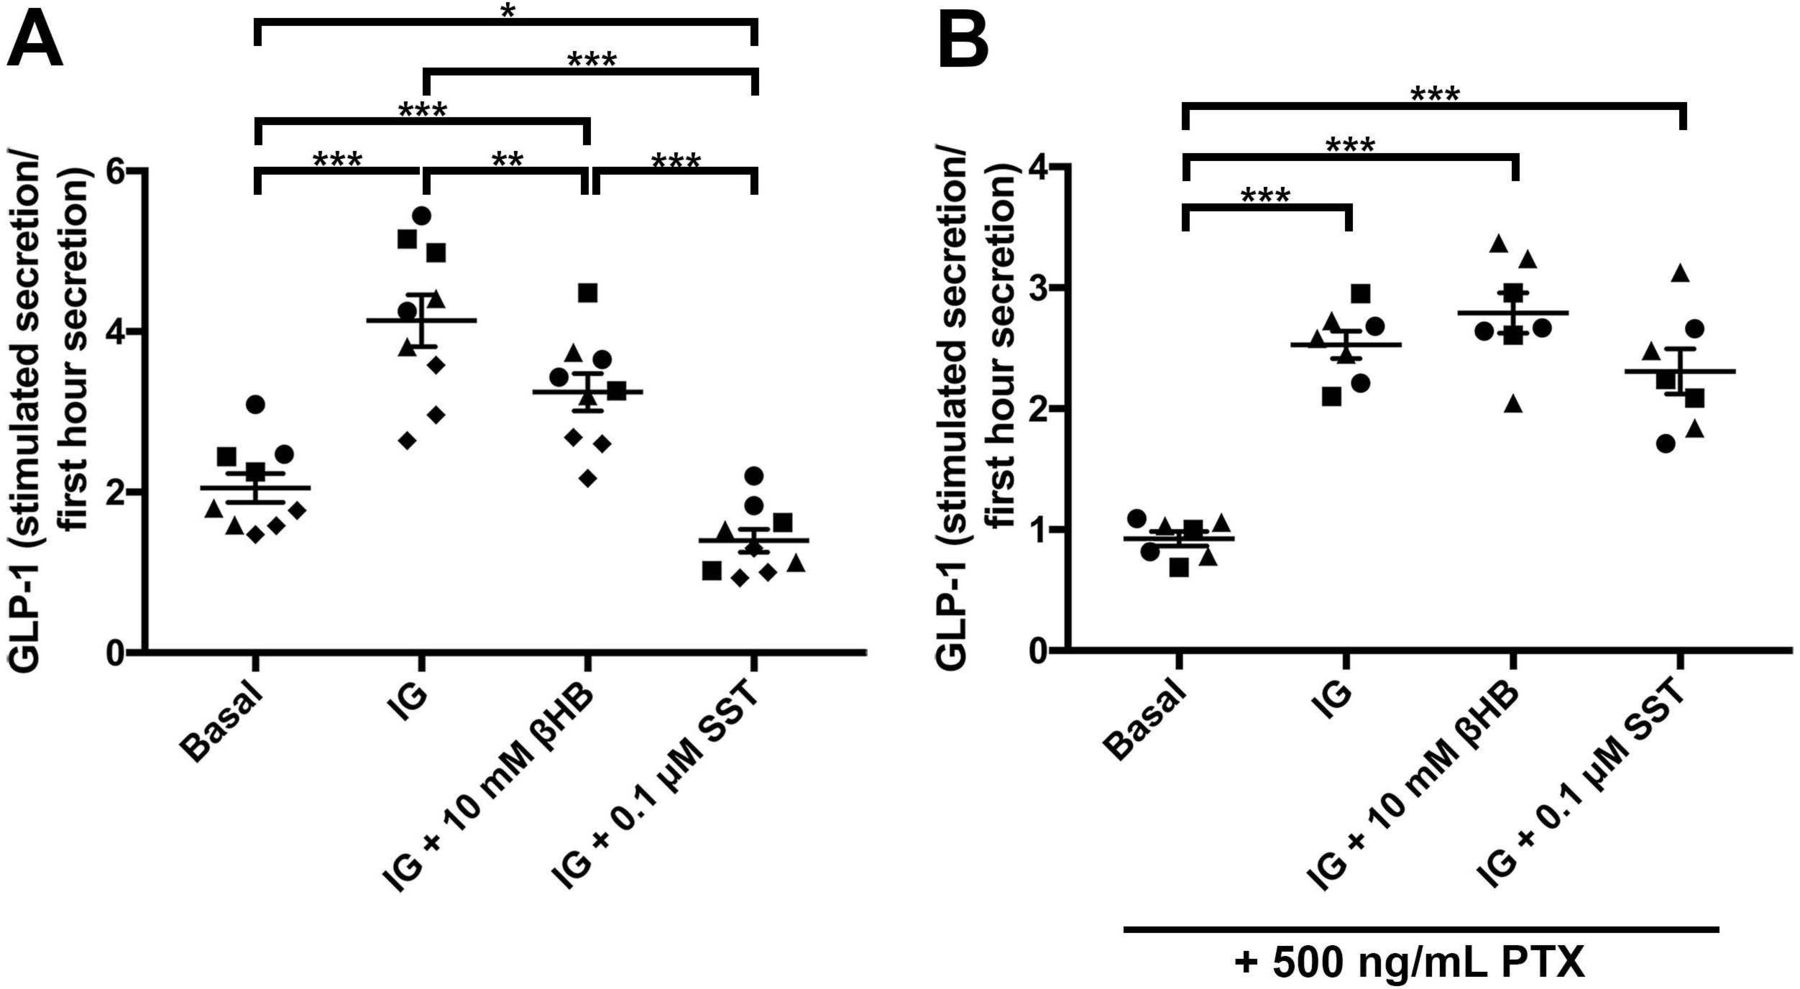
There are two known fatty acid/ketone receptors expressed on small intestinal EECs. FFAR3/GPR41, that is preferentially expressed on small intestinal human and mouse EECs, and GPR109a, which is expressed at much lower levels.14 15 Therefore, we tested whether ketone bodies could have effects on the release of gut peptides from EECs. Primary cultures from mouse jejunum were used to measure the effect of βHB on basal and glucose-stimulated and IBMX-stimulated release of the gut peptide GLP-1. The βHB levels were chosen based on an approximated molar concentration of βHB in human jejunal mucosa (figure 1C). The mucosa was assumed to constitute a third of the 6 µL cylindrical volume of a 2 mm forceps biopsy sample, diluted in buffer to 30 µL in the βHB assay, thus representing a total 15-time dilution. Average measured βHB levels in the jejunal samples was 0.8 mM. At a 15-time dilution this should reflect a tissue concentration of about 12 mM in vivo. We decided to use βHB at a 10 mM concentration, and found this to inhibit the glucose/IBMX-stimulated GLP-1 release by 43% (figure 4A; IG+10 mM βHB vs IG compared with Basal). Somatostatin had an even greater inhibitory effect and completely blocked the stimulation induced by glucose/IBMX (figure 4A). As FFAR3 and GPR109a are Gαi coupled receptors, we tested whether the blocking effect of βHB was mediated via Gαi signalling by treating the cell cultures with PTX. PTX treatment ablated the inhibitory effect of βHB on GLP-1 release in response to glucose/IBMX-stimulation (figure 4B). PTX also blocked the effect of somatostatin, as expected (figure 4B). While these data do not specifically prove FFAR3 to mediate the inhibitory action of βHB, they do indicate the involvement of a Gαi coupled receptor.

(A) Normalised GLP-1 levels in unstimulated (basal, 1 mM glucose) mouse jejunal primary cultures (first cluster from the left), after stimulation with 10 mM glucose/0.1 mM IBMX (IG; second from left), or a combination of 10 mM glucose/0.1 mM IBMX and 10 mM βHB (third from left), or a combination of 10 mM glucose/0.1 mM IBMX and 0.1 µM somatostatin (SST) (fourth from left). (B) Same group setup as a, but all groups were also treated with 500 ng/mL PTX in order to block Gαi signalling. The different symbols depict replicates of jejunal primary cultures. Statistical analyses were performed using two-way ANOVA followed by Tukey’s HSD-test. *p<0.05, **p<0.01 and ***p<0.001. GLP-1, glucagon-like peptide-1; PTX, pertussis toxin.
Proposed mechanistic model
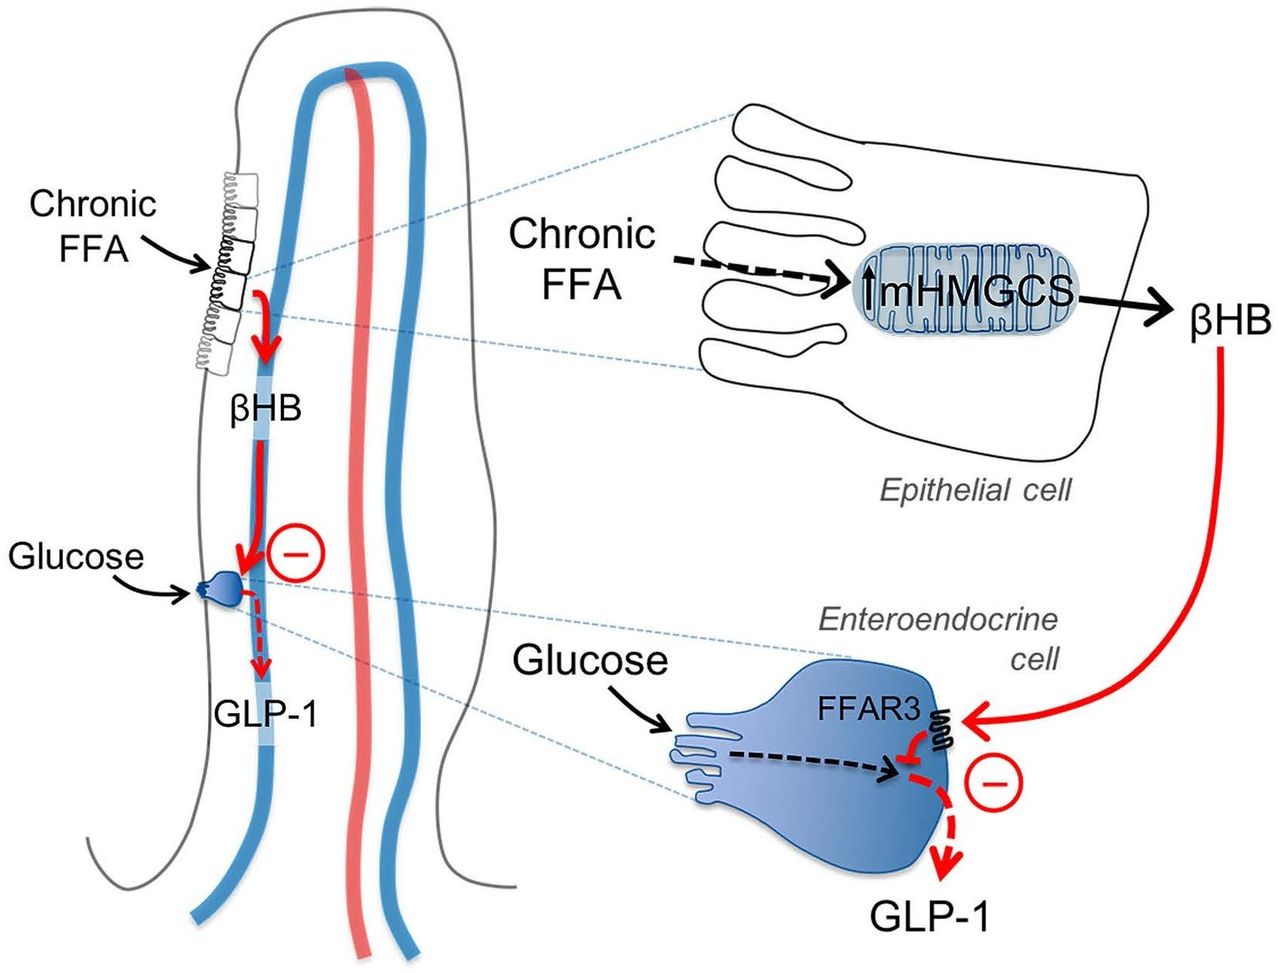
Figure 5 shows a proposed mechanistic model for how HFD dose-dependently may inhibit glucose-stimulated release of gut peptides, for example, GLP-1 from EECs. Chronic fat exposure induces increased mHMGCS expression and ketogenesis in jejunal epithelial cells (as suggested in figure 3B, F–I and 1C). Ketone bodies (βHB) reach the EECs in a paracellular fashion and via the microcirculation of villi and act on FFAR3 to inhibit the release of GLP-1 (as suggested in figure 4). RYGB surgery may inhibit this mechanism by immediately removing accessibility of FFA as substrate for ketogenesis, and by down-regulating mHMGCS expression and βHB in the jejunum (as shown in figure 1A to C), thereby alleviating the inhibitory effect of ketone bodies on EEC incretin production.

Schematic illustration of the proposed ketone body mechanism on GLP-1 producing enteroendocrine cells (EECs). Chronic free fatty acid (FFA) exposure induces increased mHMGCS expression and βHB production in jejunal epithelial cells in the villi tips. βHB reaches the EECs via the venous microcirculation of the villi, and acts via FFAR3/GPR41 to inhibit the production/release of GLP-1. RYGB surgery may interfere with this mechanism by decreasing FFA availability and mHMGCS expression. GAPDH, glyceraldehyde-3-phosphate dehydrogenase; GLP-1, glucagon-like peptide-1; mHMGCS, mitochondrial 3-hydroxy-3-methylglutaryl-CoA synthase; RYGB, Roux-en-Y gastric bypass.
Discussion
Very few reports are available on the expression of the rate-limiting ketogenic enzyme mHMGCS in human small intestinal mucosa.16 We show that RYGB surgery per se, and not decreased caloric intake, resulted in a substantial decrease in mHMGCS expression and jejunal ketone body (βHB) levels. There could be several reasons for the decreased expression and ketone body production after surgery . For example, decreased lipolysis due to the deviation of bile and pancreatic lipases from the alimentary limb could cause substrate unavailability. Another reason could be increased lipid utilisation for anabolic purposes or lipid oxidation for energy demand, following the hypertrophy that occurs in the alimentary limb of the jejunum after RYGB.5 17 18
Ketone bodies are known to be liver-produced during starvation or high-fat low-carbohydrate ketogenic diet in order to supply energy for peripheral tissues, including the brain, when glucose levels are low. Ketogenesis has an association to short fatty acids like butyrate, which both induce mHMGCS expression via PPARα and also act as precursor substrates via β-oxidation.16 In the small intestine mHMGCS instead has a food intake related expression. It has previously been shown to be highly expressed in the early postnatal period in suckling rodents, and starvation decreased its expression, in opposition to hepatic ketogenesis.19 20 After weaning to LFD the expression disappeared from the intestine.20 It is probably the high fat-content of breast milk that induces mHMGCS. Small intestinal expression of mHMGCS can also be reactivated by high-fat diet in adult rodents.21 22 Thus, intestinal ketogenesis could represent a fat-sensory mechanism of the small intestinal mucosa. It seems likely that this is a completely different nutrient-mediated signal compared with systemic ketogenesis, during which ketones have been suggested to act as systemic signalling metabolites that may protect against insulin resistance and type-2 diabetes.23
In animal experiments, we confirmed that expression of mHMGCS was substantially increased in the jejunum after HFD-feeding. This expression lead to increased levels of the ketone body βHB in the portal blood of mice. Furthermore, the βHB production was completely blocked by per-oral pretreatment with the specific mHMGCS-inhibitor hymeglusin. The local levels of ketone bodies at the site of production, that is, the mucosal epithelial cells and in the microcirculation of villi may however be substantially higher (approximated by our mucosal measurements ∼10 mM), since portal blood is ‘diluted’ by venous return from regions of the intestine other than the jejunum. A potential limitation of our study is that it was not possible to obtain postprandial samples for ketone body measurement in RYGB-operated patients. It was recently shown that the postprandial fatty acid uptake and oxidation was increased (and not decreased) in RYGB-operated rats.18 Whether this reflects a compensatory increase in other parts of the intestine, remains to be investigated.
The cessation of inhibitory ketone bodies on EECs could contribute to an increased gut peptide responsiveness after RYGB surgery. In cell culture on primary EECs, the ketone body βHB inhibited glucose-stimulated GLP-1 release by ∼40% compared with baseline. This inhibition was mediated by a Gαi coupled receptor as it was completely reversed by the Gαi coupled receptor-inhibitor PTX. The Gαi coupled ketone body/fatty acid receptor FFAR3/GPR41 is expressed in the small intestinal epithelium, where it is highly enriched in EECs.14 15 It has earlier been demonstrated to be involved in the regulation of energy homeostasis, via for example, PYY and GLP-1.24 Our data suggest a new mechanism, as the Gαi coupled receptor-inhibitor PTX blocked the suppressive effect of both βHB and somatostatin on GLP-1 release from EECs. However, we could not definitely conclude whether the βHB induced inhibition of GLP-1 secretion is mediated by FFAR3, or an alternative Gαi coupled receptor such as GPR109a, in the EECs. GPR109a is however expressed at a much lower level in EECs.15
In summary, we suggest a surgical physiological reconstruction of the alimentary limb by inducing substrate deficiency for ketogenesis. This could contribute to the explanation of the very rapid improvement of incretin hormone secretion observed after RYGB, as we have recently shown is evident already 2 days after surgery.3 These findings are consistent with the proposed ‘anti-incretin’ and ‘foregut exclusion’ hypotheses that could explain the effects of RYGB surgery on improved satiety and glucose homeostasis.10 This may open up a new avenue for the development of anti-obesity and anti-diabetic drugs, targeting mHMGCS and intestinal mucosal ketone production, in order to increase EEC responsiveness and gut peptide release on nutrient stimulation.
Acknowledgments
The authors would like to thank Professor Claes Ohlsson and Kristina Wallenius for critical reading of the manuscript. The proteomics analysis was performed at the Proteomics Core Facility, Sahlgrenska Academy, University of Gothenburg. Animal experiments in Gothenburg were performed in collaboration with and at the Centre for Physiology and Bio-Imaging (CPI), Sahlgrenska Academy, University of Gothenburg. tGLP1 immunoassays were performed at the Addenbrooke’s Hospital Core Biochemical Assay Laboratory.
Footnotes
Contributors Study concept and design: VW, LF, ES, AC, EElias. Acquisition of data: VW, EElias, BH, AC, PL, FR, FMG. Analysis and interpretation of data: VW, EElias, EElebring, BH, PL, FR, CLR, ND, FMG, LF. Drafting of the manuscript: VW, EElebring, LF. Critical revision of the manuscript: AC, EElias, PL, FR, CLR, ND, FMG. Statistical analysis: VW, EElias, EElebring, BH, PL, FR, FMG.
Funding This study was funded by the following grants: ALFGBG-673931 from the Western Region of Sweden, grants from Erik and Lily Philipson memorial foundation, MRC [MRC_MC_UU_12012/3 and MRC_MC_UU_12012/5], Wellcome Trust [106262/Z/14/Z, 106263/Z/14/Z, 100574/Z/12/Z].
Competing interests VW reports grants from Western Region of Sweden, grants from Erik and Lily Philipson memorial foundation. FMG is a paid consultant for Kallyope, New York. The Gribble-Reimann lab hosts projects which receive funding from Medimmune/AstraZeneca (FMG/FR). CLR reports research grants from Science Foundation Ireland, and the Health Research Board, Ireland, during the conduct of the study; other from Novo Nordisk, other from GI Dynamics, personal fees from Eli Lilly, grants and personal fees from Johnson and Johnson, personal fees from Sanofi Aventis, personal fees from Astra Zeneca, personal fees from Janssen, personal fees from Bristol-Myers Squibb, personal fees from Boehringer-Ingelheim outside of the submitted work.
Patient consent for publication Obtained
Ethics approval This study was approved by the Regional Ethics Review Board of Gothenburg, approval numbers 193–02, 647–05 and 007–09, and performed in accordance with the Declaration of Helsinki. All animal procedures were approved by the animal ethics committee of the University of Gothenburg, approval numbers 90–2007 and 246–2009, or according toUK Home Office project license 70/7824 and local regulations (Animals (Scientific Procedures) Act 1986 Amendment Regulations SI 2012/3039).
Provenance and peer review Not commissioned; externally peer reviewed.
Data availability statement All data relevant to the study are included in the article or uploaded as supplementary information.