Article Text

Abstract
Objective Pancreatic ductal adenocarcinoma (PDAC) still carries a dismal prognosis with an overall 5-year survival rate of 9%. Conventional combination chemotherapies are a clear advance in the treatment of PDAC; however, subtypes of the disease exist, which exhibit extensive resistance to such therapies. Genomic MYC amplifications represent a distinct subset of PDAC with an aggressive tumour biology. It is clear that hyperactivation of MYC generates dependencies that can be exploited therapeutically. The aim of the study was to find and to target MYC-associated dependencies.
Design We analysed human PDAC gene expression datasets. Results were corroborated by the analysis of the small ubiquitin-like modifier (SUMO) pathway in a large PDAC cohort using immunohistochemistry. A SUMO inhibitor was used and characterised using human and murine two-dimensional, organoid and in vivo models of PDAC.
Results We observed that MYC is connected to the SUMOylation machinery in PDAC. Components of the SUMO pathway characterise a PDAC subtype with a dismal prognosis and we provide evidence that hyperactivation of MYC is connected to an increased sensitivity to pharmacological SUMO inhibition.
Conclusion SUMO inhibitor-based therapies should be further developed for an aggressive PDAC subtype.
- cancer
- pancreatic cancer
This is an open access article distributed in accordance with the Creative Commons Attribution Non Commercial (CC BY-NC 4.0) license, which permits others to distribute, remix, adapt, build upon this work non-commercially, and license their derivative works on different terms, provided the original work is properly cited, appropriate credit is given, any changes made indicated, and the use is non-commercial. See: http://creativecommons.org/licenses/by-nc/4.0/.
Statistics from Altmetric.com
Significance of this study
What is already known on this subject?
Current data demonstrate that certain subtypes of pancreatic ductal adenocarcinoma (PDAC) are completely resistant to clinically used chemotherapies.
What are the new findings?
We describe for the first time the relevance of the SUMOylation pathway, linked to a poorly differentiated phenotype with a poor prognosis. PDACs with activation of the small ubiquitin-like modifier (SUMO) pathway overlap the basal-like subtype.
We detected a cosegregation of the SUMO pathway with MYC and observed a functional relationship between both pathways.
We demonstrate the relevance of the SUMO pathway as a therapeutic target by the use of novel SUMO-activating enzyme subunit pathway inhibitors and show that MYC hyperactivation sensitises PDAC cells towards such therapies.
How might it impact on clinical practice in the foreseeable future?
SUMO pathway inhibitor-based therapies might be a potential approach to target a PDAC subtype.
Introduction
Pancreatic ductal adenocarcinoma (PDAC) remains a cancer with dismal prognosis reflected by a 5-year survival rate of only 9%.1 In contrast to the continuously increasing understanding of molecular and genetic alterations of the disease,2 3 therapies are not satisfying. Stratified molecular mechanism-based therapies are currently emerging4 but are not standard of care for the majority of patients.
Disease stratification efforts of PDAC demonstrate the existence of several subtypes with unique biology, phenotypes and therapeutic vulnerabilities.5–14 Such insights indicate that defining subtype-specific dependencies will allow for stratification and precise molecularly informed therapeutic intervention. These considerations are furthermore supported by retrospective investigations15 or the COMPASS (NCT02750657) trial,16 which demonstrate that response to conventional chemotherapies differs among subtypes of PDAC.
By controlling genes involved in ribosome biogenesis, metabolism, cell cycle and growth, the MYC oncogene is a driver in a subset of PDACs.17–19 Supported by unbiased synthetic lethality screens,20 it is clear that cancers with a hyperactive MYC network are characterised by dependencies, which offer the unique possibility for therapeutic intervention.17 18 In line with this idea, MYC was recently demonstrated to predict responsiveness of PDAC patient-derived xenotransplants or organoids to BET inhibitors.21 22
Considering the high potential of MYC to act as a marker for patient and therapy selection,18 we set up experiments to decipher dependencies in the subgroup of PDAC with high MYC activity. We observed cosegregation of MYC with the SUMOylation machinery that is connected to sensitivity towards a specific small ubiquitin-like modifier (SUMO) inhibitor.
Methods
Compounds, characterisation of SUMO inhibitors, and chemicals
ML-792 and ML-93 were synthesised by Millennium Pharmaceuticals/Takeda (Cambridge, Massachusetts, USA). Biochemical and cellular characterisation of ML-93 activity is described in online supplementary materials and methods (SM&M). 4-hydroxytamoxifen (4-OHT) was purchased from Sigma (Sigma, Munich, Germany).
Supplemental material
Cell culture and cell line engineering
Description is included in SM&M.
Generation of patient-derived PDAC organoids and primary-dispersed cell lines
Primary patient-derived PDAC three-dimensional (3D) organoids were generated from primary resected human PDAC surgical specimen according to the Tuveson protocol described in23 and in the SM&M.24 Generation and culturing of primary-dispersed human PDAC cells is described in25 and SM&M. Written informed consent from the patients for research use was obtained prior to the investigation.
Viability assays, SUMO inhibitor (SUMOi) treatment, clonogenic assay, annexin V, cell cycle-FACS, viability analysis by FACS, competitive repopulation assay, Western blotting and RNA isolation and expression analysis.
Description is included in SM&M.
Generation of in vivo xenografts and SUMOi toxicity
All animal experiments were performed in accordance with regional Gothenburg University animal ethics committee approval 100/16 and 5.8.18-01949/2018 and approval of Regierung von Oberbayern ROB-55.2–2532.Vet_02-17-230. A detailed description can be found in the SM&M section.
RNA-seq analysis, gene expression profiling, gene set enrichment analysis (GSEA), transcriptomics and genomics data analysis
Description is included in SM&M.
Clinical PDAC patient cohort, histological analysis and immunohistochemistry
Tissue microarrays and analysis of human PDAC cohort (n=262) are described in SM&M. The use of this tumour cohort for biomarker analysis has been approved by the Charité University ethics committee (EA1/06/2004).
Proteome analysis by mass spectrometry
Proteome analysis is described in detail in SM&M.
Statistical methods
Analysis of variance or two-sided t-test was used. P values were corrected according to Bonferroni for multiple testing. Values were calculated with GraphPad Prism6/8. P values are indicated or represented with: *p<0.05, **p<0.01, ***p<0.001, ****p<0.0001. Data are presented as mean and SD.
Results
MYC is connected to the sumoylation pathway in PDAC
A recent study demonstrated that amplification of MYC is the sole copy number variation (CNV) associated with poor prognosis in PDAC.26 To further substantiate these findings, we assessed TCGA-PAAD data. Twelve per cent of PDACs in this dataset harbour MYC amplifications connected to reduced overall survival and disease-free survival (figure 1A). Using GSEA via the GeneTrail2 1.6 web service, which uses an unweighted GSEA methodology,27 we detected activation of the MYC network in MYC-amplified cancers (figure 1B). Following the concept that hyperactivity of the MYC network is connected to specific dependencies in PDAC,17 18 we analysed further pathways active in MYC-amplified cancers (online supplementary table S1). We detected significant enrichment of Reactome signatures linked to protein SUMOylation as well as curated core SUMO pathways in MYC-amplified PDACs (figure 1C,D). Since the SUMO pathway was found to be an MYC-associated dependency in an unbiased genome-wide genetic screen in human mammary epithelial cells (HMECs),28 an observation which could also be made in other neoplasms such as B-cell lymphomas,29 we explored the possibility that the SUMO pathway confers a vulnerability in PDAC with hyperactivity of MYC. SUMO modification of cellular proteins is an important post-translational modification (PTM) that regulates function, localisation, interaction and expression of proteins. PTM by SUMOs has been reported to play various important roles in tumourigenesis.30 Analogous to ubiquitination, SUMO1, SUMO2 or SUMO3 are transferred to lysine residues of proteins in a multistep catalytic process involving the E1 activating enzymes SUMO-activating enzyme subunit 1 (SAE1) and 2 (UBA2/SAE2), the E2 conjugating enzyme UBE2I (UBC9) and SUMO E3 ligases.30 31 Next-generation sequencing data26 demonstrated MYC amplifications as well as CNVs of the SUMO pathway genes SAE1 and UBE2I (figure 1E), furthermore underscoring the importance of both pathways in PDAC.
Supplemental material

MYC is connected to the SUMOylation pathway in PDAC. (A) genomic MYC amplification (23/183 cases, 12%) is correlated with inferior overall survival (OS) (median OS 15.11 vs 20.83 months; n=183; p=0.033) and disease-free survival in PDAC (median DFS 7 vs 17.28 months; n=141; p=0.003) (data are based on the TCGA-PAAD dataset). (B) Unweighted GSEA using gene Trail2 1.6 comparing MYC amplified and non-amplified PDACs. q values are depicted. (C, D) Unweighted GSEA using gene Trail2 1.6 reveals significant enrichment of gene sets involved in protein sumoylation within the MYC amplified PDAC subgroup. Enrichment analysis was performed for published Reactome pathways (C), SUMO is transferred from E1 to E2 (UBE2I, Ubc9); sumoylation of DNA replication proteins and manually curated core SUMO pathway gene sets (D), core SUMO pathway SAE1, UBA2, UBE2I; SUMO pathway and paralogs SAE1, UBA2, UBE2I, SUMO1, SUMO2, SUMO3. q values are depicted. (E) Published genomics data from whole exome sequencing of 109 microdissected pancreatic cancer cases26 demonstrates a tendency towards mutual exclusivity in genomic MYC and SUMO pathway components (SAE1, UBE2I) aberrations. GSEA, gene set enrichment analysis; PDAC, pancreatic ductal adenocarcinoma; SAE1, SUMO-activating enzyme subunit 1; SUMO, small ubiquitin-like modifier.
Relevance of the sumoylation pathway in PDAC
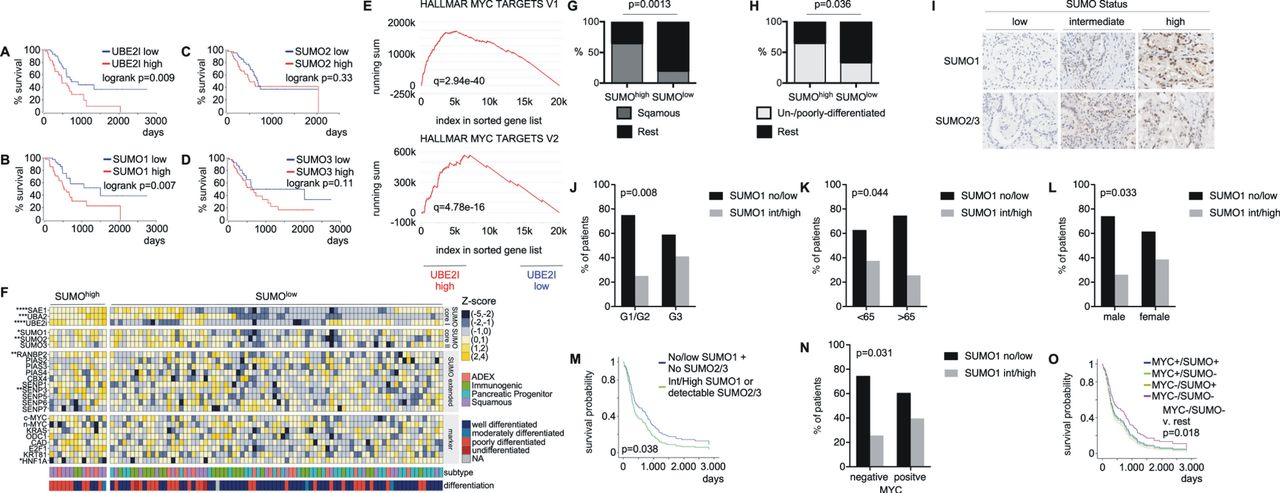
To further investigate the relevance of the SUMOylation pathway, we compared the expression profiles of 69 PDACs to 61 adjacent non-tumour tissue samples32 and observed an increased expression of the SUMO pathway components SAE1, UBE2I, SUMO1, SUMO2 and SUMO3 in PDAC (online supplementary figure S1A), underlined by a corresponding enrichment of SUMO-related gene sets in PDAC (online supplementary figure S1B). Analysing the TCGA clinical data set demonstrated that high expression of UBE2I is linked to a worse prognosis (figure 2A), an observation valid also for SUMO1 (figure 2B). The Kaplan-Meier curves for PDAC with high and low SUMO2 and SUMO3 mRNA levels are depicted in figure 2C,D. Comparing the UBE2I high and low groups by GSEA demonstrated the enrichment of MYC signatures in UBE2I high PDACs (figure 2E). MYC signatures were also detected in PDACs with high expression of SUMO1, SUMO2 and SUMO3 mRNA (online supplementary figure S1C), again corroborating the connection of both pathways. To further stress the significance of the core SUMOylation pathway for PDAC, we analysed an additional PDAC mRNA expression dataset from 96 patients,7 where we detected a human PDAC subtype with increased expression of core SUMO pathway genes (SUMOhigh) (figure 2F). Comparing the SUMOhigh subtype with the SUMOlow subtype by the GeneTrail2 demonstrated enrichment of MYC signatures (online supplementary figure S1D). A complete list of pathways active in the SUMOhigh subtype is listed in online supplementary table S2. Also in this human PDAC dataset, the SUMOhigh PDACs were characterised by decreased progression-free as well as overall survival (online supplementary figure S1E). PDAC subtyping efforts have shown the existence of several subtypes and squamous/basal-like/quasi-mesenchymal, classic/progenitor, immunogenic and aberrantly differentiated endocrine exocrine-subtypes were described, although not all of these subtypes were found to be stable/reproducible.33 The recurrently identified and therefore currently generally accepted squamous/basal-like/quasi-mesenchymal subtype carries the worst prognosis.5–8 10 12 SUMOhigh PDACs are characterised by an enrichment of squamous subtypes (figure 2F,G) and poorly or undifferentiated tumours (figure 2F, H).
Supplemental material
Supplemental material
Supplemental material

SUMOylation components are induced in PDAC and associated with adverse prognosis. (A–D) Transcriptomics data (TCGA-PAAD) was analysed for correlation of SUMO pathway component transcript levels and survival rates. Overall survival of patients with high expression of UBE2I, SUMO1, SUMO2 or SUMO3 mRNA (>75th percentile) was compared with overall survival of patients with low mRNA expression of these genes (<25th percentile). High expression of UBE2I and SUMO1 mRNA is significantly associated with decreased overall survival. P value of a logrank test is depicted. All survival curves were directly retrieved via the OncoLnc platform (http://www.oncolnc.org/) using the above defined thresholds. (E) Unweighted GSEA of UBE2I-high and low groups using gene Trail2 1.6 reveals significant enrichment of MYC hallmark target genes within UBE2I-high subgroup (thresholds defined in A–D). Q value is depicted. (F) Manual curation of a publicly available gene expression dataset of PDAC patients (n=96)7 was used to define a SUMO-high population, characterised by positive z-scores for SAE1, UBA2 and UBE2I (n=14). (G, H) SUMO high PDACs corresponding to 2F were analysed for association with tumour differentiation or subtype. (G) Enrichment of the squamous subtype and (H) enrichment of undifferentiated and poorly differentiated tumours in the SUMO high subtype. P values of a Fisher’s exact test are indicated. (I) Representative IHC staining of surgical PDAC specimen (n=262) with low, intermediate and high SUMO1 or SUMO2/3 expression. (J–L) Nuclear SUMO1 expression is significantly enriched in biologically aggressive G3 tumours as well as in younger patients, that is, <65 years of age and female patients. The P values of a Pearson's X2 test are depicted. G1: well differentiated, G2: moderately differentiated, G3: poorly differentiated PDAC. (M) Combined SUMO1 and SUMO2/3 nuclear expression as measured by IHC is correlated with an adverse prognosis in PDAC patients. The p value of a logrank test is shown. (N) MYC IHC was conducted in the above-described PDAC cohort. PDACs were grouped in tumours with positive and negative MYC staining and connected to the SUMO1 status. The p value of a Pearson's X2 test is depicted. (O) A multivariate analysis reveals a prognostically favourable subpopulation of patients with low MYC-/SUMO expression that exhibits the best clinical course (p=0.018, logrank) independent of initial Union for International Cancer Control (UICC) stage. GSEA, gene set enrichment analysis; IHC, immunohistochemistry; PDAC, pancreatic ductal adenocarcinoma; SEA1, SUMO-activating enzyme subunit 1; SUMO, small ubiquitin-like modifier.
To further substantiate the relevance of the SUMOylation pathway in PDAC, we analysed SUMO1, and SUMO2/3 expression in an additional human PDAC cohort (n=262) at the protein level using immunohistochemistry (IHC). Here, we observed PDACs with low, intermediate or high SUMO1 and SUMO2/3 expression (figure 2I). Consistent with the RNA expression-based analysis, the SUMO1-high phenotype was associated with less differentiated tumours (figure 2J). In addition, we detected a connection of high SUMO1 expression to younger patients (figure 2K) and female gender (figure 2L). Multivariate survival analysis demonstrated a connection of the SUMOylation pathway to reduced survival (figure 2M). To further demonstrate the connection of the SUMO pathway to MYC, we analysed MYC protein expression using IHC in the same cohort. MYC positive tumours were significantly enriched in the SUMO1 high phenotype (figure 2N). Furthermore, multivariate analysis reveals that survival of patients belonging to the MYClow/SUMOlow subtype is significantly better compared with all other subgroups (figure 2O). Together, mRNA and protein expression data in large human PDAC cohorts demonstrate that the SUMOylation pathway characterises a subset of poorly differentiated PDACs with a significant enrichment of squamous/basal-like tumours. Furthermore, a subset of PDAC coactivates the SUMO pathway and MYC.
MYC connects to the SUMOylation pathway in PDAC cells
To additionally analyse the connection of MYC to the SUMOylation pathway, we used human PDAC cell lines, where we detected a positive correlation of MYC mRNA with the expression of SUMO1 (p=0.01) and SUMO2 (p=0.09) mRNA (figure 3A). A positive correlation of the MYC mRNA to genes of the SUMO pathway was also detected in murine PDAC cell lines (online supplementary figure S2A). We quantified MYC protein expression in ten human PDAC cell lines (figure 3B,C). Higher MYC expression was connected to higher levels of total SUMO1 and SUMO2/3 conjugated proteins (figure 3D). To demonstrate the induction of the SUMO pathway by MYC in human PDAC cell lines, we used an MYC oestrogen receptor fusion protein (MYCER) in IMIM-PC1 cells (figure 3E), which express low levels of MYC (figure 3B,C). Activation of MYC by 4-OHT treatment induced the expression of classical MYC target genes including ODC1 and CAD (figure 3F). In RNA-seq experiments, we observed MYC signatures activated on 4-OHT treatment (figure 3G), demonstrating the anticipated activation of the MYC network. Signatures connected to the SUMO pathway were coactivated on 4-OHT treatment (figure 3H and online supplementary table S3). In addition to these gain-of-function data, we analysed RNA-seq data, in which MYC was potently inhibited in murine PDAC cells using a dominant-negative form of MYC, called OmoMYC.34 OmoMYC coinhibited the MYC network and signatures connected to the SUMO pathway (online supplementary figure S2B). In addition, we transduced murine PDAC cells with vectors driving the expression of GFP or MYC together with GFP (figure 3I,J). In GSEA of RNA-seq of these cells, we detected the activation of the MYC pathway (figure 3K) and signatures connected to SUMOylation (figure 3L). A slight increase in protein SUMOylation was observed in SUMO1 and SUMO2/3 western blots in MYC overexpressing cells (figure 3M). The GO_PROTEIN_SUMOYLATION signature contains the core SUMO pathway genes Sumo1-3, Sae1, Sae2/Uba2 and Ube2i, which were upregulated in MYC overexpressing PPT-53631 cells comparable to MYC target genes (figure 3N). Whether upregulation by MYC occurs directly or indirectly, is unclear and may vary with context. Together, across PDAC models and species, a functional connection of MYC to the SUMOylation machinery was observed, which supports the hypothesis of a specific vulnerability for inhibition of the SUMOylation pathway in MYC hyperactivated PDACs.
Supplemental material
Supplemental material
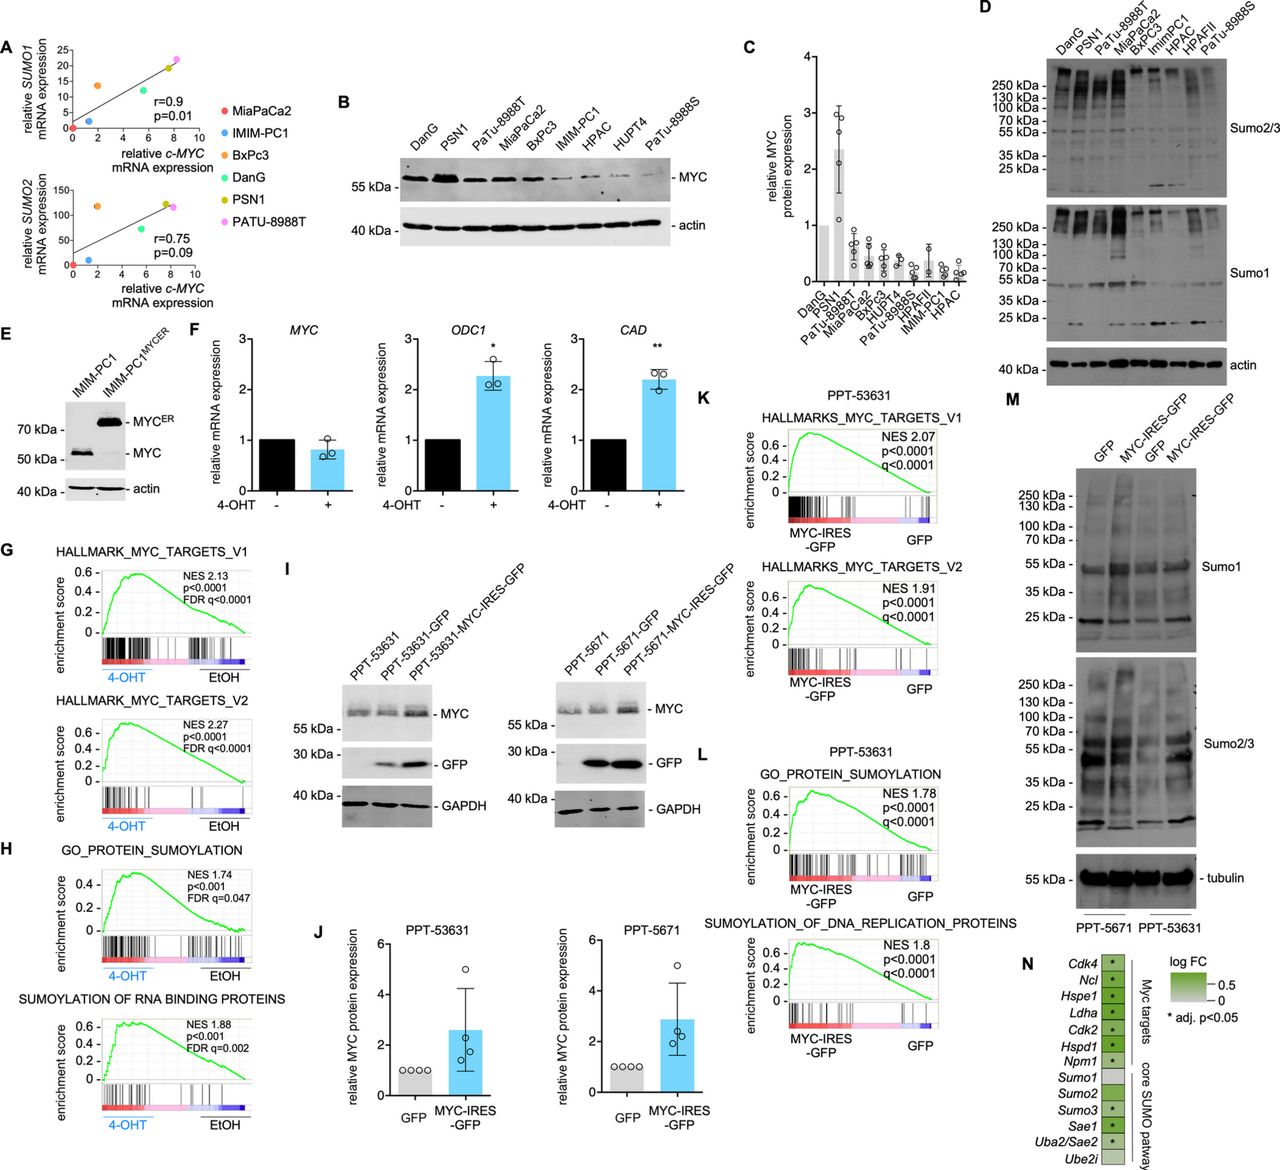
MYC activation induces SUMOylation pathway components. (A) SUMO1 and SUMO2 mRNA expression correlate with MYC expression across the depicted conventional human PDAC cell lines. Pearson R and p values are indicated. n=2; all biological replicates were performed as technical duplicates. (B, C) MYC protein expression quantification by Western blot in human PDAC cell lines. Actin: loading control. (B) Representative MYC Western blot; (C) Quantification of the MYC Western blots. Protein expression of MYC in DanG cells was arbitrarily set to 1. Each dot represents a biological replicate. HPAF-II cells are not included in the representative Western blot of (B). Shown is the mean±SD. (D) representative Western blots of SUMO1 and SUMO2/3 in human PDAC cell lines. Actin: loading control. (E) MYC Western blot of IMIM-PC1MYC-ER and IMIM-PC1 cells. Actin: loading control. (F) qPCR of MYC, ODC1 and CAD in IMIM-PC1MYC-ER cells. MYC downstream effectors ODC1 and CAD are induced 24 hours after the treatment of IMIM-PC1 with 4-OHT at 500 nM. n=3; all biological replicates were performed as technical duplicates. P value of a paired t-test.(G, H) GSEA of RNA-Seq data of IMIM-PC1MYC-ER treated for 24 hours with 4-OHT compared with vehicle controls. (I–M) The murine PDAC cell lines PPT-53631 and PPT-5671 were transduced with a GFP or an MYC-IRES-GFP vector. (I) MYC and GFP Western blot in parental, GFP-transduced and MYC-IRES-GFP-transduced cells. GAPDH: loading control. (J) Quantification of MYC expression corresponding to (I). Each circle represents quantification of a biological replicate. (K, L) GSEA of RNA-Seq data of GFP-transduced and MYC-IRES-GFP-transduced PPT-53631 cells. (M) Representative SUMO1 and SUMO2/3 Western blots of the indicated GFP-transduced and MYC-IRES-GFP-transduced cells; tubulin: loading control. (N) RNA-seq data of GFP-transduced and MYC-IRES-GFP-transduced PPT-53631 cells were analysed for the expression of Myc target genes and core SUMO pathway genes. Shown is the colour-coded log FC (fold change). mRNAs upregulated with an adjusted p<0.05 are marked by *. *P<0.05, **P<0.01. FDR, false discovery rate q value (GSE119423); 4-OHT, 4-hydroxytamoxifen; GSEA, gene set enrichment analysis; NES, Normalised Enrichment Score; PDAC, pancreatic ductal adenocarcinoma; SUMO, small ubiquitin-like modifier.
SUMO pathway inhibition induces G2/M phase arrest and apoptosis
To investigate whether the SUMOylation machinery is a relevant therapeutic target, we tested the activity of two small-molecule inhibitors of SAE. The selective SAE inhibitor ML-792 was demonstrated to inhibit SAE and SUMO-pathway activities.35 In breast, lung and colon cancer lines, ML-792 acts in an half-maximal effective concentration (EC50) range of 60–450 nM to inhibit cell viability.35 The dose–response curves measured with an MTT-viability assay of ML-792 in six human PDAC cell lines are shown in online supplementary figure S3A. The ML-792 half-maximal growth inhibitory (GI50) concentrations in the PDAC lines are higher than the ones described in breast, lung and colon cancer lines35 (online supplementary figure S3A). ML-93 is also a potent inhibitor of SAE, as measured in the ATP-inorganic pyrophosphate exchange assay, with a half-maximal inhibitory concentration of 37 nM when incubated with SUMO2, comparable to that reported for ML-792.35 Assessment of cellular activity and selectivity of ML-93, measured by means of thioester assays, demonstrated potent inhibition of SAE with a EC50 value of 1 nM for inhibition of the UBC9-SUMO thioester, and dose-dependent decrease in global SUMOylation (online supplementary figure S3B). In contrast, EC50 values for inhibition of UBC12 and UBC10 thioesters by ML-93 were both >5000 nM, demonstrating strong selectivity of ML-93 for inhibition of the SUMO pathway relative to the NEDD8 and ubiquitin pathways.
Supplemental material
ML-93 reduced growth (figure 4A) and clonogenic growth in the low nanomolar range (online supplementary figure S4A,B). In MiaPaCa2 and PSN1 cells, ML-93 increased the fraction of apoptotic cells in a dose-dependent and time-dependent manner (figure 4B). The apoptotic fraction is higher in MYC-amplified PSN1 cells. In MiaPaCa2 cells, ML-93 significantly reduced the fraction of cells in the G1 and S phases of the cell cycle with a distinct increase detected in the fraction of cells in the sub-G1 phase, demonstrating that apoptosis is a major contributor to the response (figure 4C). In addition, cells accumulated in the G2/M phase and we detected polyploidization on treatment with ML-93 (figure 4C). Loss of cells in the G1 phase of the cell cycle, polyploidization and induction of a sub-G1 population on treatment with ML-93 were also detected in PSN1 and PaTu-8988T cells (online supplementary figure S4C,D).
Supplemental material

SUMOylation inhibition targets an MYC-associated vulnerability.(A) Growth kinetics reveal dose-dependent and time-dependent reduction of cell growth under ML-93 treatment. PSN1 cells were treated with varying concentrations of ML-93 for the indicated time points. Viable cells, determined by trypan blue exclusion, were determined at the indicated time points and relative growth is depicted. All replicates (n=3) were performed as technical triplicates. (B) ML-93 induces apoptosis as measured by annexin V/PI flow cytometric analysis at low nanomolar concentrations after treatment periods of 24 hours, 48 hours and 72 hours. All replicates (n=3) were performed as technical triplicates. ANOVA. **p<0.01, ***p<0.001, ****p<0.0001. (C) ML-93 induces G2/M cell cycle arrest as demonstrated by PI cell cycle flow cytometry analyses. Shown are the proportions of cells in the sub-G1, G1, S and G2/M phases after ML-93 treatment for 24 hours and 48 hours. All replicates (n=3) were performed as technical triplicates. ANOVA: **p<0.01, ***p<0.001, ****p<0.0001. (D) The growth inhibitory concentration 50% (GI50) was determined in 17 human PDAC cell lines. ATP (CellTiter-Glo assay) was used as a surrogate to determine the dose response of a 7-point ML-93 dilution (0–1000 nM). Cells were treated for 72 hours. The assay was performed with at least three biological replicates conducted as technical triplicates. GI50 values >1000 nM were extrapolated from the fitted curve. (E) GI50 values of human PDAC lines with low and high MYC protein expression were compared. High expression: MYC protein expression >66th percentile; low expression: MYC protein expression <66th percentile (see figure 3C). *P value of an unpaired t-test <0.05. (F) GI50 for ML-93 and ML-792 was determined in 48 murine PDAC cell lines by MTT-assay. Determined was a dose response of 7-point dilution (ML-93: 0–1000 nM; ML-792: 0–5000 nM). Cells were treated for 72 hours. The assay was performed with at least three biological replicates conducted as technical triplicates. GI50 values >1000 nM for ML-93 and >5000 nM for ML-792 were extrapolated from the fitted curve. The Pearson correlation coefficient of ML-93 and ML-792 and the p values are depicted. Blue dots: ML-93 sensitive lines; red dots: ML-93 resistant lines. (G) MYC Western blot of the ML-93 sensitive and the ML-93 resistant murine PDAC cell lines. Actin: loading control. (H) Quantification of MYC expression in ML-93 sensitive and the ML-93-resistant murine PDAC cell lines, corresponding to (G). Mean MYC expression of three different lysates for each line, each normalised to actin. *P value of an unpaired t-test <0.05. (I) Unweighted GSEA analysis using the GeneTrail2 platform of SUMO inhibitor sensitive and resistant murine PDAC cell lines. Sensitive lines: common lines for which the ML-93 and the ML-792 GI50 values were <25th percentile. Resistant lines: common lines for which the ML-93 and the ML-792 GI50 values were >75th percentile. Q-value is depicted. (J) Loss of fitness scores were derived from the project score database (https://score.depmap.sanger.ac.uk/). Shown is the correlation of the scores for MYC and UBE2I in 23 human PDAC cell lines. The Pearson correlation coefficient and the p value are depicted. (K) Competitive repopulation assay. PPT-53631 and PPT-5671 cells transduced with a GFP or MYC-IRES-GFP vector were cocultured with corresponding wild type cells in a 20:80 ratio on D0. The proportion of GFP positive cells was tracked and reassessed on D5 by flow cytometry. The relative fold change was measured as the relative difference in the fraction of GFP positive cells on D5 versus baseline (d0). ML-93 (500 nM) treatment groups were normalised to the corresponding dimethylsulfoxide (DMSO)-treated controls and are depicted relative to all measured cells. All biological replicates (PPT-53631: n=3; PPT-5671: n=4) were performed as technical duplicates. P value of an unpaired t-test **<0.01, **<0.001. (L) Murine PPT-53631 or PPT-5671 PDAC cells, transduced with GFP or MYC-IRES-GFP vectors were treated with 50, and 500 nM ML-93 for 72 hours. The fraction of apoptotic cells was determined by annexin V/DAPI flow cytometric analysis. All annexin V positive and DAPI negative cells were rated as apoptotic. Four independent experiments are shown and each experiment is depicted as a circle. P value of an unpaired t-test **<0.01; *<0.05. (M) Quantification of clonogenic assays in parental, GFP or MYC-IRES-GFP vector transduced murine PPT-53631 and PPT-5671 PDAC cell lines. Cells were treated with the indicated ML-93 doses. Assay was performed with at least three biological replicates in technical duplicates. P value of an unpaired t-test: *<0.05, **<0.01, ****<0.0001. ANOVA, analysis of variance; GSEA, gene set enrichment analysis; PDAC, pancreatic ductal adenocarcinoma; SUMO, small ubiquitin-like modifier.
Pathways modulated on SUMOi and efficacy in MYC hyperactivated PDAC
To monitor inhibition of the pathway, we determined SUMOylation of the known SUMO substrate RanGAP1 in PaTu-8988T cells.36 RanGAP1 is completely SUMOylated in PaTu-8988T cells and ML-93 induced the appearance of un-SUMOylated RanGAP1, demonstrating on-target activity (online supplementary figure S5A). RNA-seq of ML-93 treated PaTu-8988T cells showed that SUMOylation signatures were depleted (online supplementary figure S5B). To find pathways coinhibited by ML-93, we analysed RNA-seq data of three ML-93 treated human PDAC cell lines. Transcriptomic changes observed on ML-93 treatment were rather small and highly context dependent (online supplementary figure S5C). Also, pathways connected to ML-93-regulated genes varied with context (online supplementary figure S5D). Online supplementary figure S5E demonstrates MSigDB-derived hallmark signatures associated with ML-93 regulated genes, which were detected in all analysed cell lines. In addition to transcriptomics, we analysed ML-93-induced changes in protein expression on a global scale. Again, changes observed in the proteome analysis were rather moderate (online supplementary figure S5F).
Supplemental material
To analyse the connection of SUMOi sensitivity to MYC activity, we used a large panel of human and murine PDAC cell lines. We determined GI50 values in 17 human conventional PDAC lines (figure 4D), and observed a distinct heterogeneity in the responsivity. Although MYC protein expression in whole cell lysates does not necessarily correlate with MYC’s overall transcriptional activity, a consideration recently described in PDAC models,21 human PDAC lines with higher MYC protein expression demonstrated activation of the MYC transcriptional network in GSEA (online supplementary figure S6A). These lines were characterised by significantly lower GI50 values (figure 4E). To validate our findings across different species, we used a KrasG12D - and PI3K/p110H1047R -driven murine PDAC cell line collection37 38 and determined the GI50 values of ML-93 and ML-792 in 48 lines. GI50 values of ML-792 and ML-93 showed a significant correlation (figure 4F). We next investigated the connection of MYC with the sensitivity towards SUMOi at several levels. First, we analysed MYC protein expression in the most ML-93 sensitive (marked in blue in figure 4F) to the most resistant murine PDAC lines (marked in red in figure 4F). Murine ML-93 sensitive lines demonstrate higher MYC protein expression (figure 4G, H). In addition, we analysed RNA-seq data.38 We defined murine PDAC lines which were sensitive or resistant to both SUMOi. Again, we observed an MYC signature in the sensitive cell lines (figure 4I). Third, we correlated the expression values of all transcripts of the murine expression dataset with the GI50 values for ML-792 and ML-93, determined Pearson correlation coefficients, and used these as a rank to run a preranked GSEA. Among the HALLMARK signatures associated with GI50 negatively correlated genes, both MYC HALLMARK signatures were detected (online supplementary figure S6B,C). Beyond demonstrating the correlation of MYC to SUMOi sensitivity, we used mechanistic data and models to functionalise the connection. We used the Project Score database (https://score.depmap.sanger.ac.uk/), which is based on a functional CRISPR/Cas drop-out screen.39 The loss of fitness scores for MYC and UBE2I in 23 human PDAC cell lines were compared. A significant correlation of both scores was observed (figure 4J), supporting the notion, that MYC-addicted lines are coaddicted to the SUMO pathway. To further substantiate the finding that the SUMO pathway is an MYC-associated dependency, we used isogenic murine PDAC models. Such isogenic models are appropriate to find and define genotype-specific drug responses.40 First, we used the MYC-IRES-GFP transduced cell lines PPT-53631 and PPT-5671 to perform a repopulation assay, allowing to monitor ‘MYC-high’ and ‘MYC-low’ population dynamics over time. Compared with GFP-transduced controls, MYC overexpressing cells showed a significant growth disadvantage under ML-93 treatment (figure 4K). Furthermore, a higher fraction of apoptotic cells was observed in MYC-transduced cells on SUMOi (figure 4L) and ML-93-dependent clonogenic growth inhibition was augmented by ectopic MYC expression (figure 4M). To further substantiate these findings, we used conditional MYC overexpression. First, murine PDAC lines were transduced with an MYCER coding vector (online supplementary figure S7A,B) and the response to ML-93 was measured in the presence (MYC on) or absence (MYC off) of 4-OHT. In all investigated models, the ML-93 dose response was shifted to the left in the presence of 4-OHT (online supplementary figure S7C), indicating a higher sensitivity. In PPT-53631 cells, mock transduced with the empty vector, 4-OHT does not change the ML-93 dose response, demonstrating a specific MYC effect (online supplementary figure S7C, far right panel). Also in clonogenic assays, the SUMOi response was augmented by activation of MYC (online supplementary figure S7D,E). To cross-species validate these findings, we used human IMIM-PC1MYCER cells. Again, the dose response of both SUMOi was shifted to the left (online supplementary figure S7F), demonstrating that MYC hyperactivation generates a vulnerability which can be exploited through SUMOi. To extend this note to the genetic level, we used Ube2i RNA interference in MYC overexpressing models. However, due to a distinct counterselection, we were not able to achieve a meaningful knock-down. In an assumption that SUMOi resistant cells will better tolerate the Ube2i knock-down, we transduced such a cell line with an MYCER vector (online supplementary figure S7G,A). However, also here, only one of the tested shRNAs induced a Ube2i knockdown to approximately 50% compared with control (online supplementary figure S7H). Despite this modest knock-down, activation of MYC by 4-OHT is less tolerated in Ube2i-depleted cells, underscoring the connection of both pathways (online supplementary figure S7I).
Supplemental material
Supplemental material
SUMOi sensitivity in human PDAC ex vivo and in vivo models
To elucidate first evidence for in vivo activity of ML-93, we used xenograft transplantation models. First, we determined in vivo toxicity of ML-93 in C57BL/6 mice (online supplementary figure S8A). No significant change in body weight (online supplementary figure S8B), haemoglobin concentration, white blood cells or platelets counts were detected (online supplementary figure S8C). SUMO2/3 western blots of splenocyte protein lysates demonstrated on-target activity (online supplementary figure S8D,E). Of note, only in immunodeficient mice, we observed ML-93-induced skin irritation and ulceration at the injection site. To investigate activity of ML-93 against PDAC in vivo, we transplanted PaTu-8988T cells s.c. into immunocompromised NOG mice and treated tumor-bearing mice with ML-93 (figure 5A). Growth of PaTu-8988T xenografts was inhibited by ML-93 (figure 5B,C). To monitor inhibition of the pathway in vivo, we determined again SUMOylation of RanGAP136 (figure 5D) and observed reduced SUMOylation of RanGAP1 (figure 5E). In addition to PaTu-8988T, we tested ML-93 in PSN1, HuPDAC7, BxPc3 and IMIM-PC1 in vivo models (online supplementary figure S8F-J). Although the proliferation index was reduced by ML-93 in the PSN1 in vivo model, tumour growth was not altered in any of the investigated models in the limited-duration treatment schedule used.
Supplemental material

SUMOylation inhibition in human PDAC ex vivo and in vivo models. (A–E) The human PDAC cell line PaTu-8988T was used to generate murine xenograft models in NOG mice. (A) Mice were treated with 50 mg/kg ML-93 intravenously on d1,2 and d8,9 and (B) tumour size was measured over time. (C) Tumour size at D31 of ML-93-treated PaTu-8988T-derived xenograft mice revealed significant reduction in tumour size in treated mice (n=5 mice in each group). Statistical significance was assessed using an unpaired Student’s t-test. *P<0.05. PaTu-8988T tumours were treated with 50 mg/kg ML-93 intravenously on D1, 2 (D). Two days after the first injection (d3), tumours were harvested and proteins were analysed for sumoylated and un-SUMOylated RanGAP1 by Western blot (E). Tumour lysates of two vehicle-treated and two ML-93-treated animals were analysed tubulin: loading control. (F) Primary-dispersed human PDAC cells, HuPDAC3, HuPDAC7, HuPDAC17, were analysed for MYC expression by Western blotting; tubulin: loading control. (G) SUMO1 and SUMO2/3 Western blots of the indicated cell lines; tubulin: loading control. (H) Primary-dispersed human PDAC cells, HuPDAC3 and HuPDAC7 were analysed for the mRNA expression of MYC, CAD, ODC1, HSPE1 (MYC pathway) and SUMO1, SUMO2, SUMO3, SAE1, SAE2, UBE2I (SUMO pathway). mRNA expression was normalised to GAPDH and the mRNA expression in HuPDAC7 was arbitrarily set to 1. Shown is the mean±SD of three independent experiments performed as technical triplicates. (I) GI50 for ML-93 and ML-792 was determined in HuPDAC3, HuPDAC7, HuPDAC17 cells using CellTiter-Glo assay. A 7-point dilution (ML-93: 0–1000 nM; ML-792: 0–5000 nM) was used and cells were treated for 72 hours. The assay was performed with at least three biological replicates conducted as technical triplicates. GI50 values >1000 nM for ML-93 and >5000 nM for ML-792 were extrapolated from the fitted curve. (J, K) Clonogenic assay of HuPDAC3, HuPDAC7, HuPDAC17 cells treated with the indicated doses of ML-93 or vehicle. (E) Representative experiment is depicted; (F) Quantification of the clonogenic assay. Shown is the mean±SD of at least three biological replicates performed as duplicates. (L) Human HuPDAC3 and HuPDAC7 cells were treated with ML-93 (500 nM) or were left as vehicle treated controls. After 72 hours, the fraction of apoptotic cells was determined by annexin V/PI flow cytometric analysis. All annexin V positive and PI negative cells were rated as apoptotic. Shown is the fold induction determined as the relative increase in the apoptotic fraction versus DMSO control after 72 hours of treatment with ML-93. Three independent experiments performed as technical triplicates are shown and each experiment is depicted as a circle. P value of an unpaired t-test *<0.05; **<0.01. GI50, growth inhibitory; i.v., intravenous; PDAC, pancreatic ductal adenocarcinoma; SUMO, small ubiquitin-like modifier.
To investigate the connection of MYC with the sensitivity towards SUMOi in primary human ex vivo models, we used patient-derived organoids (PDOs) and primary-dispersed human PDAC cell lines. PDOs are 3D models suitable to evaluate clinically relevant therapeutic vulnerabilities.41–43 Consistent with the two-dimensional cultures, ML-93 was found to inhibit viability in the double-digit nanomolar range in three out of four of the investigated PDO models, whereas one PDO completely resisted ML-93 treatment (online supplementary figure S9A). Although the moderate number of organoids analysed clearly limits the informative value, the resistant PDO showed the lowest MYC mRNA expression (online supplementary figure S9B). Such observations underscore the requirement to stratify patients for SUMO pathway targeting drugs. Complementary to PDO models, we used primary-dispersed human PDAC cell lines. We first analysed the MYC expression and SUMO status in three lines and observed a gradual increase in MYC protein expression from HuPDAC3, to HuPDAC17 and HuPDAC7 (figure 5F and online supplementary figure S9C). Gradual increase in MYC expression is correlated to an increase in SUMO1 and SUMO2/3 modified proteins (figure 5G). MYC target genes and SUMO-pathway genes showed lower expression at the mRNA level in HuPDAC3 cells (figure 5H), demonstrating that the MYC/SUMO ‘high’ subtype we described in PDAC, was recapitulated by the primary-dispersed human PDAC cell lines. Importantly, the MYC/SUMO expression status is connected to the sensitivity towards SUMOi as demonstrated by different GI50 values and inhibition of clonogenic growth (figure 5I–K; online supplementary figure S9D). Consistently, the fraction of apoptotic cells was higher in HuPDAC7 cells on SUMOi compared with the line with low MYC expression (figure 5L).
Supplemental material
Discussion
The ability to target molecularly defined tumour subtype-specific drivers is a successful strategy and has changed the standard of care in solid tumour entities. Although the existence of different subtypes in PDAC is undisputed, therapeutically exploitable subtype-specific drivers and resulting dependencies were so far unknown for the majority of patients. In this study, we provide for the first-time evidence for the existence of a PDAC subtype characterised by the coactivation of the MYC and SUMO pathways and connected to a worse prognosis. We detected an enrichment of tumours coactivating MYC and SUMO in the basal-like/squamous subtype of the disease, a subtype especially resistant to chemotherapies.15 16 We show a mechanistic relationship of the MYC oncogene to the SUMOylation machinery in PDAC and provide evidence that MYC hyperactivation increases the sensitivity to SUMO pathway inhibition.
One strategy to target MYC is to identify synthetic dosage lethal interactions associated with hyperactivity of this transcription factor.17 18 20 The utility of such a concept is underscored by the results of a genome-wide shRNA MYC synthetic lethality screen in HMECs, where SUMOylation pathway members, including SAE2/UBA2, SAE1 or UBE2I, were defined as synthetic lethal MYC interactions.28 Additionally, UBE2I was detected in an MYC synthetic lethal screen in human foreskin fibroblasts,44 demonstrating the robust synthetic lethal relationship of MYC and the SUMO pathway. Genetic interference with the SUMOylation pathway in the MYC hyperactive state induced an accumulation of the cells in the G2/M-phase of the cell cycle, polyploidization and subsequent apoptosis.28 29 At the pharmacological level, the selective SAE inhibitor ML-792 phenocopies the genetic inhibition of the SUMOylation pathway and acts preferentially in MYC hyperactive states.35 Consistent with the above-mentioned data, we detected that ML-93, which shows a higher efficacy in cell-based PDAC models, acts in the nanomolar range, induced accumulation of cells in the G2/M phase, polyploidy and apoptosis. Furthermore, we provide multiple evidences for a preferential efficacy of ML-93 in MYC-hyperactivated PDACs. It has been described that MYC primes for sensitivity towards antimitotic drugs acting in the G2/M phase of the cell cycle,45 especially in the context of mutant KRAS,46 a ubiquitous genetic lesion in PDAC. In addition, genes relevant for mitotic control are enriched among MYC synthetic lethal genes,28 44 furthermore supporting the observation that MYC hyperactivation induces a vulnerability in this particular cell cycle phase. Congruently, the SUMO pathway is necessary for cell division and regulates mitotic chromosome structure, kinetochores, mitotic progression, chromosome separation and cytokinesis,47 explaining the synthetic lethal interaction of the SUMO pathway with MYC.
Although we detected a coexpression of MYC and SUMO in a PDAC subtype, it is important to note that especially in the IHC analysis there was evidence for an active SUMO pathway, measured as nuclear expression of SUMO1, that was also detected in PDAC with low MYC expression. The molecular drivers in this setting remain elusive so far. Vice versa, MYC positive PDAC with no activation of the SUMO pathway do also exist. In breast cancers, the SUMO pathway enzymes SAE1 and SAE2 mark a patient population with particular worse prognosis only in the MYC high subtype,28 an effect we did not observe in PDAC using SUMO proteins as discriminators. Such observations point to the complexity and context specific regulation of the MYC network. Here, MYC cofactors can add to the complexity and the understanding of the network. For example, the ATP-dependent nucleosome-remodelling factor component bromodomain PHD transcription factor BPTF was demonstrated to be necessary for the control of an MYC subnetwork in pancreatic cancer.48 Such considerations might also implicate that the association of hyperactive MYC to one particular transcriptome-defined PDAC subtype is less strict than anticipated and the net MYC activity is modulated by coexpression of cofactors and synthetically lethal interactors, a note recently described across human cancers.49 The demonstration that MYC is central to plasticity processes in PDAC models,50 might furthermore underscore the need for MYC in diverse cellular states and phenotypes.
Despite multiple evidence for the synthetic lethal interaction of MYC and SUMO pathways, only one out of three MYC ‘high’ models responded to SUMOi in vivo. This phenomenon might be explained at several levels. Clear evidence, including the recent VIKTORY umbrella trial in gastric cancer,51 demonstrates that biomarker-driven patient selection to targeted therapies is successful. However, despite the presence of the marker, only a fraction of patients responds to the targeted intervention. This implicates that the biology associated with a particular marker must be analysed and understood in greater and mechanistic detail. Furthermore, two or more markers might increase the precision to select therapies in solid cancers, a note underscored by large cell-based screening efforts.52 The observation that PSN1 cells react in vivo with a trend for reduced proliferation and increased caspase activity shortly after the SUMOi application, but SUMOi does not reduce tumour burden, might suggest that alternative treatment schedules should be tested to increase the efficacy of the treatment. Slow growth and small size of the investigated in vivo models might also impact on the efficacy. Furthermore, due to the ML-93-induced skin irritation and ulceration at the injection site observed in immunodeficient mice, we were not able to investigate extended treatment regimens. Other explanations include problems of bioavailability of drugs and resistance mechanisms that are initiated in vivo. Several promising anticancer drugs, such as proteasome inhibitors, HDAC inhibitors, heat-shock protein inhibitors and mitotic inhibitors, are potent in vitro but exhibit limited efficacy in solid cancers models in vivo. Reduced oxygen tension, metabolic supply, translation rate (and hence proteotoxic stress) and rate of proliferation of cell lines growing in vivo can be attributed to explain the discrepancy.53–56 Lastly, dual or triple combinations of targeted therapies are successfully used in the clinic. For BRAF-mutated melanomas, dual targeting of the driver pathway with an RAF and an MEK-inhibitor is FDA approved.57 In a recent safety lead-in analysis of the BEACON phase III clinical trial for BRAF mutant colorectal cancer promising efficacy of a triple targeted therapy with raf proto-oncogene, serine/threonine kinase (RAF), mitogen-activated protein kinase kinase (MEK) and epidermal growth factor receptor (EGFR)-inhibitors was observed.58 Such data suggest to develop SUMOi-based combination therapies by an unbiased pharmacological screening experiment to exploit MYC synthetic dosage lethality by a multiple-targeting approach.
We provide clear rationale for the future development of SUMOylation inhibitor-based therapies for a PDAC subgroup with coactivation of the SUMO pathway and MYC. This particular PDAC population is characterised by an aggressive disease, poor prognosis and the current lack of clear treatment options. Therefore, our study represents an important step in establishing SUMOi-based therapy as a potential approach to target an extremely dismal PDAC subtype.
Acknowledgments
ML-792 and ML-93 was provided by Millennium Pharmaceuticals, a wholly owned subsidiary of Takeda Pharmaceutical Company. We thank Jessica Riceberg for contributing to this work by generating the thioester western blot, Sofia Stenqvist for excellent assistance for the in vivo experiments and Denis Huszar (Takeda) for critical reading the manuscript. Part of the results shown here is based on data generated by the TCGA Research Network: https://cancergenome.nih.gov.
Supplementary materials
Supplementary Data
This web only file has been produced by the BMJ Publishing Group from an electronic file supplied by the author(s) and has not been edited for content.
Footnotes
GS and UK are joint senior authors.
AB, ZH, CS and MS are joint first authors.
Contributors Conception and design of the study: AB, ZH, MS, CS, MW, GS and UK. Acquisition of data and/or analysis and interpretation of data: AB, ZH, LS, MS, YH, GS, JS, AS, LN, WW, ZD, CS, KS, LS, H-PL, AC, FO, JS, KS, DS, MS, RR, WW, JN, MR, GS and UK; Drafting of the manuscript: AB, ZH, CS, MS, GS and UK. All authors revised the manuscript for important intellectual content and approved the final version submitted for publication.
Funding This work was supported by the Wilhelm-Sander Foundation (2017.048.1 to UK and GS), Deutsche Forschungsgemeinschaft (DFG) (SFB824/C3 and SFB1335/P3 to UK, SFB824/C9 to GS and DS, SFB1321/S01 to WW, KS, MR, DS, RR, GS and SCHN959/3-1 to GS), Deutsche Krebshilfe (111273 (Max-Eder Program) to MR, 111944 to UK), Else-Kröner-Fresenius-Stiftung (2016_A43 to MW), Stiftung Charité (to UK) and DKTK Joint Funding to RR, WW, DS and GS).
Competing interests SL is an employee of Takeda Pharmaceutical Company.
Patient consent for publication Not required.
Ethics approval The primary human PDAC models were established and analysed in accordance with the Declaration of Helsinki and were approved by the local ethical committee (Project 207/15, 1946/07 and 330/19).
Provenance and peer review Not commissioned; externally peer reviewed.
Data availability statement Data are available in a public, open access repository.
Transcriptomic Data, NCBI Geo, freely available:
GSE119423 / PRJNA489233 https://www.ncbi.nlm.nih.gov/geo/query/acc.cgi?acc=GSE119423
Transcriptomic Data, ENA, freely available: PRJEB34637 https://www.ebi.ac.uk/ena/data/view/PRJEB34637
Proteome Data, ProteomeXchange, PRIDE database, freely available:PXD011347 http://www.ebi.ac.uk/pride/archive/projects/PXD011347.