Article Text

Abstract
Objective Endoscopic mucosal biopsies of primary gastric cancers (GCs) are used to guide diagnosis, biomarker testing and treatment. Spatial intratumoural heterogeneity (ITH) may influence biopsy-derived information. We aimed to study ITH of primary GCs and matched lymph node metastasis (LNmet).
Design GC resection samples were annotated to identify primary tumour superficial (PTsup), primary tumour deep (PTdeep) and LNmet subregions. For each subregion, we determined (1) transcriptomic profiles (NanoString ‘PanCancer Progression Panel’, 770 genes); (2) next-generation sequencing (NGS, 225 gastrointestinal cancer-related genes); (3) DNA copy number profiles by multiplex ligation-dependent probe amplification (MLPA, 16 genes); and (4) histomorphological phenotypes.
Results NanoString profiling of 64 GCs revealed no differences between PTsup1 and PTsup2, while 43% of genes were differentially expressed between PTsup versus PTdeep and 38% in PTsup versus LNmet. Only 16% of genes were differently expressed between PTdeep and LNmet. Several genes with therapeutic potential (eg IGF1, PIK3CD and TGFB1) were overexpressed in LNmet and PTdeep compared with PTsup. NGS data revealed orthogonal support of NanoString results with 40% mutations present in PTdeep and/or LNmet, but not in PTsup. Conversely, only 6% of mutations were present in PTsup and were absent in PTdeep and LNmet. MLPA demonstrated significant ITH between subregions and progressive genomic changes from PTsup to PTdeep/LNmet.
Conclusion In GC, regional lymph node metastases are likely to originate from deeper subregions of the primary tumour. Future clinical trials of novel targeted therapies must consider assessment of deeper subregions of the primary tumour and/or metastases as several therapeutically relevant genes are only mutated, overexpressed or amplified in these regions.
- gastric cancer
- endoscopy
- molecular pathology
- histopathology
Data availability statement
All data relevant to the study are included in the article or uploaded as supplementary information. Data are available upon reasonable request: Please contact PI Heike Grabsch.
This is an open access article distributed in accordance with the Creative Commons Attribution Non Commercial (CC BY-NC 4.0) license, which permits others to distribute, remix, adapt, build upon this work non-commercially, and license their derivative works on different terms, provided the original work is properly cited, appropriate credit is given, any changes made indicated, and the use is non-commercial. See: http://creativecommons.org/licenses/by-nc/4.0/.
Statistics from Altmetric.com
Significance of this study
What is already known on this subject?
Tumour heterogeneity of gastric cancer (GC) has been proposed as a major hurdle to developing novel targeted therapeutics.
Genomic differences between primary and metastatic tumour sites have been reported as a potential barrier for precision oncology.
Several previous studies have confirmed intertumoural heterogeneity in GC.
What are the new findings?
We studied intratumoural spatial heterogeneity in GC by annotating superficial and deep subregions of the primary tumour as well as tumour in matched lymph node metastasis (LNmet) from GC resection specimens.
By performing phenotypical, genomic and transcriptomic profiling, we found superficial subregion profiles to be significantly different compared with matched deep subregions and LNmet. At the same time, profiles of matched deep subregions and metastatic lymph nodes exhibited greater similarity.
Several therapeutically targetable genes were amplified, mutated and/or overexpressed in the deep subregions and/or LNmet but not in the superficial subregions.
How might it impact on clinical practice in the foreseeable future?
Multiple superficial endoscopic biopsies are unlikely to reflect the whole breadth of intratumoural heterogeneity in GC.
Future clinical trials of novel targeted therapies must consider assessment of the deeper subregions of the primary tumour and/or metastases.
New understanding of the biology of metastatic dissemination of GC will allow advances in drug discovery and treatment.
Introduction
Gastric cancer (GC) is a leading cause of mortality and morbidity worldwide.1 Targeting of specific cancer-associated driver genes has improved outcomes in patients with lung, breast or colorectal cancer.2–6 However, similar approaches have only proved modestly successful in patients with GC. Tumour heterogeneity has been proposed as a major hurdle to developing novel therapeutics for patients with GC.7 While intertumoural heterogeneity (ie, between patients) has been described in GC in some detail,8 9 intratumoural heterogeneity (ITH) (ie, within the same patient) is less well studied. Genomic differences between primary and metastatic GC sites have been recently reported as a potential barrier for precision oncology.10 Clinically, cancer diagnosis and treatment choices are usually made by evaluation of endoscopic biopsies taken from the luminal aspects of the primary tumour (‘superficial mucosa’). In contrast, material from deeper tumour regions or metastatic sites such as regional lymph node metastasis (LNmet) or distant metastasis is often not easily accessible and therefore usually not investigated at the time of diagnosis.
In this study, we hypothesised that luminal and deep subregions of primary GCs exhibit systematic differences in cancer-related genes and pathways, and that these differences might also relate to the molecular profiles of patient-matched lymph node metastases. To investigate this, we adopted a multiassay strategy to profile various regions from primary GCs and matched lymph node metastases at the genomic, transcriptomic and histomorphological (phenotypic) levels.
Methods
Patient samples
This cohort included patients diagnosed with gastric adenocarcinoma who underwent potentially curative surgery at the Department of Surgery, Leeds Teaching Hospital NHS Trust (Leeds, UK) between 1985 and 2003. Patients were included in the study if the adenocarcinoma invaded at least the muscularis propria, and lymph node metastases with sufficient tumour for RNA and DNA extraction were present. None of the patients underwent perioperative chemotherapy. Clinical and pathological data were retrieved from histopathology reports, electronic patient hospital records and the Northern and Yorkshire Cancer Registry.
Representative Haematoxylin/Eosin (H&E) stained sections from the resection specimen were scanned using an Aperio slide scanner (Aperio XT; Aperio Technologies, Vista, California, USA), reviewed, and multiple subregions were manually delineated in the primary tumour: two adjacent luminal subregions (primary tumour superficial (PTsup1) and PTsup2) extending up to 2 mm deep into the mucosa/superficial submucosa approximately equivalent to the depth that is reached by endoscopic biopsy, one deep tumour subregion (primary tumour deep (PTdeep)) extending from 2 mm depth to the deepest point of tumour infiltration in the wall. The median size of the individual superficial region was 35 mm2, which is equivalent to the amount of tissue that can be obtained from approximately eight endoscopic biopsies. In addition, tumour was outlined in the lymph node with the largest contiguous metastatic tumour area (LNmet) (figure 1).

Pathology selection of tumour subregions. Blocks with highest tumour content per area were selected from the resection specimen and subregions were manually delineated in the primary tumour by a pathologist: two adjacent luminal subregions (PTsup1 and PTsup2) extending approximately 2 mm deep into the mucosa/superficial submucosa equivalent to the depth that is reached by endoscopic biopsy, one deep tumour subregion (PTdeep) extending from 2 mm depth to the deepest point of tumour infiltration in the wall. The median size of the individual superficial region was 35 mm2, which is equivalent to the amount of tissue that can be obtained from approximately eight endoscopic biopsies. In addition, tumour was outlined in the lymph node with the largest contiguous metastatic tumour area (LNmet). Cytokeratin-stained images are provided in this figure for illustrative purposes only to facilitate visualisation of tumour cells (3,3'-diaminobenzidine (DAB) brown). LNmet, lymph node metastasis; PTdeep, primary tumour deep; PTsup, primary tumour superficial.
Histomorphological phenotype classification
The histological phenotype of all cases was classified by a pathologist without knowledge of associated clinicopathological information or results from RNA/DNA investigations. Every subregion (PTsup1, PTsup2, PTdeep and LNmet) was assessed for the presence of three main histological phenotypes: poorly cohesive, non-poorly cohesive and mucinous phenotypes. For poorly cohesive cancers, the presence of signet-ring cells was recorded according to the recently published consensus as <10%, 10%–90% or ≥90% signet-ring cells.11 Signet-ring cells were defined as cells with an eccentric nucleus and optically clear cytoplasmic mucin on the H&E-stained slides.
Quantification of tumour and stroma content per subregion
The tumour and stroma content was quantified in all cases for each primary tumour subregion and LNmet separately using the same tissue section and the same outlines as used for DNA and RNA extractions. The stereology tool in the MIM software (HeteroGenius, Leeds, UK) was used to take a random systematic sample of 300 points per subregion as described previously.12 The tissue category (tumour epithelium vs stroma (anything in between epithelial tumour cells) vs non-informative (normal epithelium, artefacts and non-interpretable tissue)) was determined for every point. The tumour:stroma ratio per subregion was calculated by dividing the number of tumour points by the number of stroma points.
DNA and RNA extraction
DNA and RNA were extracted from the subregions separately. DNA was extracted using the QIAmp DNA Micro Kit (Qiagen, Hilden, Germany) as previously described.13 DNA concentration was measured by ND-100 Spectrophotometer (Labtech International) and samples were diluted using Tris-EDTA buffer. RNA was extracted using the Qiagen RNeasy Kit (Qiagen) according to the instructions of the manufacturer.
NanoString analysis
The ‘PanCancer Progression Panel’ NanoString nCounter Reporter CodeSet (Nanostring Technologies, USA) was used for this study. This panel includes 770 genes covering a range of cancer-related pathways, including angiogenesis, extracellular matrix (ECM) remodelling, epithelial-to-mesenchymal transition and metastasis (online supplemental table S1). Pathway annotations were based on NanoString panel designation, which was curated from publicly available data sources.14–16 Raw counts were normalised using the geometric mean of the internal positive control probes included in the CodeSet using the vendor-provided nCounter software (nSolver). ITH was quantified by calculating the arithmetic mean of the standard deviation (SD) of gene expression between subregions per gene for each tumour. GCs with mean SD>50th centile were classified as ITHhigh, all others were classified as ITHlow.
Supplemental material
Supplemental material
Quantitative reverse transcriptase-PCR (qRT-PCR) validation of NanoString transcriptomic findings was performed for selected genes (TGFB, CLDN4, CDH1, FGF18 and CEACAM6) using RNA extracted from the different tumour subregions. One-step qRT-PCR was performed using the KAPA SYBR FAST One step universal kit (Sigma, Thermofisher USA) and gene-specific primers (sequences shown in online supplemental table S2). Triplicate runs were performed from each subregion. To calculate fold changes of gene expression between subregions, the delta–delta cycle threshold (ΔΔCT) method was used.17 GAPDH was used as endogenous control for normalisation. Comparisons for ΔΔCT were made using LNmet as reference, and relative quantification was calculated as 2−ΔΔCT. For each tumour, pairwise comparisons between PTsup, PTdeep and LNmet were performed and the direction of fold change was compared with the NanoString results (eg, the value of PTsup greater than PTdeep in both qRT-PCR and NanoString for a particular GC).
Supplemental material
Next-generation sequencing (NGS) analysis
DNA was sheared to 200 base pairs using a sonicator and cleaned-up with 1.4X Agencourt AMPure XP beads (Beckman Coulter, A63881). Libraries were generated using the KAPA Hyper Prep Kit (Roche, KK8504). Hybridisation capture was done using an IDT xGen Custom Panel of 225 genes (online supplemental table S3) and reagents as per manufacturer’s instruction (xGen Hybridization and Wash Kit, IDT 1080577). Sequencing was performed on an Illumina NextSeq 550 System Mid-Output Kit (2×150 paired).
Supplemental material
Sequence reads were processed using the bcbio-nextgen pipeline V.1.1.1a0 with default settings, including adapter trimming, quality filtering and read mapping on the reference genome hg38 with BWA V.0.7.17-r11880 and duplicate read marking with GATK MarkDuplicates. Quality statistics and on-target analysis of coverage were performed using samtools V.1.9 and bedtools V.2.27.1. Variants were called using VarDict, and somatic variants per patient were annotated using Ensembl VEP V.23. Only variants with moderate or high impact, with maximum population variant frequency of >0.00001 and number of alternate supporting reads of >10 were considered for further analyses.
Multiplex ligation-dependent probe amplification (MLPA) assay
Details of the MLPA assay, including probemix development, sensitivity against single-nucleotide polymorphisms and fluorescent in situ hybridisation using GC cell lines, have been previously described.18 The MLPA probemix P458-B1 (MRC-Holland, NL) included the genes EGFR, ERBB2, FGFR2, MET, TOP2A, KRAS, MYC, PTP4A3, PIK3CA, KLF5, CCNE1, GATA6, FGFR1, GATA4, CDK6 and CCND1.
The MLPA analysis methodology has been previously described.19 20 In short, analyses were performed using the MLPA intermethod,19 20 whereby samples were normalised per batch using samples processed in each batch. Quality control ensured that samples with low overall intensity, with a large difference in intensity between short probes and long probes, with low intensity of denaturation controls, or high within-gene variation, defined as the average of the SD of log-transformed values were excluded.
Final values were calculated by averaging the peak height of each probe and then averaging the results of replicates. Copy number thresholds were set according to previously published studies18 21 as follows: a gene copy number ratio of less than 0.80 was categorised as ‘loss’, between >0.80 and 1.30 as ‘normal’, between >1.30 and 2.0 as ‘low amplification’, between >2.0 and 5.0 as ‘high amplification’ and >5.0 as ‘very high amplification’. Pairwise comparisons were made within each GC between subregions. If the copy number aberrations were the same in the subregions, concordance was established (eg, normal for PTsup and normal for PTdeep for a particular gene in a GC were classified as concordant), while discordance was defined as a different value for the comparison (eg, ‘loss’ or ‘amplification’ for LNmet and normal for PTsup for a particular gene in a GC was classified as discordant).
Statistical analyses
Categorical data such as sex, pT (depth of invasion) and pN (lymph node status) were compared using Fisher’s exact test. Comparison of NanoString RNA expression values between LNmet, PTsup and PTdeep was performed using non‐parametric paired Wilcoxon signed-rank test with false discovery rate (FDR) corrections for multiple hypothesis testing. An adjusted p value of <0.05 was considered statistically significant. Unsupervised hierarchical clustering of samples was done using principal component analysis and the ggbiplot package. After calculating the principal components of the explained variance when centred and scaled, a mean centre point for each cluster was calculated for generation of ellipses. Kaplan-Meier plots and log-rank statistics were used for survival analysis. All statistical analyses were performed using R V.3.6.1 (R Foundation for Statistical Computing, Vienna, Austria).
Results
For this study, up to 64 primary GCs and matched regional lymph node metastases from patients with locally advanced resectable GC were included per assay. Each patient had several tumour subregions analysed: primary tumour from the luminal (superficial) surface, which was subdivided into two parts (PTsup1 and PTsup2); primary tumour from deep regions (PTdeep); and tumour regions in regional lymph nodes (LNmet). Based on quality of DNA/RNA extracted from each sample, different numbers of samples were available for the various assays (online supplemental table S4). All 64 (100%) GCs had clinical and histological phenotyping data available. The median age was 71 years (range: 39–91 years), and 73% were male. Most GCs were of intestinal type (92%); six (9%) GCs were Epstein-Barr virus positive; and five (8%) GCs were mismatch repair (MMR) protein deficient (online supplemental table S5). The estimated median overall survival was 1.02 years (95% CI 0.80 to 1.58).
Supplemental material
Supplemental material
Differential expression of genes between spatial subregions in primary tumor and matched metastatic lymph node
After quality control, NanoString data were available from PTsup1 (63 (98%)), PTsup2 (54 (84%)), PTdeep (57 (89%)) and LNmet (51 (80%)) GCs, respectively (online supplemental tables S4 and S6). Transcriptomic profiles consisting of 770 genes were compared for differential expression between subregions. Between samples that had matched LNmet and samples that did not, we did not observe any significant clinicopathological differences at the transcriptomic level (online supplemental figure S1). When PTsup1 and PTsup2 were compared within the same patient, none of the 770 genes was significantly differently expressed after false discovery rate (FDR) correction for multiplicity (online supplemental figure S2). Furthermore, there was a strong correlation of the transcriptomic profiles between the two adjacent luminal GC subregions (Spearman’s R=0.95, p<0.0001) (online supplemental figure S3). For further analyses of NanoString data, PTsup1 values were designated PTsup and compared with PTdeep subregion and LNmet samples.
Supplemental material
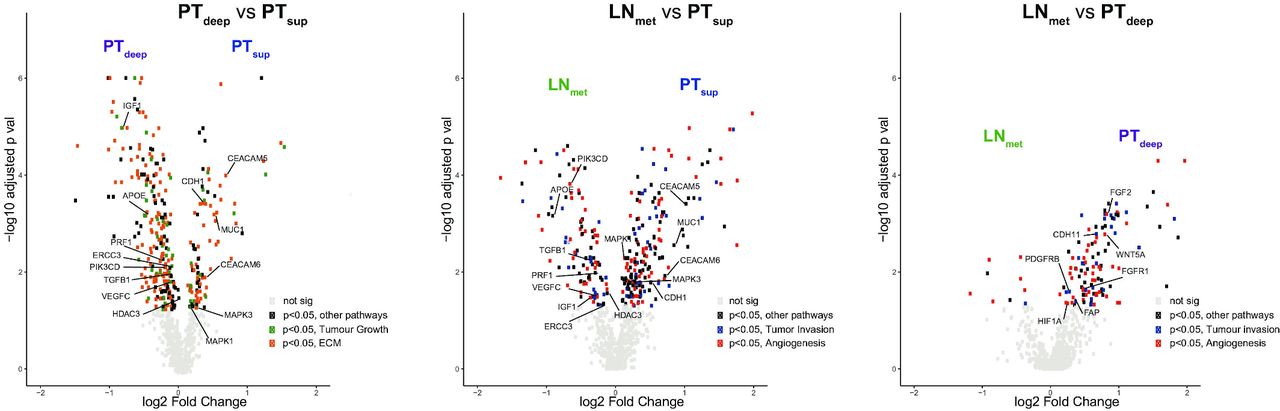
Differential gene expression analysis between PTdeep and PTsup subregions identified 331 (43%) genes which were significantly different between the two subregions (figure 2A). Genes mapping to the ‘ECM’ and ‘tumour growth’ pathways were the genes most differentially expressed between PTsup and PTdeep subregions (online supplemental table S7).
Supplemental material

Volcano plots comparing differential gene expression between subregions. (A) Volcano plot of 770 genes from the NanoString PanCancer progression panel comparing differential gene expression between PTdeep and PTsup. The x-axis is the log2 fold change of gene expression between PTsup and PTdeep. The y-axis is the −log10 adjusted p value results (false discovery rate correction). Genes of interest have been annotated within the plot. Grey dots are genes which are similarly expressed in PTdeep and PTsup. Green dots are genes which are statistically significant and belong to the ‘tumour growth’ pathway. Orange dots are genes which are statistically significant and belong to the ‘ECM remodelling’ pathway. Black dots are genes which are statistically significant and belong to other pathways. In general, genes which are at the extreme ends of the volcano are highly differentially expressed in that particular subregion compared with the other and are of greatest clinical interest. (B) Volcano plot of genes comparing LNmet and PTsup. Red dots are genes which are statistically significant and belong to the ‘angiogenesis’ pathway. Blue dots are genes which are statistically significant and belong to the ‘tumour invasion’ pathway. Black dots are genes which are statistically significant and belong to other pathways. Grey dots are genes which are similarly expressed in LNmet and PTsup. (C) Volcano plot of genes compared between LNmet and PTdeep. Red dots are genes which are statistically significant and belong to the angiogenesis pathway. Blue dots are genes which are statistically significant and belong to the tumour invasion pathway. Black dots are genes which are statistically significant and belong to other pathways. Grey dots are genes which are similarly expressed in LNmet and PTdeep. ECM, extracellular matrix; LNmet, lymph node metastasis; PTdeep, primary tumour deep; PTsup, primary tumour superficial.
Differential gene expression analysis between PTsup and LNmet subregions identified 291 (38%) genes as significantly different between the two subregions (figure 2B and online supplemental table S8). PTsup had 186 (24%) genes overexpressed compared with LNmet, while LNmet had 105 (14%) genes overexpressed compared with PTsup (table 1). Genes mapping to the ‘angiogenesis’ and ‘tumour invasion’ pathways were the most commonly differentially expressed genes between PTsup and LNmet. Approximately 10% of genes were found to overlap between the comparison of PTsup versus PTdeep and PTsup versus LNmet (81 genes were overexpressed in PTsup compared with PTdeep and LNmet, while 69 genes were overexpressed in PTdeep and LNmet compared with PTsup). Several of these genes were potential therapeutic targets, such as APOE, ERCC3, HDAC3, IGF1, PIK3CD, PRF1, TGFB1 and VEGFC (higher in PTdeep and LNmet) and CDH1, CEACAM5, CEACAM6, MAPK1, MAPK3, MUC1 and WNT5A (higher in PTsup). Quantitative RT-PCR was performed on selected genes and validated the NanoString gene expression findings (online supplemental figure S4).
Supplemental material
Number of genes in the NanoString panel with significant differences in matched paired analyses of tumour subregions
Differential gene expression analysis between PTdeep and LNmet subregions identified 127 (16%) genes as significantly different between the two subregions (figure 2C and online supplemental table S9). Of these, 117 (15%) genes were overexpressed in PTdeep compared with 10 (1%) overexpressed genes in LNmet (table 1). Similar to the analysis comparing PTsup and LNmet, most of the differentially expressed genes belonged to the angiogenesis and tumour invasion pathways. Genes such as FGF2, WNT5A, FGFR1, FAP, HIF1A, PDGFRB and CDH11 were overexpressed in PTdeep. The lower number of genes with differential expression between PTdeep and LNmet suggests that the RNA expression profile of the tumour in LNmet is likely more similar to the deep subregion of the primary tumour than to superficial subregions.
Supplemental material
We classified samples into ITHhigh and ITHlow based on the mean SD of gene expression between subregions. We found no significant relationship between ITH and clinicopathological characteristics (online supplemental tables S10 and S11 and online supplemental figure S5). We found that genes previously used to classify intertumoural heterogeneity of GC such as KRAS, TP53, SMAD4 and WARS showed low ITH (below the 10th centile).8 9 22 Certain genes with therapeutic and clinical relevance such as CEACAM6, CEACAM5 and EGF had the highest ITH (above the 90th centile) (online supplemental table S12).23
Supplemental material
Supplemental material
Supplemental material
In this study, we selected tissue blocks for analysis based on highest tumour content. Subregions were annotated for DNA and RNA extraction and morphometric and phenotypic assessment by a senior GI pathologist (figure 1). To address the possibility that differences in ‘contaminating’ normal tissue might confound our results, we morphometrically quantified the tumour:stroma ratio per subregion (online supplemental table S13) and compared it between subregions in the same patient. The median tumour:stroma ratio was 0.45 (IQR 0.32–0.60). There was no difference in the tumour:stroma ratio between PTsup and LNmet (median 0.51 (PTsup) vs 0.47 (LNmet), p=0.49), whereas the tumour:stroma ratio between PTsup and PTdeep was significantly different (median 0.35 (PTdeep), p<0.001). However, it is important to note that we observed a significant overlap in highly expressed genes common to both PTdeep and LNmet regions compared with PTsup subregions, which is more consistent with cancer cell-related expression. These included several well-known oncogenes and other cancer-related genes commonly expressed in both PTdeep and LNmet regions compared with PTsup (eg, TGFB1, PIK3CD, IGF1 and VEGFC). These findings suggest that differences in tumour content proportions are unlikely to have played a major role in the transcriptomic differences between subregions.
Supplemental material
DNA spatial heterogeneity in gastric cancer
An NGS panel of 225 genes commonly altered in GI cancers was analysed in eight GCs (three subregions per sample: PTsup, PTdeep and LNmet). Mutations were detected in one to six genes per subregion, except for GC case TH316, where 33–44 mutations per subregion were detected (note that TH316 is an MMR-deficient tumour). Of the 225 genes included in the panel, mutations were detected in 53 (24%) genes. TP53 mutations were the most commonly detected mutations and present in 50% of GCs. Of these 53 genes, 21 (40%) genes had mutations in PTdeep and/or LNmet, but not in PTsup. Conversely, only three (6%) genes had mutations in PTsup but not in PTdeep and LNmet (figure 3). For 44 genes, at least one GC had mutations detected in all three subregions. In these, allele frequency values were compared between subregions. In 33 (75%) genes, the allele frequency of the specified gene in the LNmet subregion was higher than PTsup (online supplemental table S14). These findings from the NGS mutation analysis provide orthogonal support of the NanoString data for spatial ITH between subregions, particularly between PTsup compared with PTdeep and/or LNmet.
Supplemental material
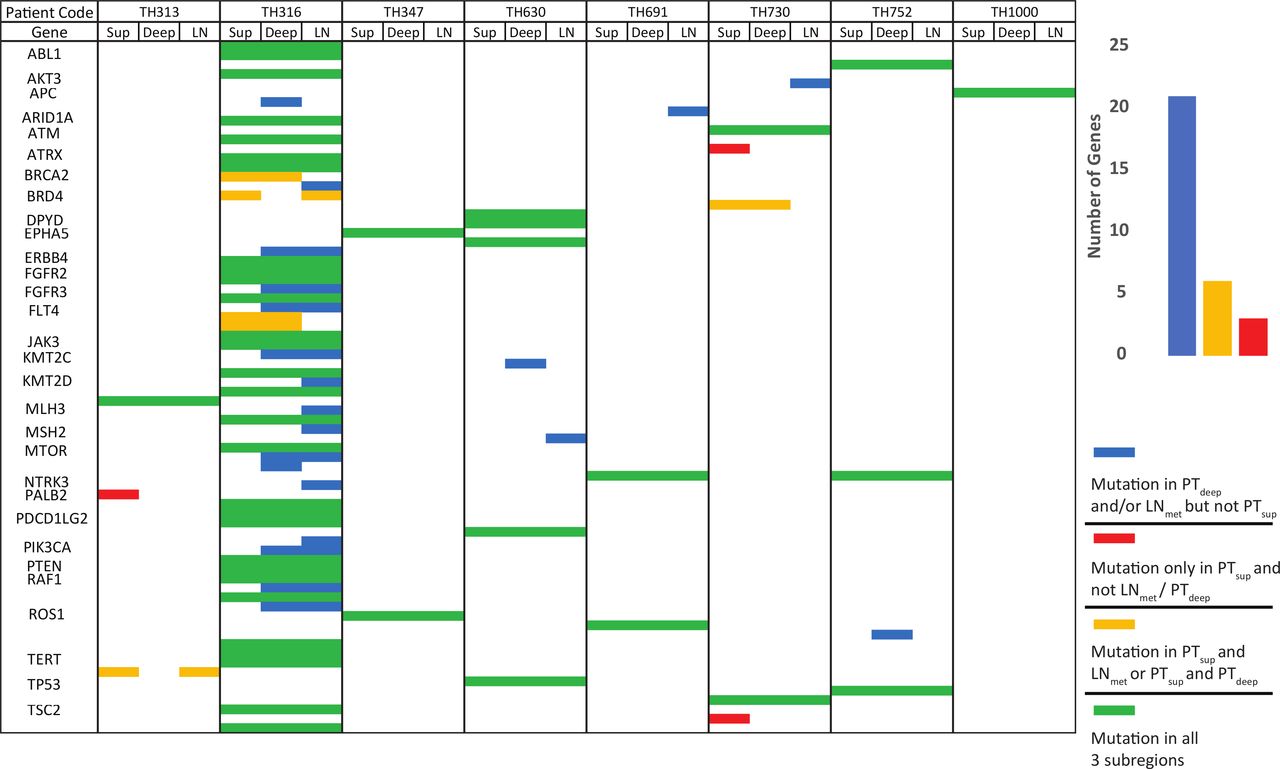
NGS analysis of spatial heterogeneity in GC. Heatmap of DNA mutations detected by performing NGS of 225 genes per subregion on eight GCs. GCs are represented into columns, with subregions forming subcolumns within each column in the order of PTsup, PTdeep and LNmet. Genes where mutations were detected in at least one subregion of one GC are represented in rows. Genes which had mutations called in all three subregions (ie, no ITH) were coded green; genes which had mutational calls in PTsup but not PTdeep or LNmet were coded in red; those with mutational calls in either PTdeep and/or LNmet but not PTsup were coded in blue; and PTsup and PTdeep but not LNmet or PTsup and LNmet but not PTdeep were coded in yellow. Bar graph shows prevalence of mutations detected in PTdeep and/or LNmet (blue) but not PTsup is significantly higher than any other combination of spatial ITH. ITH, intratumoural heterogeneity; LNmet, lymph node metastasis; NGS, next-generation sequencing; PTdeep, primary tumour deep; PTsup, primary tumour superficial.
Apart from studying ITH of single-base DNA mutations, we also studied gene copy number variation by analysing MLPA subregion data. Of the 64 samples used for the NanoString analysis, 41 (64%) had sufficient DNA quantity and quality to perform the MLPA analysis. There were no significant clinical differences between cases with MLPA data and those without (online supplemental tables S4 and S5). Furthermore, to reduce ‘missing-data bias’, we included additional 20 GCs for MLPA profiling to have a total of 61 GC for MLPA analysis (additional sample clinical data available in online supplemental table S15). Ninety-one per cent of the 16 genes across 61 samples per three subregions were categorised as ‘normal’ copy number. The highest frequency of gene copy number aberrations was found in CCNE1 (15%), GATA4 (16%) and MYC (15%), range of gene copy number aberrations 2%–16% (online supplemental table S16). Pairwise comparisons of gene copy number values were made between subregions to study ITH. Out of 976 comparisons (61 samples×16 genes) for each subregion pairing, the highest discordance was seen between PTsup and LNmet (PTsup vs LNmet 112 (11%) discordant comparisons); followed by PTdeep versus LNmet (93 (10%) discordant comparisons) and finally PTsup versus PTdeep (75 (8%) discordant comparisons), consistent with progressive genomic changes from PTsup to LNmet.
Supplemental material
Supplemental material
Phenotypical spatial heterogeneity in gastric cancer
In total, 228 subregions from 64 GCs had phenotypical subtyping performed. Sixty-one (27%) subregions were classified as poorly cohesive, 158 (69%) as non-poorly cohesive and 9 (4%) as mucinous. Of the 61 poorly cohesive subregions, 49 (80%) contained signet-ring cells. When intratumoural subregions were compared, only eight GCs (13%) demonstrated different phenotypical classifications between subregions (online supplemental table S17). There was little correlation between phenotypic and transcriptomic ITH. Subregions with the same phenotype showed transcriptomic differences, while in some cases, subregions with different phenotypes appeared to have similar transcriptomic profiles. We selected one GC to illustrate this phenomenon (figure 4). In the majority of the cases which had no phenotypical ITH (n=56, 88%), there was a variable degree of transcriptomic ITH. We selected two GCs with the no phenotypical ITH to illustrate one GC with low transcriptomic ITH (ITHlow) and one GC with extensive transcriptomic ITH (ITHhigh) (figure 5).
Supplemental material

Phenotypical and transcriptomic heterogeneity in gastric cancer. TH657 is an example of a tumour with phenotypical heterogeneity. (A–C) H&E images of the tumour subregions. (A) Superficial subregion (PTsup) which demonstrates a non-poorly cohesive subtype, with no signet-rings. (B) Deep subregion (PTdeep), which is poorly cohesive and has 10%–90% signet-rings. (C) Metastatic lymph node (LNmet) which has <10% signet-rings and is poorly cohesive. (D) Heatmap of NanoString expression profile of TH657 by various spatial subregion. NanoString gene expression is represented in columns, scaled. Blue to red denotes gene expression, with blue implying low gene expression and red implying high gene expression. There is little correlation between phenotypical and transcriptomic heterogeneity. For example, PTsup1 and PTsup2 are phenotypically different (PTsup1 is non-poorly cohesive, while PTsup2 is poorly cohesive) but have similar transcriptomic profiles. However, PTsup2 and PTdeep have the same phenotype, but significantly different transcript profiles. LN, lymph node; LNmet, lymph node metastasis; PT, primary tumour; PTdeep, primary tumour deep; PTsup, primary tumour superficial.

Phenotype and NanoString gene expression of select GC. (A) Heatmap of NanoString gene expression of TH112 (ITHlow) and TH295 (ITHhigh). (B–D) are H&E images of TH112 subregions (B=PTsup, C=PTdeep and D=LNmet). (E–G) H&E images of TH295 subregions (E=PTsup, F=PTdeep and G=LNmet). Phenotypically, both samples do not have significant heterogeneity between subregions—all subregions for both TH112 and TH295 were classified as non-poorly cohesive, no signet-ring cells and no mucin. In the heatmap (A), TH112 (top four rows) is an example of a tumour with low transcriptomic ITH in this cohort, while TH295 (bottom four rows) is an example of high transcriptomic ITH. The heatmap demonstrates obvious heterogeneity in gene expression between TH295 PTdeep and the rest of the subregions TH295 LNmet, PTsup1 and PTsup2. In contrast, for TH112, there are minimal differences in gene expression between the LNmet, PTsup1, PTsup2 and PTdeep. ITH, intratumoural heterogeneity; LNmet, lymph node metastasis; PTdeep, primary tumour deep; PTsup, primary tumour superficial
Discussion
Gastric cancer has long been recognised as a heterogenous group of adenocarcinomas. Classifying GC into more homogenous subtypes might allow the development of subtype-specific treatments under the overarching umbrella of ‘precision oncology’. To increase ‘coverage’ of potential intratumour heterogeneity, one could consider increasing the number of endoscopic biopsies beyond the current standard of six to eight.24 25 It has been shown that HER2-positive GC cells are more frequent in the luminal tumour surface compared with deeper layers and that at least five tumour containing endoscopic biopsies are needed for reliable HER2 testing.26 Similar spatial heterogeneity has been demonstrated when measuring FGFR2 copy number in GC.27 However, whether a larger number of endoscopic biopsies would also be sufficient to address ITH for other DNA or RNA-based biomarkers, as well as for the histological phenotype, is currently unknown. A recent study suggested that circulating cell-free DNA measured in the blood detects mutations not identified in multiple endoscopic biopsies in GC.28 Spatial annotation of tumours and biopsy samples has only infrequently been considered in clinical biomarker tests or research analyses in the past.
In this study, we annotated surgical resection samples and demarcated multiple superficial (luminal/mucosal) and deep regions of primary GC, as well as tumour in matched lymph node metastases, and analysed these subregions individually using multiple platforms such as RNA expression analyses, NGS mutation analysis, DNA copy number and histomorphology. Other studies have demonstrated a relationship between molecular characteristics and histological phenotype in GC but did not include a spatial perspective.9 19 In oesophageal adenocarcinoma, whole-genome sequencing of matched primary tumour, LNmet and distant metastatic sites suggests subclonal mutations found in distant metastases were found in spatially distinct areas of the primary tumour.29 While differentiation between superficial and deep aspects of the tumour was not performed, this study, as well as another similar study performed in colorectal cancer, confirms a distinct model of metastasis with diverse trajectories for lymph node and distant organ dissemination.30
Our results yielded several findings of potential clinical and biological relevance. First, we observed minimal differences in gene expression between superficial subregions from the same GC. This suggests that increasing the number of endoscopic tumour biopsies may not be sufficient to fully characterise intratumour heterogeneity. Next, we observed significant differences in gene expression, mutations and amplification between superficial subregions, deep subregions and LNmet. Several genes are differentially upregulated in the deeper aspect of the tumour and LNmet. Interestingly, fewer differences were detected in gene overexpression between the deep subregion of the tumour and the LNmet. This observation is consistent with a model where tumour cells in the regional LNmet are more likely to originate from the deep tumour subregion than from the mucosal (superficial) subregion. Based on these findings, biomarker analyses performed on superficial biopsies alone may miss important genomic alterations that occur in the deep subregions and/or metastatic sites which drive tumour oncogenesis and may be potentially targetable. Our results are consistent with the principles of clonal evolution of GI tumours from superficial to deep to metastases which were described over three decades ago by Fearon and Vogelstein.31 Yet, most of these previous studies were conducted by analysing and comparing tumours with different depths of invasion. The present study is one of the first to describe this phenomenon within the same tumour in GC. Importantly, from the differential gene expression analysis, genes mapping to angiogenesis and tumour invasion pathways were enriched in the PTdeep and LNmet subregions, providing a plausible biological rationale for our findings. In a previous small study (n=15 GCs) of matched primary tumour and lymph node metastases, whole-exome sequencing data were analysed, and mutational abundance was compared. This study suggested that lymph node metastases arise from specific subclonal regions of the primary tumour.32 These findings can be corroborated with our deeper analyses by spatial subregions.
Matched primary tumour, lymph node and distant metastasis studies of other tumour types (eg, colorectal and lung cancer) report similar findings.33–37 In a study of melanoma lymph node biopsies, spatial transcriptomics revealed that the lymph node region closest to the primary tumour displayed expression patterns that reflected the tumour microenvironment of the primary tumour.38 ITH has also been assessed by other groups in gastro-oesophageal adenocarcinoma.10 39 However, the principal difference between those studies and ours is spatial mapping performed prior to analysis, demarcating superficial and deep aspects of the tumour with subsequent molecular analysis defined by these spatial regions. Our NGS analysis of ITH in GC included one MMR-deficient tumour. To the best of our knowledge, this is the first description of mutational spatial heterogeneity in an MMR-deficient GC. Given the therapeutic implications of MMR deficiency and treatment with immune checkpoint blockade,40 41 studies are emerging on ITH as a potential mechanism of resistance to this form of therapy.42
Limitations of the present study include the time period during which these samples were accrued from and the analysis being limited only to primary tumours and LNmet and did not include distant metastatic sites. Our samples were collected from an era before perioperative or adjuvant chemotherapy was administered routinely for GC, and thus, a potential relationship of ITH with chemotherapy cannot be investigated in the current study. However, one might also consider the absence of chemotherapy an advantage as expression profiles, genomic profiles and phenotypical appearances are not altered by preoperative treatment. A retrospective cohort study of spatial heterogeneity in GC has demonstrated poorer survival for those with higher ITH.43 However, from our study, it is unclear if tumour biology driven by ITH can be altered with chemotherapy or if this is a factor that drives resistance to systemic therapy, which must be considered in future studies. As the inclusion criteria for the study required tumours which were metastatic to the lymph node and that had undergone surgical resection, earlier stage, lymph node-negative tumours and advanced, surgically inoperable tumours were not included. Thus, we do not know whether the observed ITH is specific to tumours with lymph node metastases or can also be observed in primary GC without lymph node metastases. Furthermore, while we acknowledge that analyses of more than one LNmet from each GC for ITH may produce slightly different results on an individual-patient basis, our results are generally consistent across the cohort, where randomly selected LNs with high tumour cell content were selected for analysis. Moreover, a majority of our samples were of intestinal subtype (>90%), which rendered our study population relatively homogenous with respect to clinicopathological characteristics. While this is not necessarily a limitation, it could explain the lack of correlation of ITH with these clinicopathological features and perhaps limits the generalisability of our findings to other histological subtypes of GC. Discordance between phenotypical and transcriptomic heterogeneity could be due to several reasons, such as the phenotype being driven by genes not included in the NanoString panel or post-translational changes, which would not be detected by NanoString.44 45
In conclusion, our study has highlighted clinically significant genomic, transcriptomic and phenotypical heterogeneity in GC defined by spatial subregions. Several therapeutic targets appear to be overexpressed, mutated or amplified only in the deep subregions/metastatic lymph nodes. We have elicited potential biological mechanisms of tumour metastases from deeper subregions of the tumour to lymph nodes. Endoscopists and pathologists must consider the potentially limited value of multiple superficial endoscopic biopsies for the assessment of presence or absence of a biomarker that determines patient treatment and consider investigating deeper parts of the primary tumour and/or metastatic lymph nodes for this purpose. Future studies and clinical trials in GC should take this spatial heterogeneity into consideration.
Data availability statement
All data relevant to the study are included in the article or uploaded as supplementary information. Data are available upon reasonable request: Please contact PI Heike Grabsch.
Ethics statements
Patient consent for publication
Ethics approval
The study was approved by the Leeds Research Ethics Committee (LREC no. CA01/122).
References
Supplementary materials
Supplementary Data
This web only file has been produced by the BMJ Publishing Group from an electronic file supplied by the author(s) and has not been edited for content.
- Data supplement 1
- Data supplement 2
- Data supplement 3
- Data supplement 4
- Data supplement 5
- Data supplement 6
- Data supplement 7
- Data supplement 8
- Data supplement 9
- Data supplement 10
- Data supplement 11
- Data supplement 12
- Data supplement 13
- Data supplement 14
- Data supplement 15
- Data supplement 16
- Data supplement 17
- Data supplement 18
Footnotes
PT and HIG are joint senior authors.
Twitter @jezhayden
RS and DHL contributed equally.
Contributors Conceptualisation: GH, PT and HG. Data curation: RS, DL, GH, HS, ANSA, JO, JH, LH, CCYN, AMN, SN, IT, PT and HG. Formal analysis: RS, AMN, SN and HG. Funding acquisition: GH, PT and HG. Methodology: RS, SN, PT and HG. Project administration: RS, HG and PT. Resources: GH, PT and HG. Supervision: HG, PT and HG. Visualisation: RS and DL. Writing, original draft : RS. Writing, review and editing : GH, HG and PT. Approval of final version of manuscript: all authors.
Funding RS is supported by a National Medical Research Council (NMRC) Fellowship, Singapore. PT is supported by Duke-NUS Medical School and the Genome Institute of Singapore, Agency for Science, Technology and Research. This work was also supported by National Medical Research Council grants (OF-LCG18May-0023, NR13NMR111OM and NMRC/STaR/0026/2015). This study was supported by Pathological Society Career Development Fellowship (CDF2015/01, PI: GH) and Academy of Medical Sciences Starter Grant for Clinical Lecturers (SGCL14/GH, PI: GH).
Disclaimer The funders of the study had no role in study design, data collection, analysis, interpretation or writing of the manuscript. HG and PT had full access to all data in the study and as corresponding author had final responsibility for the decision to submit for publication.
Competing interests PT has stock and other ownership interests in Tempus Healthcare, research funding from Kyowa Hakko Kirin and Thermo Fisher Scientific, and patents/other intellectual property through the Agency for Science and Technology Research, Singapore (all outside the submitted work). RS has received honoraria from Bristol-Myers Squibb, Lilly and MSD, has advisory activity with Bristol-Myers Squibb, Eisai and AstraZeneca, received research funding from Paxman Coolers and has received travel grants from AstraZeneca, Roche and Taiho Pharmaceutical (all outside the submitted work). IBHT has received consultation fees for MSD, Taiho, Roche, BMS, Bayer, Amgen and Merck Serono, and research funding from MSD and Taiho (all outside the submitted work). HIG has received honoraria from MSD (outside of the submitted work).
Provenance and peer review Not commissioned; externally peer reviewed.
Supplemental material This content has been supplied by the author(s). It has not been vetted by BMJ Publishing Group Limited (BMJ) and may not have been peer-reviewed. Any opinions or recommendations discussed are solely those of the author(s) and are not endorsed by BMJ. BMJ disclaims all liability and responsibility arising from any reliance placed on the content. Where the content includes any translated material, BMJ does not warrant the accuracy and reliability of the translations (including but not limited to local regulations, clinical guidelines, terminology, drug names and drug dosages), and is not responsible for any error and/or omissions arising from translation and adaptation or otherwise.