Article Text

Abstract
Objective Patients with Lynch syndrome (LS) are at markedly increased risk for colorectal cancer. It is being increasingly recognised that the immune system plays an essential role in LS tumour development, thus making an ideal target for cancer prevention. Our objective was to evaluate the safety, assess the activity and discover novel molecular pathways involved in the activity of naproxen as primary and secondary chemoprevention in patients with LS.
Design We conducted a Phase Ib, placebo-controlled, randomised clinical trial of two dose levels of naproxen sodium (440 and 220 mg) administered daily for 6 months to 80 participants with LS, and a co-clinical trial using a genetically engineered mouse model of LS and patient-derived organoids (PDOs).
Results Overall, the total number of adverse events was not different across treatment arms with excellent tolerance of the intervention. The level of prostaglandin E2 in the colorectal mucosa was significantly decreased after treatment with naproxen when compared with placebo. Naproxen activated different resident immune cell types without any increase in lymphoid cellularity, and changed the expression patterns of the intestinal crypt towards epithelial differentiation and stem cell regulation. Naproxen demonstrated robust chemopreventive activity in a mouse co-clinical trial and gene expression profiles induced by naproxen in humans showed perfect discrimination of mice specimens with LS and PDOs treated with naproxen and control.
Conclusions Naproxen is a promising strategy for immune interception in LS. We have discovered naproxen-induced gene expression profiles for their potential use as predictive biomarkers of drug activity.
Trial registration number gov Identifier: NCT02052908
- HNPCC syndrome
- chemoprevention
- non-steroidal anti-inflammatory drugs
- gene expression
- cancer syndromes
This is an open access article distributed in accordance with the Creative Commons Attribution Non Commercial (CC BY-NC 4.0) license, which permits others to distribute, remix, adapt, build upon this work non-commercially, and license their derivative works on different terms, provided the original work is properly cited, appropriate credit is given, any changes made indicated, and the use is non-commercial. See: http://creativecommons.org/licenses/by-nc/4.0/.
Statistics from Altmetric.com
Significance of this study
What is already known about this subject?
Screening with annual colonoscopy has demonstrated to decrease colorectal cancer (CRC) incidence in Lynch syndrome (LS); however, many patients continue to develop tumours and cancer recurrence due to poor compliance.
Genomic profiling of LS colorectal adenomas and tumours have demonstrated remarkable immune activation.
This provides rationale and opportunity to develop immune-prevention strategies that will enhance the mechanisms of immune surveillance in LS and prevent CRC development.
Significance of this study
What are the new findings?
This Phase Ib, placebo-controlled, randomised clinical trial showed that naproxen is a safe primary and secondary chemopreventive intervention when administered on a daily basis for 6 months. Both high and low dose levels of naproxen promoted immune activation of different resident immune cell types without any increase in lymphoid cellularity.
Naproxen was effective as chemoprevention by modulating tumour growth and prolonging survival in a co-clinical trial using a tissue-specific mouse model of LS.
Gene expression profiles induced by naproxen in humans showed perfect discrimination of mice with LS and patient-derived xenografts treated with naproxen and control, thus providing novel biomarkers of naproxen activity.
How might it impact on clinical practice in the foreseeable future?
Naproxen should be considered an alternative strategy for immune interception in patients with LS and populations at-risk for the development of mismatch repair-deficient intestinal tumours.
Introduction
Lynch syndrome (LS, MIM 120435) is the most common hereditary colorectal cancer (CRC) syndrome and constitutes an attractive model to understand carcinogenesis in the setting of DNA mismatch repair (MMR) deficiency, which underlies 15% of CRC due to somatic mutation/epimutation.1 LS results from the presence of germline mutations in MMR genes (MLH1, MSH2, MSH6, PMS2 and EPCAM) which are involved in repairing base-to-base mismatches and insertion–deletion (indels) loops. LS predisposes patients to CRC, endometrial, ovarian and other tumours.2 LS causes an estimated life-time risk for CRC as high as 80% compared with 5% in the general population.3 The estimated prevalence of LS is 1:280, affecting a total of 1.1 million people in the USA.4 Although screening with annual colonoscopy has demonstrated to decrease cancer incidence in LS,5 many patients continue to develop CRC due to poor compliance with surveillance recommendations or the rapid development of interval cancers.6 Therefore, there is an urgent need for the development of preventive strategies for LS.7
The Colorectal Adenoma/Carcinoma Prevention Programme (CAPP) 2 study demonstrated that the chronic use of the non-steroidal anti-inflammatory drug (NSAID) aspirin is an effective chemopreventive strategy for all LS-related tumours with a relatively low-risk safety profile.8 9 More recently, preclinical efforts have focused on evaluating the preventive effects of other NSAIDs, such as the propionic acid derivative naproxen,10 that has demonstrated promising preclinical activity in an intestinal tissue-specific mouse model of LS.11–13 Although the main mechanism of action of NSAIDs, which is the reduction in the synthesis of prostaglandins (PGs) by inhibition of the central enzyme cyclo-oxygenase-1 and cyclo-oxygenase-2 (COX-1 and COX-2), has been extensively characterised at the molecular level,14 there is a growing body of evidence that other mechanisms contribute to prevention of colorectal carcinogenesis through direct effects on the microbiota, specific targeting of the stem cell niche of the intestinal crypt and modulation of the activity of the resident immune environment in the intestinal mucosa.14–16
Here, we report the clinical results and biomarker assessments of a Phase I clinical trial testing naproxen in patients with LS (hereinafter referred to as the ‘Naproxen trial’) and a co-clinical trial to initiate the validation of the biomarkers discovered and to assess its preventive activity in mice with LS. The goals of the ‘Naproxen trial’ were to demonstrate that daily chronic administration of naproxen in patients with LS is a safe intervention, and to explore non-canonical effects that modulate the microenvironment of the colorectal mucosa that could be exploited further in the prevention of tumours in this high-risk genetic population.
Material and methods
Study design and participants
The ‘Naproxen trial’ (NCT02052908) was a Phase Ib, double-blind, randomised, placebo-controlled, multicentric trial of participants with LS and Lynch-like syndrome (LLS), conducted at four academic cancer centres. Participants provided written informed consent to participate in the study, and ethical approval was obtained from the institutional review boards of each institution.
Eligible participants were 18 years or older at the time of enrolment and either were proven carriers or obligate carriers of a pathogenic or likely pathogenic mutation in one of the MMR genes (MLH1 , MSH2/EPCAM, MSH6, PMS2, ie, patients with LS) or had been diagnosed with an MMR-deficient tumour with absence of somatic BRAF-V600E mutation and/or hypermethylation of the MLH1 promoter without evidence of a germline mutation in the MMR genes (ie, patients LLS). Randomised participants were required to have a portion of the distal colon or rectosigmoid intact in order to enable collection of normal mucosa biopsies. Therefore, this trial explored the effects of naproxen in primary and secondary prevention by recruiting unaffected carriers and cancer survivors. Participants were required to be off scheduled aspirin, NSAIDs or COX inhibitors at least 14 days prior to trial inclusion (wash-out period). Therefore, trial candidates on cardioprotective aspirin were not eligible to participate. In addition, the use of these agents was also prohibited as concomitant medications during the course of the trial. Full eligibility criteria and the protocol including the statistical analysis plan are available in the online supplementary materials and methods. All authors had full access to the data, control of the content of the manuscript and final responsibility for the decision to submit for publication.
Supplemental material
Randomisation and study intervention
Participants were stratified by germline status (LS vs LLS) and randomly assigned with an equal probability in a uniform 1:1:1 allocation ratio (figure 1). Participants were randomly assigned to receive therapy with either naproxen sodium (referred to herein as naproxen) daily at a dose of 220 mg (low-dose, LD) or 440 mg (high-dose, HD), or identically appearing placebo for a total of 6 months. The investigators and participants were blinded to study group assignments. After verification of eligibility and the initial endoscopy procedure, study drug was provided to participants. Drug compliance was defined as taking at least 80% of the study intervention assessed by scheduled phone calls, review of the participant diary and pill count of returned blisters. Evaluability was defined as fulfilling three conditions: (1) taking the study intervention for at least 90 days, (2) taking the last dose of the study intervention within 7 days prior to the end-of-study endoscopy and (3) presenting detectable levels of naproxen in both mucosa/plasma (only for patients in naproxen arms).

Flow diagram of participants in the ‘Phase Ib biomarker trial of naproxen in patients at risk for DNA mismatch repair-deficient colorectal cancer’.
Primary outcome
The primary endpoints of this study were (1) to investigate the toxicity profile and tolerability of naproxen at two dose levels over 6 months of therapy; and (2) to determine whether treatment with naproxen once-daily at two different dose levels administered during a period of 6 months as compared with placebo caused a reduction in the concentration of prostaglandin E2 (PGE2) levels in normal colorectal mucosa in the study population evaluated as the percentage of change after treatment from baseline. We defined response to treatment as achieving at least 30% reduction in the PGE2 levels.
Secondary outcomes
A total of seven secondary efficacy end points evaluated changes after exposure to 6 months of treatment that included (1) naproxen concentrations in plasma and (2) colorectal mucosa, (3) levels of PGE2 metabolites in urine (PGE-M), (4) a broad panel of PGs with levels of PGF2, PGD2, thromboxane B2, 9a11b-PGF2a and 6-KetoPGF1, (4) number of polyps observed in the rectosigmoid at baseline and after 6 months of intervention, (6) mRNA and (7) histomorphometric analysis of lymphoid components within the colorectal mucosa. Details on the methodological approaches and measurements for each endpoint can be found in the online supplementary methods section.
Evaluation of safety
Participants were instructed to contact the study team if there were any changes in their health. Physical examination and measurement of vital signs were done at baseline and 6 months of treatment. Safety was monitored by telephone interview after 2 weeks, 3 and 5.5 months of exposure to naproxen with specific review of adverse events (AEs). Documentation of AEs included date reported, date of onset, description, toxicity grading, action taken and physician review and assessment. Regular telephone interviews were conducted and documented until resolution of the event. AEs were graded according to the NCI Common Terminology Criteria for Adverse Events, V.4.0, from the US Department of Health and Human Services. Safety monitoring was provided by the principal investigator, the participating site coinvestigators as well as the Division of Cancer Prevention of the National Cancer Institute.
Statistical analysis
Participant’s demographic characteristics were summarised by descriptive statistics (online supplementary table S1). For the sample size calculations of this study, we assumed an effect size (mean divided by the SD) for the change in PGE2 levels in normal colorectal mucosa of 1.25 among the treatment groups based on previously observed effects with other NSAID agents used in a chronic setting17 and we calculated that assuming a normal distribution, 15 evaluable patients per group (a total of 45 evaluable patients) will provide 80% power for pairwise comparisons by the two-sample t-test among the three groups (LD vs control, HD vs control and HD vs LD) using the Bonferroni correction to achieve a two-sided 5% type I error. In addition, to adjust for a conservative estimate of 40% in-evaluable and/or non-compliant rate, we planned to randomise a total of 80 participants. Then, the percentage of change of PGE2 levels in normal colorectal mucosa from baseline to 6 months after treatment administration between three treatment arms was defined as 100 × (PGE2 (Post-treatments) – PGE2 (Baseline))/ PGE2 (Baseline) and compared applying Wilcoxon rank sum test since PGE2 results were skewed and did not display a normal distribution. PGE2 concentration levels were summarised by median and SD at baseline and post-treatment, and response to treatment was defined as a 30% reduction in PGE2 levels. The same methodology was applied for evaluation of PGE-M and the rest of PGs. Bonferroni correction was considered for multiple comparison adjustment. Naproxen concentrations in plasma and normal colorectal mucosa were summarised by mean, SD, median and range. Pearson correlation was estimated between the percentage of change with naproxen levels.
Supplemental material
Biomarker analyses
Details on the methodology for the assessment and comparisons of pretreatment and post-treatment levels of PGE2 in tissue and plasma, PGE-M in urine, naproxen in plasma and tissue, whole genome transcriptomics (mRNA-seq) in colorectal mucosa, bioinformatic analyses, and quantification of intraepithelial lymphocytes (IELs) and mucosa-associated lymphoid tissue (MALT) for the histomorphometry analysis can be found in online supplementary methods section.
Co-clinical trial and validation experiments in mouse model of LS and patient-derived organoids (PDOs)
Information on the co-clinical trial assessing the activity of aspirin, naproxen and placebo in intestinal cancer prevention using a Msh2LoxP/LoxP ;Villin-Cre mouse model of LS13 as well as the methods related to the validation of human expression profiles using an additional cohort of the mice with LS and six PDOs (online supplementary table S2) using both whole genome transcriptomics and qPCR (online supplementary table S3) can be found in online supplementary methods and tables.
Results
Demographic characteristics of study participants
From January 2014 to October 2017, a total of 86 patients were assessed for eligibility (figure 1 and online supplementary table S1). Six participants were excluded, as they did not meet the inclusion criteria or declined to participate. Eighty participants were randomised after the baseline colonoscopy: 25 participants in the HD group, 27 in the LD group, and 28 in the placebo group. All participants and investigators remained blinded to randomisation status until the completion of the study analysis. Twenty-two participants withdrew before the end of the study, mainly due to AEs unrelated to the study drug; thus, 58 randomised participants completed the study with pretreatment and post-treatment endoscopy results, but only 54 were considered evaluable per protocol (‘Evaluable cohort’) and were included in the per-protocol analysis: 16 in the HD group, 15 in the LD and 23 in placebo (figure 1). Demographic characteristics among the treatment and placebo groups, including age, were similar and balanced (table 1). Overall, 66.7% of participants were female, with an unbalanced distribution of sexes in the LD and HD groups. Participants with LS and LLS were randomised to the treatment groups separately, yielding similar distributions (7% LLS and 93% LS) in each group. All participants with LS had an identified germline mutation in one of the MMR genes. Fifty-three per cent of the evaluable participants had no personal history of cancer (ie, previvors) and the rest had a past history of predominantly CRC, followed by endometrial cancer in frequency.
Participant characteristics
Outcomes
Primary outcomes
All patients who received the study drug were assessed for toxicity and safety profile. A total of 185 AEs was recorded in 61 patients. Overall, the total number of AEs was not different across the three arms and the intervention was well tolerated by the participants (figure 2B). No severe AEs related to treatment were reported. By their relation to the study intervention, seven probably related AEs were recorded in four patients assigned to HD naproxen group that were grades 1–2, and 38 possibly related AEs were observed in 23 patients that were evenly distributed across all treatment arms and were all grades 1–2 (online supplementary tables S4 and S5).
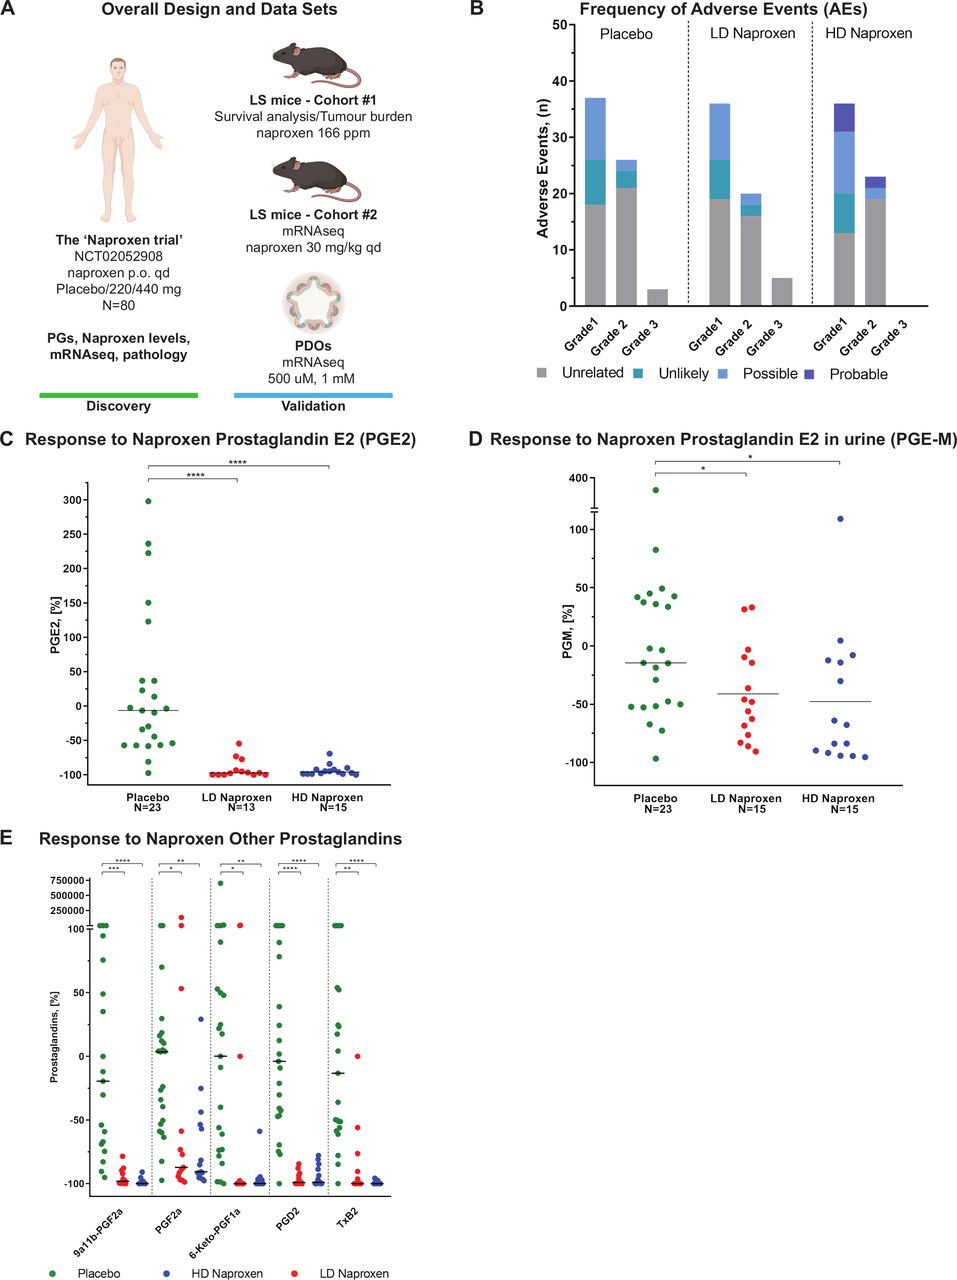
(A) Overall design and dataset. Human PGs and naproxen levels, pathology analysis of colorectal biopsies and mRNA-seq data were assessed in the context of the ‘Naproxen trial’ (NCT02052908), where 80 patients were randomised to naproxen 440 mg once a day, 220 mg once a day or placebo for a total of 6 months. A cohort of 83 mice with LS, Msh2fl/fl ;Villin-Cre, was treated to assess the chemopreventive activity of naproxen and aspirin compared with control at a dose of 166 ppm and 400 ppm, respectively, in terms of survival outcomes and tumour burden. Human mRNA-seq results were validated in an additional cohort of six mice with LS treated with naproxen orally once a day at a dose of 30 mg/kg/day or sesame oil as control, and in a set of six PDO models generated from colorectal mucosa of patients with LS who were treated for 48 hours with naproxen at 1 mM and DMSO (control). (B) Frequency of AEs. Number of AEs reported during the 6 months of intervention by treatment group, grade and attribution to study treatment. One patient could report more than one AE and all AEs were counted. (C) Change in PGE2 levels in response to naproxen. Comparison of the change in levels of PGE2 from baseline after treatment among placebo, HD and LD naproxen-treated patients using a Wilcoxon rank sum test. The graph displays the percentage of change calculated using (100×((Post) – (Baseline)/Baseline); (**p≤0.05, ***p≤0.001) and the median per group. (D) Change in PGE-M levels in response to naproxen. Change in levels of PGE-M from baseline after treatment with placebo, HD and LD naproxen using a Wilcoxon rank sum test. The graph displays the percentage of change calculated using (100×((Post) – (Baseline)/Baseline); (***p≤0.001) and the median per group. (E) Change in the levels of other PGs in response to naproxen. Changes in the levels of 9a11b-PGF2a, PGF2a, 6-Keto-PGF1a, PGD2, TxB2 after treatment with placebo, HD and LD naproxen using a Wilcoxon rank sum test. The graph displays the percentage of change after treatment calculated using (100×((Post) – (Baseline)/Baseline); (*p≤0.05, **p≤0.01, ***p≤0.001) and the median per group. AEs, adverse events; HD, high dose; LD, low dose; PDO, patient-derived organoid; PGs, prostaglandins; ppm, parts per million.
The level of PGE2 in the colorectal mucosa of compliant patients, defined as the percentage of change from baseline to 6 months, was significantly decreased after treatment with both LD and HD naproxen when compared with placebo (−97.4% (−100,–54.6), −96% (−100, −69.4) and −6.5% (−97.5, 298), p value <0.001; figure 2C), but without differences between HD and LD (neither in terms of percentage nor for absolute values, figure 2C, online supplementary figure S1A and table S6). Therefore, the proportion of patients that achieved a response to treatment in the HD and LD naproxen groups was very similar (93.3% vs 92.3%, respectively), whereas the response in placebo was 8.7%, indicating that both doses effectively inhibited COX-1/2.
Supplemental material
Supplemental material
Secondary outcomes
PGE-M levels in urine were significantly changed in terms of percentage (−48.1% (−90.7, 33.1), −67.8 (−95.5, 109.2) and −14.5 (−96.8, 379.9), p value <0.018; figure 2D) and absolute values (online supplementary figure S1B, table S7) after treatment with naproxen for both doses when compared with placebo. Yet naproxen concentration in plasma was significantly greater among participants treated with HD naproxen as compared with both LD and placebo (online supplementary figure S1C). However, the levels of naproxen in colorectal tissue were not significantly higher among participants who took HD as compared with LD (online supplementary figure S1D, table S8), even after removing non-compliant patients. Then, we completed our assessment of naproxen activity by analysing a wide panel of COX-1/2 metabolites including PGF2, PGD2, thromboxane B2, 9a11b-PGF2a and 6-KetoPGF1. All of these PGs decreased significantly in both treatment groups when compared with placebo. However, in line with PGE2 and PGE-M results no significant differences were found when HD was compared with LD group (figure 2E, online supplementary figure S1E and table S9).
In regards to the effect of naproxen on polyp growth, we restricted the evaluation to the rectosigmoid area in order to compare the findings from the baseline colonoscopy and the end-of-study flexible sigmoidoscopy. Among the group of evaluable patients (n=54), 14 (26%) participants had a polyp at baseline and only 2 (3.7%) had a polyp at the end-of-study. These two participants received placebo, both presenting adenomas (2 out of 23, online supplementary figure S1F), and none of the participants in the LD and HD naproxen arms displayed any polyps at the end-of-the-study scope (0 out of 15, and 16 participants, respectively).
We then analysed the differences in gene expression in the normal rectosigmoid mucosa before and after exposure to HD and LD naproxen using mRNA-seq. We observed a higher number of genes deregulated by HD as compared with LD indicating an overall predominance of genes downregulated by the intervention (a total of 57 vs 38 genes, respectively; figure 3A and online supplementary figure S2A). HD upregulated immune genes and downregulated genes related to the cell dynamics occurring at the top of the crypt (differentiated compartment), while LD predominantly downregulated genes involved in cell cycle regulation and dynamics at the base of the crypt (stem cell compartment). Supervised clustering of human samples treated with LD and HD and their matched pretreatment controls using their respective gene signatures demonstrated an adequate performance in differentiating specimens collected before and after intervention (figure 3A,B). Pathway enrichment analysis revealed effects induced by LD and HD naproxen that were consistent in direction for both dose levels (shared, figure 4A) or differential (dose specific, online supplementary figure S2B). By looking at the pathways that were affected by both HD and LD, we observed enrichment of signals related to immune pathways, specifically those activating cytokine signalling and their receptors (figure 4A). These results were also confirmed in an analysis combining together the datasets from both HD and LD doses (combined naproxen analysis, online supplementary table S10). This led us to perform in silico deconvolution of immune cell types which detected increased activation of different subtypes of T and B cells, and to a lesser extent from dendritic cells and macrophages (figure 4B). Finally, we examined normal colorectal mucosa biopsies by H&E staining to perform a histomorphometric analysis in order to determine if the increase in immune signals observed by transcriptomics was due to higher cellularity of lymphoid components in the colorectal mucosa (figure 4C). Colorectal lymphoid cellularity (IEL and MALT cell density) was not significantly different among treatment groups (figure 4D–E), thus suggesting that the lymphocyte expression profile reflects predominantly on local activation of immune cells over systemic recruitment or lymphoid proliferation.
Supplemental material

(A) Volcano plots of DEGs. Genes expression data obtained using whole transcriptome sequencing from participants allocated to PL, LD and HD treatment arms are displayed in volcano plots with log2(FoldChange) on the X-axis and -log10(BH-adjusted p-value) on the Y-axis. Significant upregulated and downregulated genes with BH-adjusted p-value≤0.05 and absolute value of log2(FoldChange)≥0.5 are highlighted and annotated by pathways of interest using different colours. The horizontal line represents BH-adjusted p-value=0.05. The left and right vertical lines represent log2(FoldChange)=±0.5, respectively. (B and C) LD and HD DEGs in the ‘Naproxen trial’ samples. Significant DEGs with BH-adjusted p≤0.05 and absolute value of log2-(FoldChange)≥0.5 in human LD and HD post-treatment versus pretreatment comparison are used to perform an unsupervised hierarchical clustering of LD and HD samples, respectively. Expression levels for all samples are row centred and displayed in the heatmap with gene symbols as row names and sample IDs as column names. The column covariate bar indicates pre-treatment (blue) and post-treatment (gold) expression. Dendrogram illustrates sample clustering based on distances. DEGs, differentially expressed genes; HD, high dose; LD, low dose; PL, placebo.
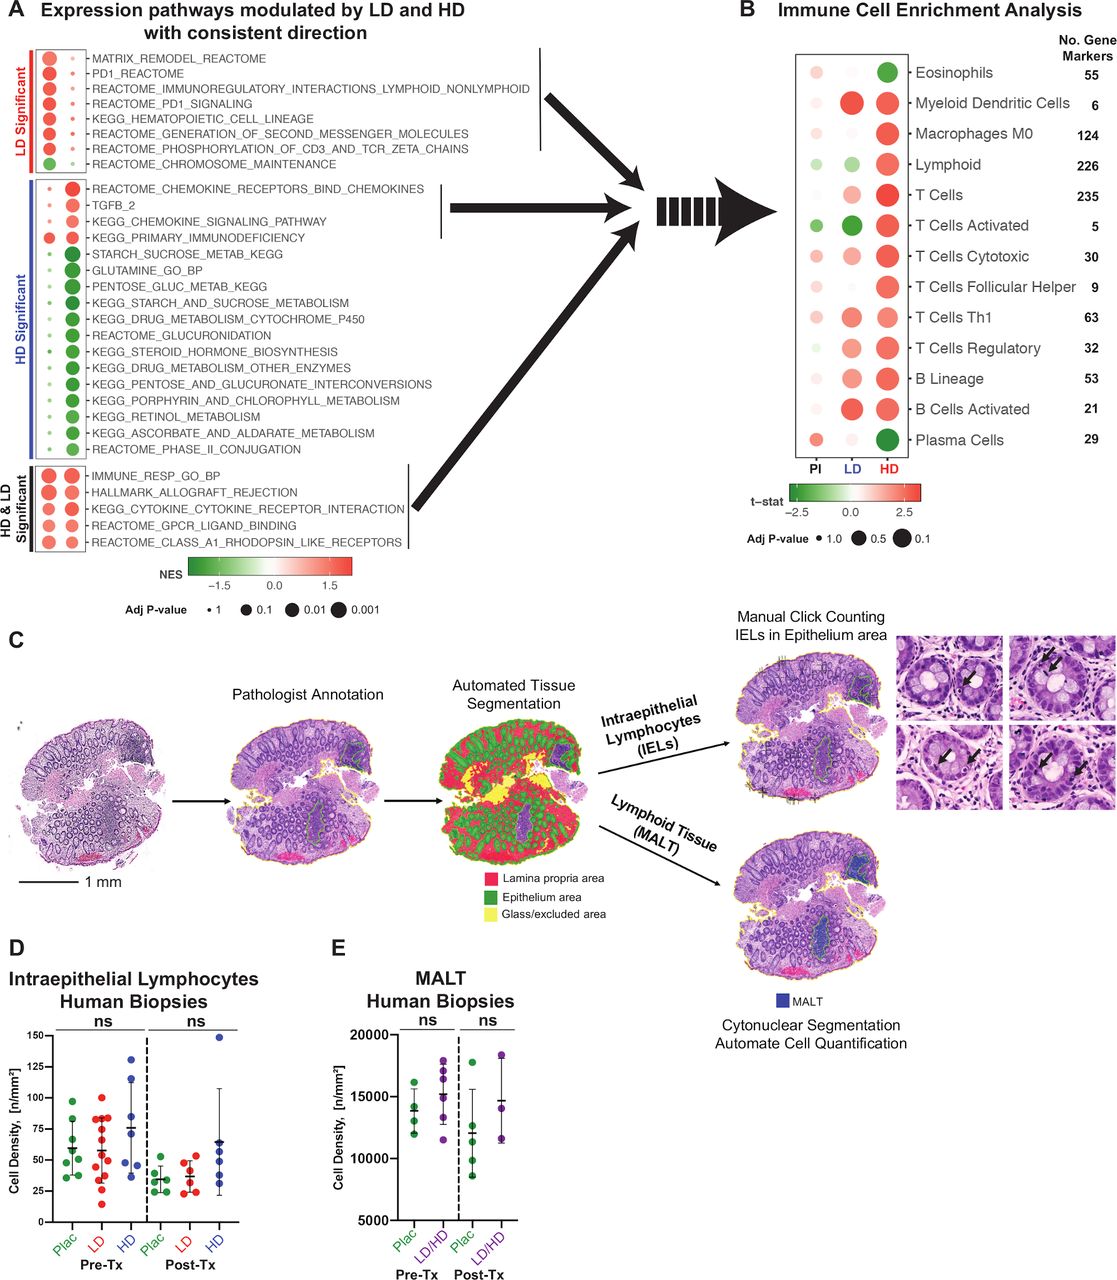
(A) Gene pathways modulated by both HD and LD naproxen levels with the same direction of effect. Both HD and LD consistently induced immune activation with additional specific effects by HD on cytokine and chemokine signalling. Bubble chart plot displaying the results of the GSEA including pathways that met the following criteria: 1. BH-adjusted p-value≤0.05 in both LD and HD (common, bottom), LD only (LD specific, top) or HD only (HD specific, middle); 2. Direction of NESs are consistent in both LD and HD (same trend). The sizes of bubbles were determined by BH-adjusted p-value increasing the size as the significance increases. The colours of the circles are determined by the direction and amplitude of NES, with positive NES (positively enriched in post-treatment group) in red and negative NES (negatively enriched in post-treatment group) in green. (B) In silico dissection of immune cell types. HD and LD naproxen consistently activated different types of T cells, B cells, DC and macrophages. Sizes of circles were determined by BH-adjusted p-value increasing the size as the significance increases. The colours of circles were determined by the sign and amplitude of t-statistic (t-stat), with positive t-stat (positively enriched in post-treatment group) in red and negative t-stat (negatively enriched in post-treatment group) in green. Note that some pathways are more extensively annotated that others based on the number of gene markers. (C) Histomorphometric analysis of IELs and MALT. Digital images of H&E slides of colorectal mucosa were analysed using HALO software (Indica Labs) using the tissue classification module, CytoNuclear algorithm and manual click counter tool. (D) IELs (n=46 specimens) and MALT (n=18 specimens) were counted and their respective epithelial area or lymphoid tissue area was quantified to calculate the cell density, cell ratio and area ratios. Glass area and tissue artefacts were excluded from the analysis. The IELs and MALTs before and after treatment with placebo, LD ad HD naproxen were assessed. Cell density is expressed by the number of cells per mm2. GSEA, gene set enrichment analysis; HD, high dose; IELs, intraepithelial lymphocytes; LD, low dose; MALT, mucosa-associated lymphoid tissue; NES, normalised enrichment score.
Co-clinical trial in mouse models of LS and PDOs
We have assessed the efficacy of naproxen and aspirin and compared it to placebo using a genetically engineered, tissue-specific mouse model of LS (Msh2LoxP/LoxP ;Villin-Cre) in a co-clinical trial where drug was delivered in the diet (online supplementary figure S3A,B). In addition, the biomarker results generated from the ‘Naproxen trial’ were confirmed in an additional and independent LS mouse cohort where drug was delivered by oral gavage (figure 2A, online supplementary figure S4A,C) and PDO of the normal colorectal mucosa of patients with LS (online supplementary figure S4B,D) in order to further inform the clinical development of naproxen.
Supplemental material
Supplemental material
In the co-clinical trial, we randomised a total of 83 mice to receive naproxen (n=30) at a dose of 166 parts per million (ppm), aspirin (n=27) at 400 ppm daily or placebo (n=26) in the diet. We observed a significant prolongation of survival in the cohort of mice treated with naproxen, when compared with both aspirin and placebo (328 vs 292 days, p<0.01; 328 vs 269, p<0.001; online supplementary figure S3A) that matched a significant effect in the modulation of intestinal tumour burden in the naproxen-treated mice (online supplementary figure S3B). The differences in survival between aspirin and placebo were not statistically significant. We then validated the human gene expression signatures of LD and HD naproxen in an additional mouse cohort and PDOs. First, we assessed the correlation of whole transcriptomic changes among human specimens treated with LD and HD, mouse tissues and PDOs both treated with naproxen. We observed that treated organoids clustered together with LD sharing more genes than were significantly deregulated with LD, and that treated mice were closer to HD (figure 5A,B). Based on these observations, we validated the performance of the human LD and HD gene signature discriminating naproxen treated and control specimens in PDOs and mice, respectively. Both human signatures segregated treated and control samples in two clear groups on their respective validation models (online supplementary figure S4E,F). Then, using PDOs, we assessed specific genes related to the most relevant pathways deregulated with LD and HD naproxen in humans and observed that naproxen reduced the expression of stem cell markers (ASCL2 and LGR5) and increased the expression of differentiation markers (KRT20 and LYZ), consistent with the modulation of the crypt top and base observed in the enrichment analysis. Also, we confirmed naproxen-induced cell cycle arrest (downregulation of TOP2A and E2F) and reduction in apoptosis (decrease in Survivin and increase in p21 and NGFR) that translate into a trend of decreased proliferation in the epithelium (figure 5C). Overall, the use of these two models confirmed that we have identified two gene expression signatures that can robustly classify and predict changes induced by naproxen in normal colorectal mucosa.

(A) Human specimens, PDOs and mouse correlation. Upper left, we use a patient-wise Pearson correlation matrix for unsupervised clustering of LD, HD, mice and organoid samples. Dataset and patient IDs are concatenated and shown as column and row names. Note that human and PDOs were analysed individually while mouse specimens were combined together. Column and row covariate bars indicate datasets to which samples belong to. The dendrogram illustrates sample clustering based on distances and showing that mouse samples clustered with HD human samples and PDOs with LD samples. (B) Overlap among human, mouse and PDO datasets. Venn diagrams showing the number of overlapping significant genes with BH-adjusted p-value≤0.1 among human LD post versus pre, HD post versus pre and mouse naproxen versus control comparisons (Upper), and among human LD post versus pre, HD post versus pre and PDOs naproxen versus control comparisons (bottom). (C) Differential gene expression of key genes identified in humans using PDOs treated with naproxen and control. Naproxen induced downregulation of stem cell markers and upregulation of epithelial differentiation markers. Data derived from PDOs treated with naproxen at 1 mM (red triangles) and dimethyl sulfoxide (DMSO)/control (grey circles) is presented. Graphs show 2−ΔCt, where ΔCt represent cycle threshold (Ct) of the gene of interest normalised by Ct of Cyclophilin-A (PPIA). The graphs display mean values. *p≤0.05, **p≤0.01. HD, high dose; LD, low dose; PDOs, patient-derived organoids.
Discussion
The results of this clinical trial demonstrate that naproxen is a safe intervention when administered chronically at doses of 220 and 440 mg daily. The most common side effects were gastrointestinal and bleeding events that were minor and most likely related to the multiple biopsies taken for biomarker assessments. These studies showed that both doses of naproxen have a role in the activation of the resident immune system of the colorectal mucosa in patients with LS that was dose-dependent with the highest activity among patients treated with HD naproxen. Therefore, we would advocate to continue the development of naproxen at the dose of 440 mg daily.
We observed differential modulatory effects on other pathways with more prominent regulation of cell cycle and signals associated to the stem cell compartment by LD, and regulation of metabolism and crypt top dynamics that induced differentiation into epithelial and secretory cell types by HD. While these observed effects are beyond the main mechanism of action of NSAIDs14—the modulation of inflammation via the reduction of PGs, mainly PGE2, secondary to the inhibition of the COX enzymes—NSAIDs have proved to exert additional effects at different levels such as modulation of the microbiota, direct effects on the stem cell pool, and the microenvironment including, but not restricted, the mesenchymal and the immune cell compartments.14 15 Our observation that naproxen induces immune activation is consistent with the previously reported bipartite roles of PGE2 on inflammation.18 On one side, PGE2 has a clear pro-inflammatory role in the acute phase and, therefore, the therapeutic use of NSAIDs is to reduce directly its main consequences such as vasodilation, vascular permeability, fever, pain and T helper 17 cell differentiation; on the other side, PGE2 exerts anti-inflammatory effects in chronic phases mainly by suppressing the activation of dendritic cells (DCs) and natural killers, suppressing the function of macrophages, neutrophils, T helper cells type 1 and CD8+ cytotoxic T cells, and promoting regulatory T cell functions.16 18–20 These immunosuppressive functions are mediated by inhibition of the synthesis of cytokines IL-2, CCL-19 and IL-12.18 21–23 In fact, we observed that reduction in levels of PGE2 was associated with activation of cytokine-related pathways and activation of T cells, DCs and macrophages, thus leading to an overall immune activation.16 Consistent with the notion of enhanced immune surveillance via activation, we observed stable cellularity in the two main resident lymphoid cell niches of the colorectal mucosa by hystomorphometry. Overall, the immune stimulatory effect generated by chronic administration of naproxen in the context of MMR-deficiency should be able to enhance the effect of vaccine strategies acting as an adjuvant, aside from the intrinsic chemopreventive effect that has been demonstrated by others and us in a co-clinical trial using a LS intestine-specific mouse model.11 Therefore, naproxen will have a prominent role in the future as there are active research programmes developing vaccine strategies for immune-interception of cancer in patients with LS.24–26
We have discovered a gene expression signature of changes induced in a haplo-insufficient MMR-deficient epithelium that has been validated in both PDO and a mouse model of LS. Both expression profiles derived from human specimens were capable of discerning accurately in vitro and in vivo models treated with naproxen and control. As a note of caution, achieving clinically relevant drug levels that reach the inner layer of epithelial cells and diffusion through Matrigel may involve the use of supra-physiological dose levels and results need to be validated in an independent human LS cohort. Nonetheless, we have been able to validate human expression signatures in PDOs from patients with different germline MMR-deficient backgrounds. We believe that his orthogonal validation across models provide a strong basis to further develop this gene profile as a predictive biomarker in future clinical studies.
We acknowledge several limitations in our study. First, we have not established a direct cancer preventive effect of naproxen in this study, which was a phase I biomarker trial to assess safety and discover predictive biomarkers of activity, and therefore limited to 6 months duration. During this interval of time, assessment of modulation of intestinal neoplasia (polyps and tumours) was not a realistic outcome. Second, the current study has not compared naproxen to the current standard, aspirin. The favourable results of naproxen in LS compared with aspirin in a mouse model of LS are proof-of-principle and should be tested for confirmation in a human clinical trial.11 In addition, it is unknown if aspirin exerts the same immune stimulatory effects, or if these are intrinsic to naproxen, or if these are related to the modulation of the production of PGs. Biomarker studies planned in the context of the on-going CAPP 3 study, which is exploring the effects of different dose levels of aspirin, should be able to address this question.27 Third, our evaluation on the polyp burden postintervention was limited to the rectosigmoid due to the fact that one of the study procedures was the standard of care colonoscopy for surveillance and the other one was an in-study flexible sigmoidoscopy for the acquisition of tissue specimens. Therefore, formal assessment on the activity of naproxen on the modulation of polyp growth is beyond the scope of this study as it did not provide a full exploration of the colon and it will be more appropriate in subsequent studies with adequate power to answer this type of endpoint. Fourth, there is a high degree of variation in the levels of the PG metabolites observed in the placebo arm, particularly PGE2 and TxB2. This observation may result from physiological variation, although unpermitted use of other NSAIDs cannot be excluded. While, this fact is unlikely due to the restrictions on concomitant medications imposed by the study protocol as well as the enforcement of a wash-out period for aspirin and all other NSAIDs, it is also possible that stochastic variation in the levels of PG metabolites in the placebo arm influenced the final results. These data highlight the importance of including placebo arms in the design of cancer prevention studies so that biomarker fluctuation data can be made available for comparisons, and for estimating statistical variance for similar studies. Fifth, we have not validated the gene expression signatures in an independent cohort of patients with LS. Although, we have performed a validation in ex vivo PDOs and in the best available mouse model of LS. Therefore, we believe that our results are robust and merit being further developed in larger Phase II/III studies. Moreover, regarding the transcriptomic data derived from this study, it is worth noting that the gene signatures of HD and LD naproxen display a consistent overlap in the pathways deregulated. These results were also further corroborated by enrichment analysis combining the transcriptomic data from both dose levels. However, there is relatively modest overlap in the individual genes that were affected by both doses. This finding likely reflects stochastic inputs into NSAID pharmacodynamics, and possibly variations in the numbers of different cell types in biopsies analysed using bulk RNAseq, which converge into the same final signalling pathways. Future single-cell RNAseq studies of colorectal mucosal biopsies from patients taking NSAIDs may provide insights into the contribution of stochastic versus deterministic inputs into individual NSAID pharmacodynamics.28 29 Therefore, at present it is recommended that further naproxen studies leverage signatures related to the affected pathways rather than individual genes. Sixth, we were not able to discern the immune cell type activated by naproxen, as well as the mechanism by which LD and HD naproxen target different cell populations in the colon crypt (crypt top vs crypt base). This is a limitation secondary to lack of access to technology with adequate resolution to provide these results. At the time of trial design, single-cell transcriptomics was a nascent technology and therefore we did not articulate provisions to acquire and store single-cell suspensions. Thus, the answer to these two questions will have to await further clinical studies utilising this technology to assess the transcriptomic effects in individual cell populations as well as to provide an assessment on the abundance of cell types by using specific markers for immunophenotyping and distinguishing stem cells from differentiated daughter cells.
In conclusion, naproxen should be considered a potential strategy for immune interception in patients with LS via activation of resident immune cells in the colorectal mucosa, thus having the potential to enhance the activity of vaccines to be developed for this disease. Naproxen effects are not related to an increase in the number of immune cells or morphologic changes in the colorectal mucosa; however, it is possible that naproxen exerts an effect in the maturation of stem cells and expansion of the differentiated epithelial cells.
Acknowledgments
We thank the patients and their families for their participation. We thank the clinical coordinators from all the study sites (Valerie O Sepeda, Chinedu I Ukaegbu, Michelle Westover, Erika Koeppe) and the UTMDACC Clinical Cancer Prevention Research Core for their assistance in the conduction of this study. This project was supported in part by the Translational Molecular Pathology-Immunoprofiling lab at the UTMDACC Department Translational Molecular Pathology (Wei Lu, Lakshmi Kakarala, Mei Jiang, Jianling Zhou, Ou Shi and Jocelyn Coronel). We thank the staff of the Microarray and Sequencing Core Facility at UTMDACC and Weill Cornell Medical College for the assistance with RNA sequencing. The authors are grateful to Charles M Bowen for critically reading the manuscript and the anonymous reviewers for their helpful comments that improved the manuscript.
References
Footnotes
Twitter @koolmolecule, @inhoutes, @vic_rev, @evilarsan
SML and EV contributed equally.
Contributors SL and EV had full access to all the data in the study and take responsibility for the integrity of the data and the accuracy of the data analysis. YNY, LV, LK, SS, RS, ES, AU, PM, PB, SL and EV helped in the study concept and design. Identification of study subjects and provision of clinical information was performed by PML, YNY, ES, RL, PK, JS, and EV. ES, ER, AU, PM, LV, PB and EV provided supervision to the clinical study. LRU, OG, PB, GM and LM processed and prepared case samples for analysis, sequencing and mass spectrometry analysis. AFC, LS, MWT and IW helped in pathology interpretation and histomorphometry analysis. WW, KC, MR, DL, JJL, SL and EV analysed sequencing data and performed statistical analysis. LRU, WW, KC, PB, MR, OG, SL and EV analysed and discussed the data. LRU, WW, PB, OG, AFC, SL and EV helped in writing of the manuscript. All authors edited and approved the content of this manuscript.
Funding This work was supported by grants R01 CA219463 and contract HHSN261201200034I (US National Institutes of Health/National Cancer Institute), and a gift from the Feinberg Family to EV; a grant from the Emerson Cancer Collective Research Foundation (ECCRF 192069), and contract HHSN261201500039I (US National Institutes of Health/National Cancer Institute) to SL; and P30 CA016672 (US National Institutes of Health/National Cancer Institute) to the University of Texas MD Anderson Cancer Center Core Support Grant.
Competing interests JS has a consulting role with Janssen Research and Development, and Cancer Prevention Pharmaceuticals. IW has an advisory role with Genentech/Roche, Bayer, Bristol-Myers Squibb, AstraZeneca/Medimmune, Pfizer, HTG Molecular, Asuragen, Merck, GlaxoSmithKline, Guardant Health and MSD, has received speaker fees from Medscape, MSD, Genentech/Roche, Pfizer and received research support from Genentech, Oncoplex, HTG Molecular, DepArray, Merck, Bristol-Myers Squibb, Medimmune, Adaptive, Adaptimmune, EMD Serono, Pfizer, Takeda, Amgen, Karus, Johnson & Johnson, Bayer, Iovance, 4D, Novartis, and Akoya. SL and EV are co-principal investigators in an NIH/NCI U01 award with co-investigators employed by Nouscom, s.r.l. EV has a consulting and advisory role with Janssen Research and Development and Recursion Pharma.
Patient and public involvement Patients and/or the public were involved in the design, or conduct, or reporting or dissemination plans of this research. Refer to the Methods section for further details.
Patient consent for publication Not required.
Provenance and peer review Not commissioned; externally peer reviewed.
Data availability statement Data are available in a public, open access repository. RNA-seq files have been deposited in GEO. The following links can be used to access the data for reanalysis: GSE144381 https://www.ncbi.nlm.nih.gov/geo/query/acc.cgi?acc=GSE144381