Article Text

Abstract
Objective Chronic hepatitis B virus (HBV) infection is characterised by HBV-specific CD8+ T cell dysfunction that has been linked to Tcell exhaustion, a distinct differentiation programme associated with persisting antigen recognition. Recently, Thymocyte Selection-Associated High Mobility Group Box (TOX) was identified as master regulator of CD8+ T cell exhaustion. Here, we addressed the role of TOX in HBV-specific CD8+ T cell dysfunction associated with different clinical phases of infection.
Design We investigated TOX expression in HBV-specific CD8+ T cells from 53 HLA-A*01:01, HLA-A*11:01 and HLA-A*02:01 positive patients from different HBV infection phases and compared it to hepatitis C virus (HCV)-specific, cytomegalovirus (CMV)-specific, Epstein-Barr virus (EBV)-specific and influenza virus (FLU)-specific CD8+ T cells. Phenotypic and functional analyses of virus-specific CD8+ T cells were performed after peptide-loaded tetramer-enrichment and peptide-specific expansion.
Results Our results show that TOX expression in HBV-specific CD8+ T cells is linked to chronic antigen stimulation, correlates with viral load and is associated with phenotypic and functional characteristics of T-cell exhaustion. In contrast, similar TOX expression in EBV-specific and CMV-specific CD8+ T cells is not linked to T-cell dysfunction suggesting different underlying programmes. TOX expression in HBV-specific CD8+ T cells is also affected by targeted antigens, for example, core versus polymerase. In HBV-specific CD8+ T cells, TOX expression is maintained after spontaneous or therapy-mediated viral control in chronic but not self-limiting acute HBV infection indicating a permanent molecular imprint after chronic but not temporary stimulation.
Conclusion Our data highlight TOX as biomarker specific for dysfunctional virus-specific CD8+ T cells in the context of an actively persisting infection.
- T lymphocytes
- chronic viral hepatitis
- hepatitis B
- immune response
Data availability statement
All data relevant to the study are included in the article or uploaded as online supplemental information.
This is an open access article distributed in accordance with the Creative Commons Attribution Non Commercial (CC BY-NC 4.0) license, which permits others to distribute, remix, adapt, build upon this work non-commercially, and license their derivative works on different terms, provided the original work is properly cited, appropriate credit is given, any changes made indicated, and the use is non-commercial. See: http://creativecommons.org/licenses/by-nc/4.0/.
Statistics from Altmetric.com
Significance of this study
What is already known on this subject?
Transcriptional regulation of hepatitis B virus (HBV)-specific CD8+ T cell exhaustion in chronic HBV infection is poorly understood.
Recently, the transcriptional regulator Thymocyte Selection-Associated High Mobility Group Box (TOX) was identified as key factor determining the T cell exhaustion programme in mice.
What are the new findings?
A significant fraction of chronically stimulated HBV-specific CD8+ T cells express TOX although at lower levels compared with hepatitis C virus-specific CD8+ T cells.
Enhanced TOX expression is linked to chronic antigen stimulation of HBV-specific CD8+ T cells.
TOX expression is imprinted in HBV-specific CD8+ T cells even after spontaneous resolution (HBsAg seroconversion) of chronic HBV infection or after Nulcelos(t)ide analogues therapy-mediated viral suppression.
TOX expression of HBV-specific CD8+ T cells is clearly associated with phenotypic and functional characteristics of T-cell exhaustion.
TOX expression in HBV-specific CD8+ T cells is also affected by different targeted antigens, for example, core versus polymerase.
TOX expression marks dysfunctional virus-specific CD8+ T cells only in the context of an actively persisting infection.
How might it impact on clinical practice in the foreseeable future?
These findings highlight that the transcription factor and epigenetic modifier TOX is a biomarker that marks dysfunctional HBV-specific CD8+ T cells specifically in the context of an actively persisting infection and may thus be used to guide immunotherapeutic approaches.
Introduction
Virus-specific CD8+ T cells play a central role in the outcome and disease pathogenesis of hepatitis B virus (HBV) infection. Viral clearance is associated with the emergence of a functional CD8+ T cell response.1 2 In chronic HBV (cHBV) infection, however, the HBV-specific CD8+ T cell response is impaired. Although HBV-specific CD8+ T cells are present in cHBV infection, their frequency is much lower compared with acute self-limiting infection. Still, these HBV-specific CD8+ T cells most likely contribute to pathogenesis and partial endogenous viral control. This is reflected by the link between the presence of virus-specific CD8+ T cell responses and the phase of chronic infection as it has been shown in several studies.3–6 For example, HBV precore antigen (HBeAg)- cHBV infection that is characterised by low HBV DNA titres and normal alanine aminotransaminase (ALT) levels is associated with stronger T cell responses compared with active chronic hepatitis B (CHB) that typically occurs in concert with higher viral loads and higher ALT levels.4 Others have also reported an inverse association between the strength of the HBV-specific CD8+ T cell response and viral load in cHBV infection.5 Limited strength of HBV-specific CD8+ T cell responses in cHBV infection is at least partially due to CD8+ T cell exhaustion.7–12 The transcriptional and epigenetic networks driving HBV-specific CD8+ T cell exhaustion, however, are still only poorly understood.
A series of recent studies primarily performed in the lymphocytic choriomeningitis virus (LCMV) mouse model have shown that robust expression of the transcriptional regulator Thymocyte Selection-Associated High Mobility Group Box (TOX) is a critical factor determining and maintaining exhausted CD8+ T cells.13 14 In human viral infection, thus far, TOX expression has been studied in virus-specific CD8+ T cells targeting human immunodeficiency virus (HIV),15 chronic hepatitis C virus (HCV),13 cytomegalovirus (CMV) and Epstein-Barr virus (EBV).16 These studies revealed that high TOX expression is not exclusively linked to T cell exhaustion in humans.16 No information is currently available about the role of TOX in HBV-specific CD8+ T cells including its association with T cell exhaustion, in particular phenotype and function, as well as with the clinical phase of HBV infection. To address this important issue, we set out to analyse TOX expression in HBV-specific CD8+ T cells obtained from patients of different HBV infection phases. Our results show that TOX is differentially expressed in HBV-specific CD8+ T cells, linked to chronic antigen stimulation, correlated with viral load, associated with phenotypic and functional characteristics of T cell exhaustion and maintained even after spontaneous or therapy-mediated viral control in chronic infection indicating a permanent molecular imprint on chronicity-associated HBV-specific CD8+ T cells. Thus, our data highlight TOX as a biomarker that marks dysfunctional HBV-specific CD8+ T cells specifically in the context of an actively persisting infection and may thus be used to guide immunotherapeutic approaches.
Experimental procedures
Study cohort
Blood samples were obtained from patients with viral hepatitis recruited at the Department of Medicine II of the University Hospital Freiburg, Germany and at the Department of Gastroenterology, Hepatology and Endocrinology, Hannover Medical School, Hannover, Germany. Written informed consent was given by all donors prior to blood donation. Patients were classified into different clinical phases of cHBV infection according to European Association for the Study of the liver (EASL) guideline of 2017,17 which considers the presence of HBeAg, HBV DNA levels, transaminase levels (ALT and aspartat aminotransferase (AST)), and the presence or absence of liver inflammation. Nulcelos(t)ide analogues (NUC)-treated patients were included in the HBeAg- CHB patient cohort if they demarcate the characteristics of a CHB before initiation of antiviral therapy with NUC. Characteristics of included patients are detailed in online supplemental SI tables 1–9.
Supplemental material
Characteristics of patients with chronic HBV infection
Peptides and tetramers
Peptides of immunodominant HLA-A*01:01-, HLA-A*02:01-, HLA-A*11:01-restricted HBV-derived epitopes (HBVcore18: FLPSDFFPSV, HBVcore30: LLDTASALY, HBVcore141: STLPETTVVRR, HBVpol455: GLSRYVARL), HLA-A*02:01- restricted HCV-derived epitopes (NS31073: CINGVCWTV, NS31406: KLSGLGLNAV) as well as CMV-derived epitope (pp65495: NLVPMVATV), EBV-derived epitope (BMFL1280: GLCTLVAML) and influenza virus (FLU)-derived epitope (M158: GILGFVFTL) were synthesised from Genaxxon, Germany. HLA class I epitope-specific tetramers were generated through conjugation of biotinylated peptide/HLA class I monomers with PE-conjugated streptavidin (ProZyme, USA) at a peptide/HLA I:streptavidin molar ratio of 5:1. Of note, targeted epitopes of virus-specific CD8+ T cells were previously analysed for viral sequence mutations as described in the online supplemental material. T cell responses of patients harbouring viral sequence mutations in the targeted epitope were excluded.
Peptide/HLA class I tetramer-based magentic bead enrichment
Enrichment of virus-specific CD8+ T cells was carried out as previously described18 19 and their ex vivo frequency was calculated according to Alanio et al.18 Afterwards, the enriched virus-specific CD8+ T cells were used for multiparametric flow cytometry analyses as described in the online supplemental material.
Expansion of virus-specific CD8+ T cells and assessment of CD8+ T-cell function
Functional analyses of virus-specific CD8+ T cells were performed after 14 days of in vitro expansion with epitope-specific peptides as described in the online supplemental material.
Statistics
The statistical analyses were conducted with GraphPad Prism V.8 (GraphPad Prism Software, USA) and R studio (R studio, USA). Bar charts show median values with IQR. Statistical tests used are depicted in the figure legends. Levels of significance are indicated as follows: *p<0.05; **p<0.01; ***p<0.001; ****p<0.0001.
Results
Differential TOX expression in HBV-specific CD8+ T cells is linked to the clinical phase of infection
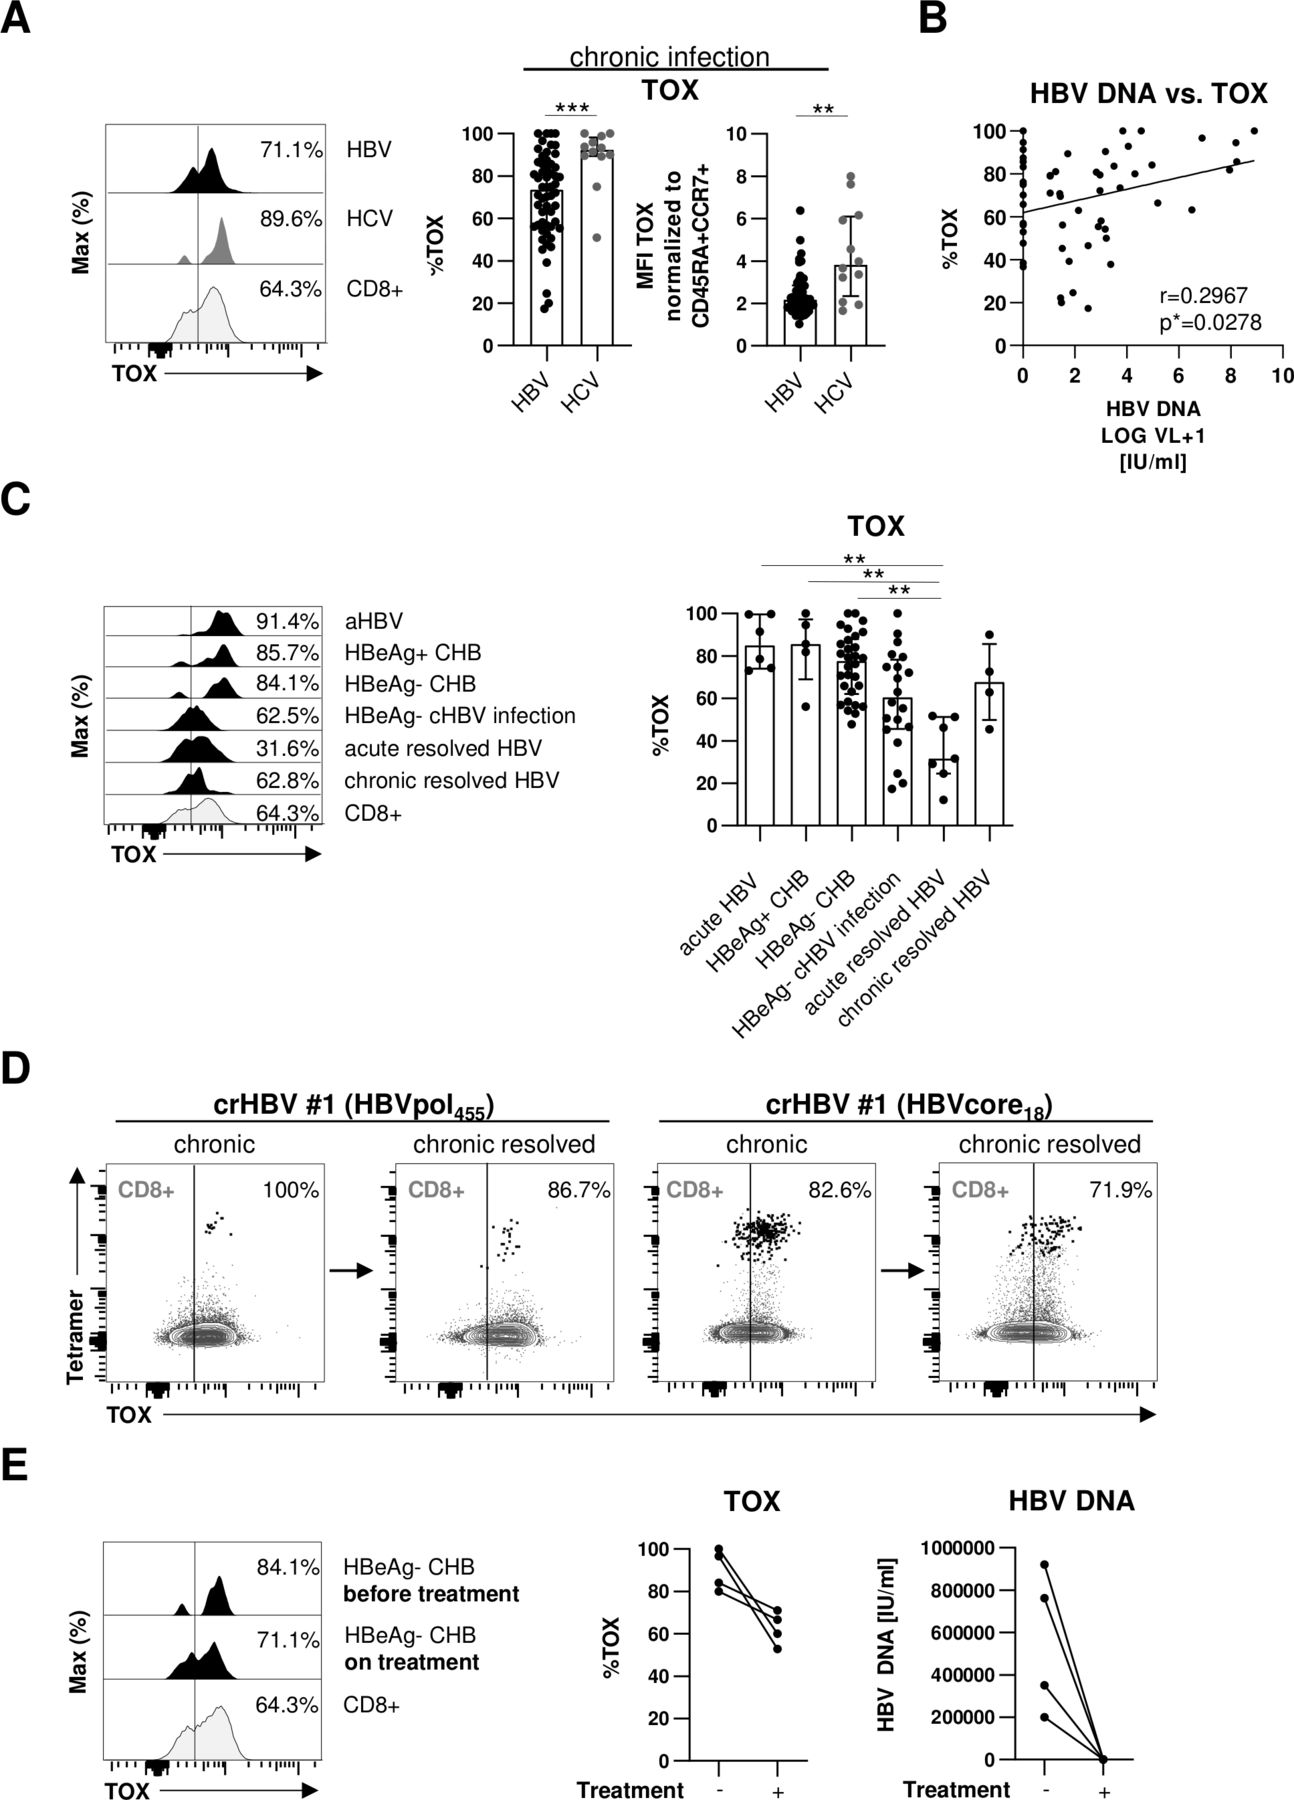
In a first set of experiments, we analysed the expression of TOX in HLA-A*02:01-restricted HBV-and HCV-specific CD8+ T cells in 46 chronically HBV-infected and 12 chronically HCV-infected patients. To increase the detection rate of virus-specific CD8+ T cells ex vivo, we performed peptide/HLA-A*02:01 tetramer-based enrichment as previously reported19 20 using two HBV epitope-specific and two HCV epitope-specific HLA-A*02:01 tetramers. As shown in representative plots and summarised for all analysed subjects in figure 1A, we found a significant TOX expression in HBV-specific CD8+ T cells that was, however, lower compared with HCV-specific CD8+ T cells. We next addressed whether the high variability in the TOX expression of HBV-specific CD8+ T cells (figure 1A) is associated with viral load by performing correlation analysis. As shown in figure 1B, we indeed found a moderate positive correlation between viral load and TOX expression suggesting that antigen levels may drive TOX expression in HBV-specific CD8+ T cells. Since viral loads and viral replication are also reflected by the different clinical phases of HBV infection, we also compared TOX expression in HBV-specific CD8+ T cells obtained from patients in different clinical phases of infection, specifically from acutely infected patients and patients with HBeAg+ or HBeAg- CHB, HBeAg- cHBV infection and acute-resolved versus chronic-resolved HBV infection. Characteristics of these patients are summarised in table 1. We observed a differential TOX expression in these patient groups with the highest expression in acutely infected patients and patients with HBeAg+ or HBeAg− CHB, followed by HBeAg- cHBV infection (figure 1C). TOX expression was lowest in subjects after acute-resolving infection (figure 1C), indicating that enhanced TOX expression is linked to antigen stimulation of HBV-specific CD8+ T cells. Interestingly, HBV-specific CD8+ T cells obtained after resolution of cHBV infection (defined by HBV surface antigen (HBsAg) seroconversion) still displayed high TOX expression (figure 1C). This is also shown in figure 1D in one patient who was followed longitudinally. Indeed, although expression of TOX decreased slightly after resolution of chronic infection, it clearly remained positive suggesting that the chronic imprint is maintained even after antigen elimination. To further address the impact of ongoing HBV viremia on TOX expression of HBV-specific CD8+ T cells, we longitudinally analysed the HBV-specific CD8+ T cell response in four patients after initiation of antiviral therapy with NUC. As shown in figure 1E for one representative CD8+ T cell response and for all four tested HBV-specific CD8+ T cell populations, TOX expression in HBV-specific CD8+ T cells was slightly decreasing after initiation of antiviral therapy in concert with a significant drop of viremia to undetectable levels. However, the expression was still clearly detectable and higher compared with acute-resolved infection (figure 1C) further indicating that TOX expression is maintained in chronically stimulated CD8+ T cells even after elimination of viral replication.

TOX expression in HBV-specific CD8+ T cells is associated with different phases of chronic HBV infection. (A) Expression analyses of TOX in peptide/HLA-A*02:01 tetramer-enriched HBV-specific CD8+ T cells obtained from chronically HBV-infected patients and HCV-specific CD8+ T cells of patients with chronic HCV infection. Representative flow cytometric histogram plots show the gating of TOX expression (black: HBV-specific CD8+ T cells; dark grey: HCV-specific CD8+ T cells; grey: bulk CD8+ T cells). Summarised frequencies of TOX-expressing HBV-specific versus HCV-specific CD8+ T cells are depicted. (B) Correlation analyses of serum HBV DNA and the frequency of HBV-specific CD8+ T cells expressing TOX obtained from the chronically HBV-infected patients are depicted. (C) TOX expression in HBV-specific CD8+ T cells according to acute HBV infection, different phases of chronic HBV infection and of patients who resolved an acute or chronic HBV infection was investigated. Representative flow cytometric histogram plots and statistical graph depicting gating and frequencies of TOX-expressing HBV-specific CD8+ T cells (black: HBV-specific CD8+ T cells; grey: bulk CD8+ T cells) are displayed. (D) Longitudinal analyses of one patient at the HBeAg- cHBV infection stage and after HBsAg seroconversion are depicted in the representative flow cytometric dot plots (black: HBV-specific CD8+ T cells, grey: bulk CD8+ T cells). Gating and percentages are shown. (E) Representative flow cytometric histograms and statistical graph showing TOX-expressing HBV-specific CD8+ T cells derived from four HBeAg- CHB patients before and on NUC treatment (black: HBV-specific CD8+ T cells; grey: bulk CD8+ T cells). Corresponding serum HBV DNA are depicted. Each dot represents one HBV-specific CD8+ T cell response: HBV: HBeAg+ CHB, n=5; HBeAg- CHB/NUC-treated HBeAg- CHB, n=30 and HBeAg- cHBV infection, n=20; acute-resolved HBV infection, n=7; chronic-resolved HBV infection, n=4; HCV: n=12. Bar charts show the median value with IQR. Statistical significance was assessed by Mann-Whitney comparison test (A, left), unpaired t-test with Welch’s correction (A, right), Pearson R correlation (B), Kruskal-Wallis test including Dunn’s multiple comparisons test (C) and Wilcoxon test (E) (*p<0.05; **p<0.01; ***p<0.001). CHB, chronic hepatitis B; cHBV, chronic hepatitis B virus; HCV, hepatitis C virus; NUC, nulcelos(t)ide analogues; TOX, Thymocyte Selection-Associated High Mobility Group Box.
TOX expression is linked to phenotypic characteristics of T cell exhaustion
As TOX has been recently reported to be a marker for T cell exhaustion, we next comprehensively analysed the coexpression of TOX with other known T cell surface markers indicative of exhaustion in chronic infection (PD1, KLRG1 and CD57).15 21 As shown in figure 2A for one representative patient in a histogram and for up to 46 chronically HBV-infected patients analysed, we found a stronger expression of all three markers in TOX+ versus TOX- HBV-specific CD8+ T cells. Next, we analysed whether the expression of TOX is also linked to a transcription factor pattern that has previously been reported to characterise T cell exhaustion such as high EOMES and Helios expression.22 23 These analyses revealed a coexpression of TOX with both, EOMEShi and Helios (figure 2B). We also found a higher expression of T cell factor 1 (TCF-1) in TOX+ versus TOX- HBV-specific CD8+ T cells (figure 2C). TCF-1 has previously been reported to be central for the maintenance of the virus-specific CD8+ T cell response in chronic viral infection.24–26 In contrast, the antiapoptotic molecule BCL-2 was increased in TOX- versus TOX+ HBV-specific CD8+ T cells (figure 2C). This finding is in line with a higher survival capacity of not terminally exhausted TOX- HBV-specific CD8+ T cells. Next, we performed a comparative evaluation of the phenotypes of TOX+ versus TOX- HBV-specific CD8+ T cells. Specifically, we concatenated flow cytometry data obtained from TOX+ and TOX- HBV-specific CD8+ T cells and conducted t-distributed stochastic neighbour embedding (t-SNE) analysis (figure 2D). A distinct topographical clustering of TOX+ versus TOX- HBV-specific CD8+ T cells was observed based on markers indicative of exhaustion and memory formation (figure 2D). This supports the hypothesis that TOX expression segregates phenotypic distinct populations of HBV-specific CD8+ T cells with a polarisation of TOX+ HBV-specific CD8+ T cells towards terminal differentiation/more severe exhaustion. We, therefore, asked whether TOX is also differentially expressed in the distinct subsets of exhausted HBV-specific CD8+ T cells. We have previously reported that HBV-specific CD8+ T cells in chronic infection are not homogeneous but rather consist of heterogeneous subsets of primarily less differentiated progenitor/memory-like cells that are CD127+PD1+ and further differentiated/more severely exhausted CD127-PD1+ cells.20 As shown in online supplemental SI figure 1, the CD127/PD1 subset distribution of HBV-specific CD8+ T cells differ in patients within different clinical phases of HBV infection. Indeed, we found a higher frequency of the CD127-PD1+ population in patients with HBeAg+ CHB and HBeAg− CHB compared with NUC-treated HBeAg− CHB and HBeAg− cHBV infection patients. Remarkably, this more severely exhausted population is not reduced in patients with chronic-resolved HBV infection. In comparison to CD127+PD1+ HBV-specific CD8+ T cells, a higher TOX expression was found within the terminally exhausted CD127-PD1+ HBV-specific CD8+ T cell population (figure 2E). Thus, we next asked whether the different subset distribution may explain differential TOX expression of HBV-specific CD8+ T cells in different clinical phases of infection. Indeed, we identified a clear correlation between CD127-PD1+ HBV-specific CD8+ T cells and the frequency of TOX-expressing HBV-specific CD8+ T cells in chronically HBV-infected patients, whereas an inverse correlation was found between the TOX expression and frequency of CD127+PD1+ HBV-specific CD8+ T cells (figure 2F). Combined, these results indicate that the level of TOX expression is associated with the degree of exhaustion in cHBV infection.
Supplemental material

TOX-expressing HBV-specific CD8+ T cells exhibit a phenotypic profile of T-cell exhaustion. Phenotypical analyses of peptide/HLA-A*02:01 tetramer-enriched TOX+ versus TOX- HBV-specific CD8+ T cells obtained from chronically HBV-infected patients. The expression of (A) PD1, KLRG1 and CD57, (B) of the transcription factors EOMES and Helios as well as (C) TCF-1 and the antiapoptotic molecule BCL-2 of TOX+ and TOX- HBV-specific CD8+ T cell populations were assessed. (A–C) Representative flow cytometric histograms including gating of the individual markers are displayed (black: TOX+ or TOX- HBV-specific CD8+ T cells; grey: bulk CD8+ T cells). (D) t-SNE representation analysis of concatenated flow cytometry data obtained from TOX+ versus TOX- HBV-specific CD8+ T cells are shown. Expression levels of PD1, KLRG1, EOMES, CD57 and TCF-1 are plotted on the t-SNE plot. (E) TOX expression was determined in CD127/PD1-based subsets of HBV-specific CD8+ T cells. Subset definition, specifically CD127+PD1+ memory like versus CD127-PD1+ more severely exhausted cells, is depicted in the representative flow cytometry dot plot (black: TOX+ HBV-specific CD8+ T cells; grey: bulk CD8+ T cells). (F) Correlation analysis of the frequency of CD127/PD1 subsets on HBV-specific CD8+ T cells and the frequency of HBV-specific CD8+ T cells expressing TOX obtained from the chronically HBV-infected patients are depicted. Each dot represents one HBV-specific CD8+ T cell population: HBeAg+ CHB, n=5; HBeAg-CHB/NUC-treated HBeAg- CHB, n=30 and HBeAg- cHBV infection, n=20. Bar charts show the median value with IQR. The following statistical analyses were performed by paired t-test (A, KLRG1 and CD57, (B, C, E) and Wilcoxon test (A, PD1) and Pearson R correlation (F) (*p<0.05; ** p<0.01; ***p<0.001; ****p<0.0001). CHB, chronic hepatitis B; cHBV, chronic hepatitis B virus; NUC, nulcelos(t)ide analogues; TOX, Thymocyte Selection-Associated High Mobility Group Box; t-SNE, t-distributed stochastic neighborneighbour embedding.
Differential TOX expression in HBV pol455-versus HBV core18-specific CD8+ T cells
Previously, we and others have reported that HBV-specific CD8+ T cells targeting core versus polymerase epitopes significantly differ in frequency, phenotype and function.20 27 In particular, in comparison to HBV core-specific CD8+ T cells, a higher frequency of HBV polymerase-specific CD8+ T cells expressed markers indicative of more severe T cell exhaustion. Therefore, we compared TOX expression of HBV core18-specific and HBV pol455-specific CD8+ T cells in our cohort of chronically HBV-infected HBeAg+ and HBeAg– patients. As shown in figure 3A and in agreement with our previous study,20 we were able to detect HBV core18-specific CD8+ T cells in a significantly higher frequency compared with HBV pol455-specific CD8+ T cells. More importantly, we found a significantly higher TOX expression in HBV pol455-specific CD8+ T cells compared with HBV core18-specific CD8+T cells (figure 3B). To rule out that the observed differences are only specific for a given epitope, we performed additional analyses with the HLA-A*01:01-restricted HBV core30 and the HLA-A*11:01-restricted HBV core141 epitopes but could not detect specific differences between the TOX expression of different HBV core epitope-specific CD8+T cells (online supplemental SI figure 2) Overall, these data are in line with our previous assumption that HBV core epitope-specific CD8+ T cell responses are less severely exhausted compared with HBV pol455-specific CD8+ T cells.
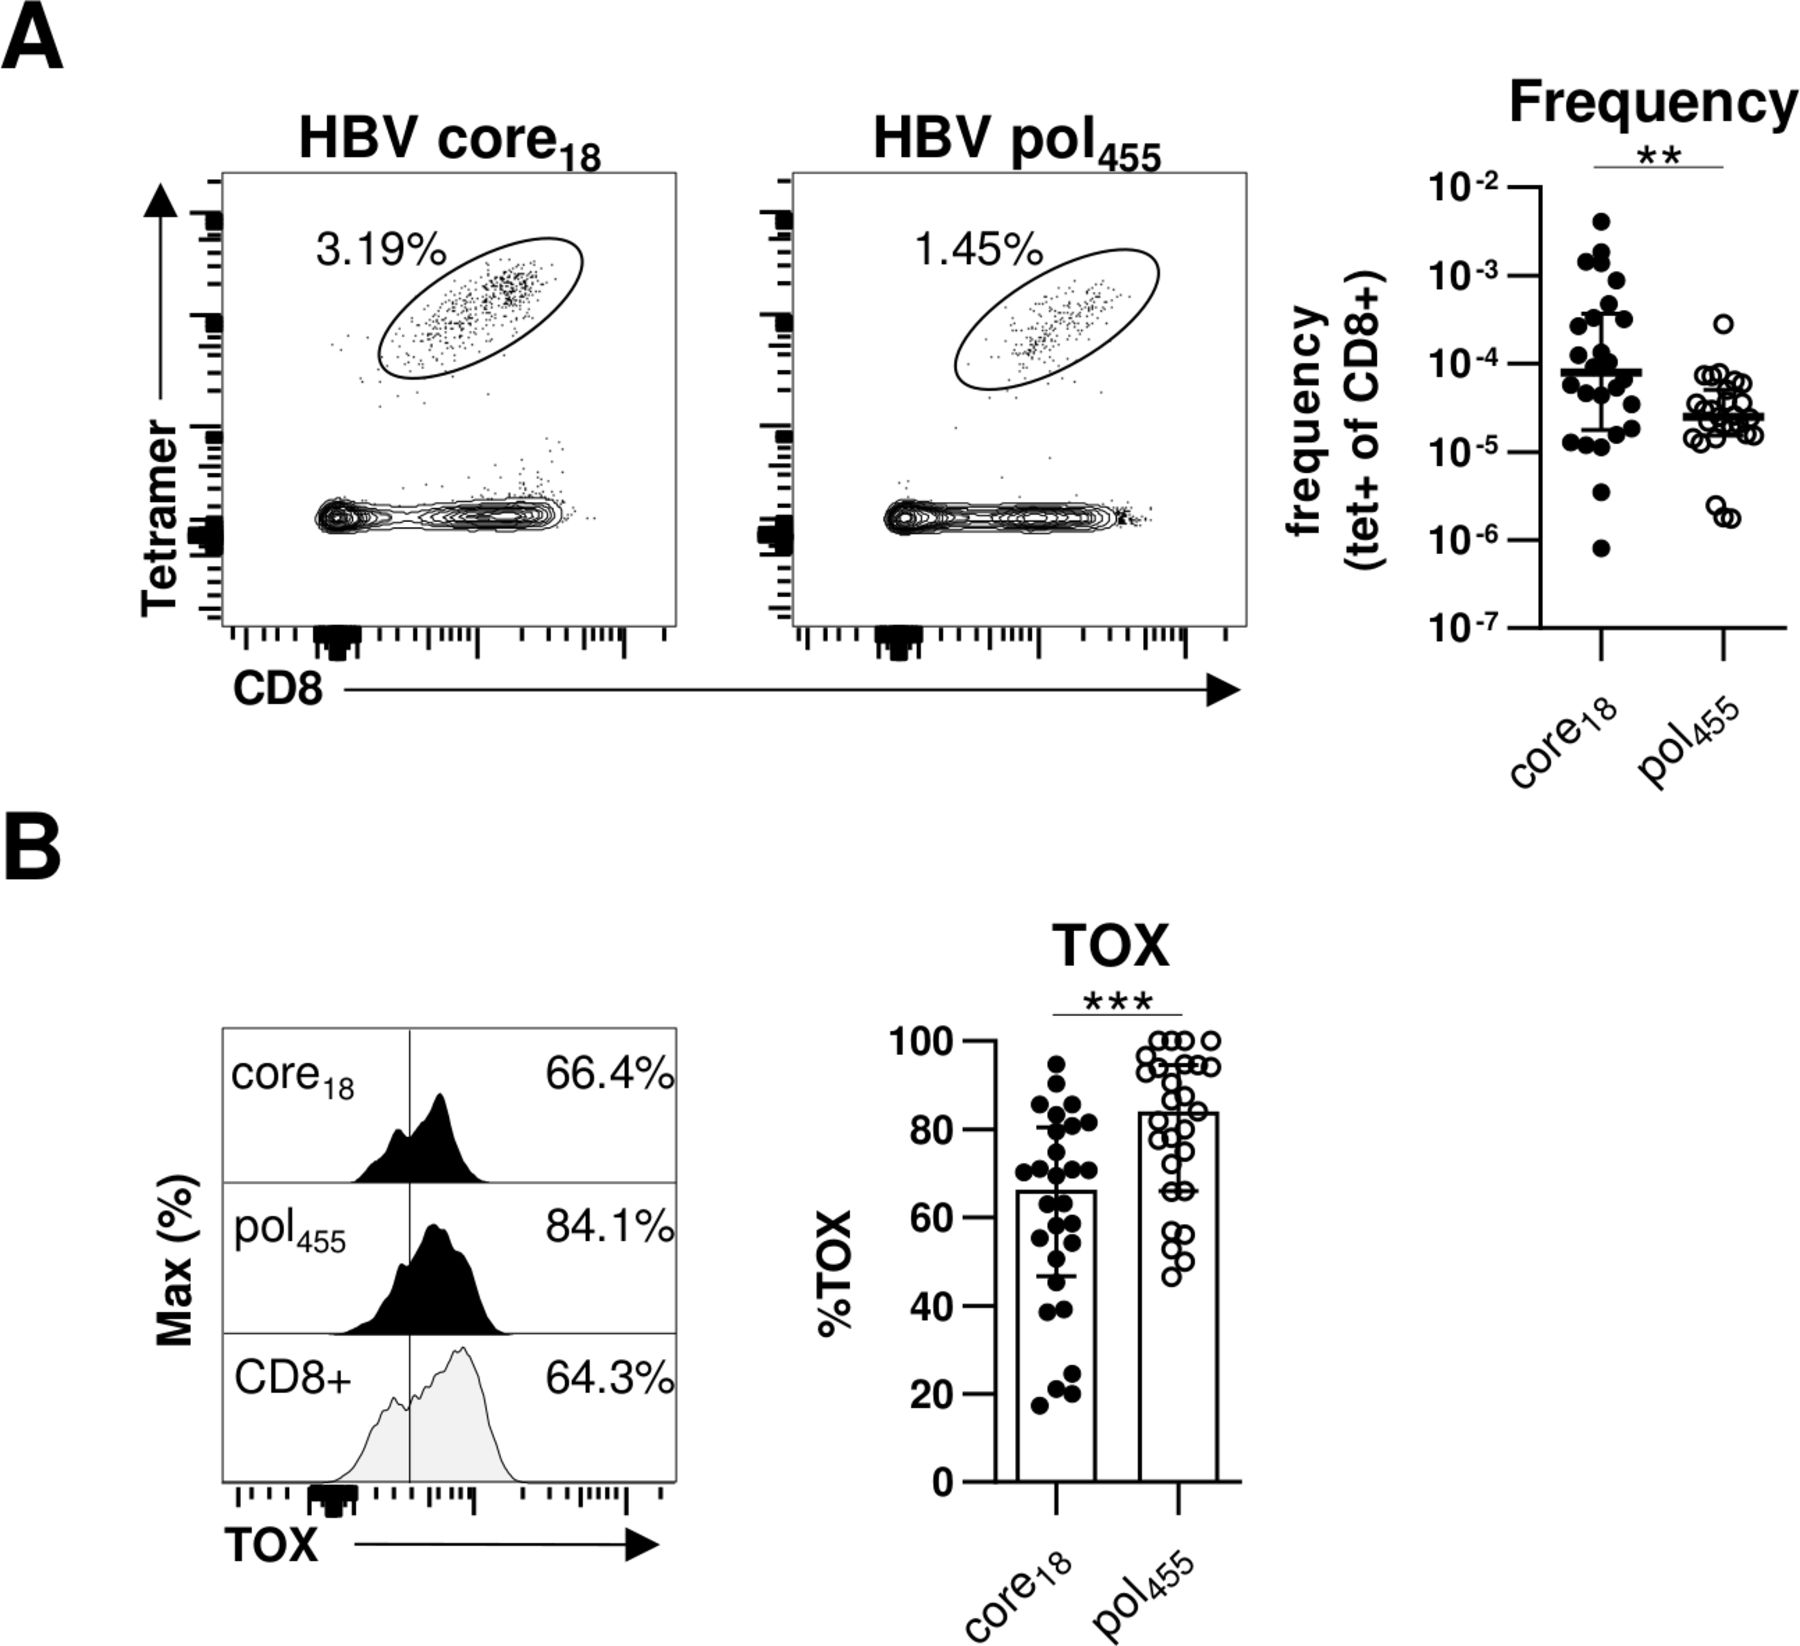
TOX is differently expressed in HBV-specific CD8+ T cells targeting different viral epitopes. Flow cytometric analyses of TOX expression by HBV core18-specific and HBV pol455-specific CD8+ T cells obtained from chronically HBV-infected patients. (A) Representative flow cytometry dot plots show circulating peptide/HLA-A*02:01 tetramer-enriched HBV core18- and HBV pol455-specific CD8+ T cells (black) and bulk CD8+ T cells (grey). The frequency of HBV epitope-specific CD8+ T cells within the total CD8+ T cell population is indicated. Enumerated frequencies of enriched HBV epitope-specific CD8+ T cells within the bulk CD8+ T cell population are depicted in the statistical graph. (B) Representative flow cytometric histograms of the TOX expression in HBV epitope-specific CD8+ T cells including the gating and statistical graph summarising the frequencies of TOX-expressing HBV epitope-specific CD8+ T cells are displayed (black: HBV core18-specific or pol455-specific CD8+ T cells; grey: bulk CD8+ T cells). Each dot represents one HBV epitope-specific CD8+ T cell population: HBeAg+ CHB, n=5; HBeAg- CHB/NUC-treated HBeAg- CHB, n=30 and HBeAg- cHBV infection, n=20. Bar charts indicate the median value with IQR. Statistical analyses were performed via Mann-Whitney comparison tests (A) and unpaired t-test with Welch’s correction (B). **P<0.01; ***P<0.001. CHB, chronic hepatitis B; cHBV, chronic hepatitis B virus; NUC, Nulcelos(t)ide analogues; TOX, Thymocyte Selection-Associated High Mobility Group Box.
TOX is associated with impaired functionality of HBV-specific CD8+ T cells
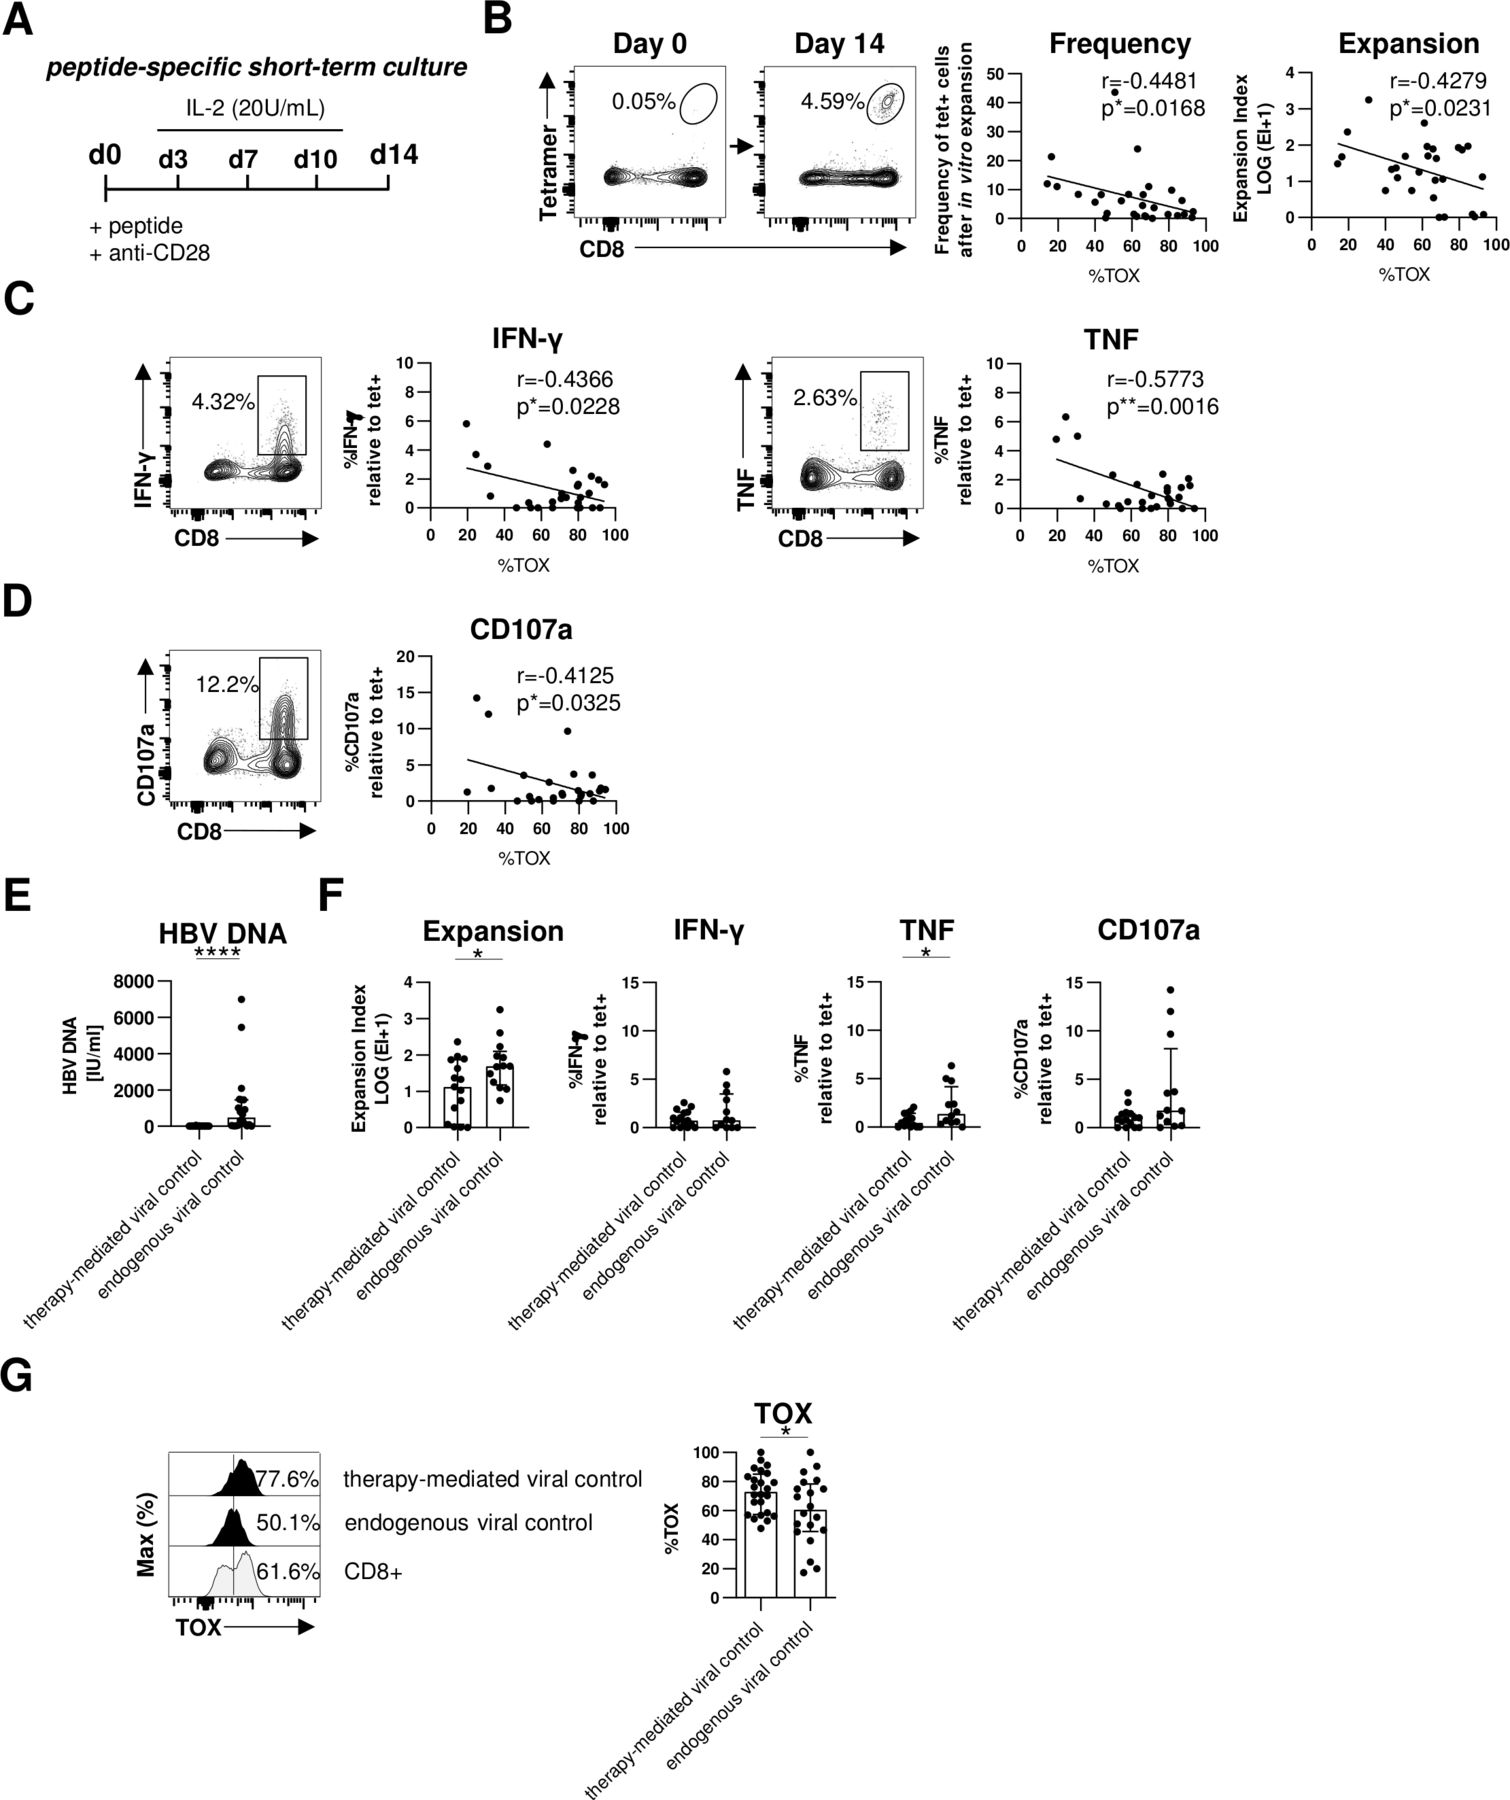
A hallmark of T cell exhaustion is impairment of effector functions. Therefore, we next assessed whether expression of TOX in HBV-specific CD8+ T cells is also linked to altered effector functions. Since the frequency of HBV-specific CD8+ T cells is too low for functional analyses ex vivo, we determined the expansion capacity in a 2-week peptide-specific stimulation in vitro (figure 4A). Of note, we have previously shown that ex vivo functionality correlated with the functional capacity of HBV-specific CD8+ T cells after in vitro expansion.21 As shown in figure 4B for one representative patient, we observed a significant expansion of HBV-specific CD8+ T cells on day 14 that were hardly detectable on baseline (day 0). Next, we correlated the expansion capacity (reflected by frequency and expansion index) of each HBV peptide-specific CD8+ T cell population with their respective TOX expression ex vivo. This analysis revealed an inverse correlation between TOX expression and the expansion capacity, for example, the higher TOX is expressed the lower is the expansion capacity of HBV-specific CD8+ T cell populations (figure 4B). We also found a similar inverse correlation between TOX expression and HBV-specific cytokine production (interferon-γ (IFN-γ) and tumour necrosis factor (TNF)) (figure 4C and online supplemental SI figure 3A) and degranulation as indicated by CD107a expression (figure 4D and online supplemental SI figure 3A). Thus, these results support that TOX not only marks cells with an exhaustion phenotype but is indeed also clearly associated with functional impairment.

TOX expression is linked to HBV-specific CD8+ T cell dysfunction in chronic HBV infection. Functional analyses of HBV-specific CD8+ T cells of HBeAg- patients with low viral load. (A) Peptide-specific short-term culture was performed for 14 days as depicted in the experimental scheme. (B) Representative flow cytometry plots showing peptide/HLA-A*02:01 tetramer and CD8 staining of HBV-specific CD8+ T cells before and after in vitro culture are displayed. Frequencies of HBV-specific CD8+ T cells within the total CD8+ T cell population are indicated. Expansion capacity was determined by the logarithmic fold-increase in absolute numbers of HBV-specific CD8+ T cells from day 0 to day 14 of in vitro culture. Frequency and expansion capacity of HBV-specific CD8+ T cells was correlated with the frequencies of TOX +cells of peptide/HLA-A*02:01 tetramer-enriched HBV-specific CD8+ T cells at day 0 of the expansion assay. (C, D) Representative dot plots showing cytokine production (IFN-γ and TNF) and degranulation (via the surrogate marker CD107a) by in vitro HBV peptide-expanded CD8+ T cells after HBV peptide-specific restimulation (gated on bulk CD8+ T cells) are displayed. Frequencies of IFN-γ+, TNF+ or CD107a+cells within the CD8+ T cell population are depicted. Correlation analyses were performed with TOX+ HBV-specific CD8+ T cells at day 0 (ex vivo) and the ratio of cytokine producing (IFN-γ+ or TNF+) or degranulating CD107a+ CD8+T cells divided by the frequency of HBV-specific CD8+ T cells after 14 days in vitro expansion as estimate for effector function in addition to proliferation. (E) Serum HBV DNA levels of patients with therapy-mediated (NUC-treated HBeAg- CHB) or endogenous viral control (HBeAg- cHBV infection) are depicted. (F) HBV-specific expansion and functionality of CD8+ T cells obtained from patients with therapy-mediated or endogenous viral control were comparatively analysed. (G) The ex vivo TOX expression was determined in HBV-specific CD8+ T cells obtained from patients with therapy-mediated or endogenous viral control. Representative flow cytometric histograms including TOX gating are depicted (black: HBV-specific CD8+ T cells; grey: bulk CD8+T cells). Each dot represents one HBV-specific CD8+ T cell population: NUC-treated HBeAg- cHB, n=15–24 and HBeAg- cHBV infection, n=12–20. Bar chart shows the median value with IQR. Statistical significance was assessed with Spearman R correlation (B), Pearson R correlation (C, D) and unpaired t-test with Welch’s correction (E, F). *P<0.05; ****p<0.0001. CHB, chronic hepatitis B; cHBV, chronic hepatitis B virus; IFN-γ, interferon-γ; IL-2, interleukin2; NUC, Nulcelos(t)ide analogues; TNF, tumor necrosis factor; TOX, Thymocyte Selection-Associated High Mobility Group Box.
Next, we asked whether these biological relevant associations of TOX can also be translated to the situation in vivo. For this, we compared the expression of TOX in HBV-specific CD8+ T cells in two different groups of chronically HBV-infected patients with low viral load; specifically, in HBeAg- patients who controlled viremia either by antiviral treatment (NUC-treated HBeAg- CHB cohort) or endogenously (HBeAg- cHBV infection cohort) (figure 4E and online supplemental SI figure 3B). In line with previous reports,4 we observed better effector functions, for example, expansion and TNF production, of HBV-specific CD8+ T cells in patients that endogenously controlled HBeAg- cHBV infection compared with patients with therapy-mediated viral control (figure 4F). This higher functionality of HBV-specific CD8+ T cells from patients with endogenously controlled HBeAg- cHBV infection was associated with a lower TOX expression compared with NUC-treated patients with HBeAg- CHB (figure 4G). These results clearly link lower TOX expression with endogenous control of HBV infection and support its biological relevance in the efficiency of HBV-specific CD8+ T cell responses.
TOX expression is not generally associated with CD8+ T-cell dysfunction
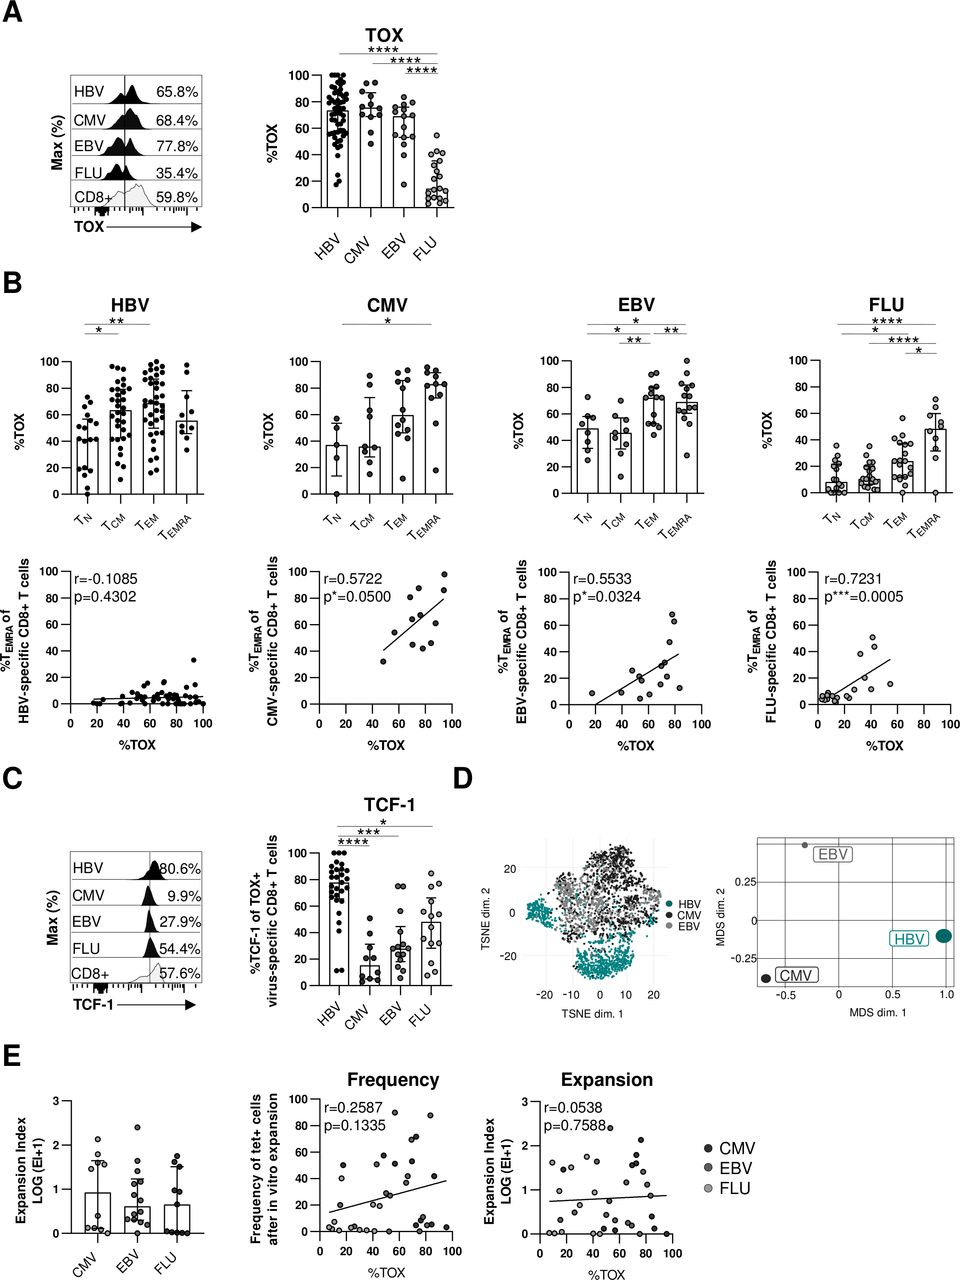
Next, we asked whether TOX selectively marks dysfunctional virus-specific CD8+ T cells in the context of an actively persisting viral infection such as cHBV infection or whether it is also expressed in other virus-specific CD8+ T cells in humans. We, therefore, first compared the expression of TOX in virus-specific CD8+ T cells targeting epitopes of actively persisting/cHBV (core18, pol455) versus latently persisting CMV (pp65495) or EBV (BMLF-1280) and self-limiting FLU (M158). As depicted in figure 5A, TOX is expressed in similarly high frequencies of HBV-specific, CMV-specific and EBV-specific CD8+ T cells but only in a minor fraction of FLU-specific CD8+ T cells. Thus, these results support that TOX expression is associated with persistent/prolonged antigen recognition in general. Since TOX has been identified as master regulator within the differentiation programme of T cell exhaustion in the context of persisting antigen recognition,13 14 28 we next addressed the question whether the similar TOX expression in virus-specific CD8+ T cells targeting persisting viruses is associated with similar CD8+ T cell differentiation. For this, we tested TOX expression in naïve (TN), central memory (TCM), effector memory (TEM) and terminally differentiated (TEMRA) T-cell differentiation stages among HBV-specific, CMV-specific, EBV-specific and FLU-specific CD8+ T cells using CCR7 and CD45RA expression for discrimination (online supplemental SI figure 4A). Highest TOX expression was detectable among terminally differentiated TEMRA stages (figure 5B) again indicating a role of repetitive/ongoing antigen recognition on the induction of TOX. Indeed, TOX expression also correlated with the frequency of TEMRA cells in CMV-specific, EBV-specific and FLU-specific CD8+ T cells, however, this was not the case for HBV-specific CD8+ T cells (figure 5B). This clearly suggests that TOX expression in HBV-specific CD8+ T cells is not linked to terminally differentiated cells. Consequently, TOX expression in HBV-specific CD8+ T cells is not linked to the same differentiation stage compared with CMV-specific and EBV-specific CD8+ T cells and thus marks different characteristics although TOX expression is similarly high. This is also supported by coexpression analysis of TOX with other transcription factors that are relevant for T cell differentiation, for example, TCF-1, EOMES and T-bet (figure 5C and online supplemental SI figure 4B). In particular, in HBV-specific CD8+ T cells TOX and TCF-1 are highly coexpressed in contrast to CMV-specific, EBV-specific and FLU-specific CD8+ T cells while coexpression of TOX and T-bet or EOMES is reduced indicating different transcription factor networks of TOX in HBV-specific versus CMV-specific, EBV-specific and FLU-specific CD8+ T cells. This is supported in a more comprehensive way by t-SNE and by multidimensional scaling analysis of flow cytometric data from TOX+ HBV-specific, CMV-specific and EBV-specific CD8+ T cells, both showing distinct clustering of HBV-specific versus CMV-specific and EBV-specific CD8+ T cell populations (figure 5D). Of note, in contrast to CMV-specific and EBV-specific CD8+ T cells, HBV-specific CD8+ T cells were characterised by a cluster of markers that are associated with T cell exhaustion (online supplemental SI figure 4C). To further elaborate on the different characteristics marked by TOX expression, we next correlated the functional capacity with the TOX expression of CMV-specific, EBV-specific and FLU-specific CD8+ T cells. In contrast to HBV-specific CD8+ T cells (figure 4B–D), neither the expansion factor (figure 5E) nor cytokine production or degranulation (online supplemental SI figure 4D) were associated with TOX expression in CMV-specific, EBV-specific and FLU-specific CD8+ T cells suggesting that TOX expression indicates dysfunction of virus-specific CD8+ T cells only in actively persisting infections such as cHBV infection.
TOX expression is not generally linked to dysfunction of virus-specific CD8+ T cells. Comparative analyses of TOX expression in virus-specific CD8+ T cells targeting HBV, CMV, EBV and FLU epitopes. (A) Representative histograms including the gating of TOX are displayed (black: virus-specific CD8+ T cells; grey: bulk CD8+ T cells). A summary of the frequencies of TOX-expressing virus-specific CD8+ T cells is depicted in the statistical graph. (B) The frequencies of CD45RA/CCR7-defined differentiation-associated subsets of virus-specific CD8+ T cells were analysed (upper row). Respective correlation analyses of the frequency of virus-specific CD8+ TEMRA cells and TOX expression of virus-specific CD8+ T cells were performed (lower row). (C) Coexpression analyses of TOX and TCF-1 in virus-specific CD8+ T-cell populations. representative flow cytometric histograms including gating of the TCF-1 marker are displayed (black: virus-specific CD8+ T cells; grey: bulk CD8+ T cells). (D) t-SNE representation (left) and MDS analysis (right) of concatenated flow cytometry data obtained from TOX+ HBV-specific, CMV-specific and EBV-specific CD8+ T cells are shown. (E) CMV-specific, EBV-specific and FLU-specific CD8+ T cells from healthy controls were expanded in vitro for 14 days with their respective peptides and the expansion capacity was determined by the logarithmic fold-increase in absolute numbers of CMV-specific, EBV-specific or FLU-specific CD8+ T cells from day 0 to day 14. Correlation analyses were performed with the frequency and expansion capacity of CMV-specific, EBV-specific and FLU-specific CD8+ T cells and their relative TOX expression at day 0 (ex vivo). Each dot represents one virus-specific CD8+ Tcell population: HBV: HBeAg+ CHB, n=5; HBeAg- CHB/NUC-treated HBeAg-CHB, n=30 and HBeAg- cHBV infection, n=20; healthy controls analysing for CMV-specific, EBV-specific and FLU-specific CD8+ T cells: n=35–46. Bar charts show the median value with IQR. Statistical analyses were performed by ordinary one-way ANOVA including Tukey’s multiple comparisons test (A, B: HBV, EBV, FLU (upper row)), Kruskal-Wallis test including Dunn’s multiple comparisons test (B: CMV (upper row), C, E: left), Pearson R correlation (B: CMV, EBV (lower row); E: middle and right) and Spearman r correlation (B: HBV, FLU (lower row)). *P<0.05; **p<0.01; ***p<0.001; ****p<0.0001. CHB, chronic hepatitis B; cHBV, chronic hepatitis B virus; CMV, cytomegalovirus; EBV, Epstein-Barr virus; FLU, influenza virus; MDS, multidimensional scaling; NUC, Nulcelos(t)ide analogues; TCM, central memory; TEM, effector memory; TN, naïve; TEMRA, terminally differentiated; TOX, Thymocyte Selection-Associated High Mobility Group Box; t-SNE, t-distributed stochastic neighborneighbour embedding.
Discussion
With this study, we provide important novel insights into the role of TOX in virus-specific CD8+ T cell biology in humans with a special emphasis on the relevance in cHBV infection. First, a significant fraction of chronically stimulated HBV-specific CD8+ T cells express TOX although at lower levels compared with HCV-specific CD8+ T cells. The reasons for this differential TOX expression in HBV-specific versus HCV-specific CD8+ T cells remain currently unclear but may be due to differential viral replication dynamics and viral loads, higher interferon induction in HCV infection or different numbers of infected hepatocytes. Nevertheless, we found TOX expression in HBV-specific CD8+ T cells to be clearly associated with phenotypic characteristics of T cell exhaustion. TOX-expressing HBV-specific CD8+ T cells displayed higher expression of PD1, CD57, EOMES and Helios, all markers that have been clearly linked to T cell exhaustion in the context of chronic viral infection.15 23 Thus, our finding of a significant TOX expression in HBV-specific CD8+ T cells is in agreement with several studies reporting the presence of exhausted HBV-specific CD8+ T cells in chronic infection.29 30 Of note, we detected a significantly higher TOX expression in more severely exhausted CD127-PD1+ versus memory-like CD127+PD1+ HBV-specific CD8+ T cells that results in a clear association between the frequency of CD127-PD1+ HBV-specific CD8+ T cells and the TOX expression suggesting that the level of TOX expression marks the degree of exhaustion in HBV-specific CD8+ T cells. The observation that the level of TOX expression is associated with the severity of T cell exhaustion also supports the hypothesis that reduced TOX expression in HBV-specific versus HCV-specific CD8+ T cells reflects a milder state of T cell exhaustion in cHBV compared with chronic HCV infection and supports previous reports that HBV-specific CD8+ T cells are not terminally exhausted.20 31
Furthermore, we observed that TOX expression is linked to antigen recognition in cHBV infection. Specifically, TOX is differentially expressed in distinct HBV-specific CD8+ T cells with a higher expression in HBV pol455-specific versus HBV core epitopes-specific CD8+ T cells. This is in agreement with our previous report that in comparison to HBV core epitope-specific CD8+ T cells, HBV polymerase epitope-specific CD8+ T cells displayed higher expression of PD1, CD38 and EOMES and lower expression of CD127, all indicative of enforced antigen recognition accompanied by a more severe state of T cell exhaustion.20 27 The mechanisms responsible for the different phenotypical and functional features of HBV core versus HBV polymerase epitope-specific CD8+ T cell responses are currently unclear. Reasons may include different antigen quantities or different antigen presenting cells.32 The link between TOX expression and antigen recognition is also in line with recent findings in the murine model of chronic LCMV infection demonstrating that TOX is induced in virus-specific CD8+ T cells via Calcineurin and NFAT2, both downstream events of TCR signalling14 and that it is sustained in the context of high and chronic antigen stimulation.13 14 Hence, the dynamics of enforced chronic antigen recognition is most probably a major driver of TOX expression in the context of T cell exhaustion.
A hallmark of CD8+ T cell exhaustion is dysfunction. Accordingly, we found a correlation between TOX expression and impaired functionality of HBV-specific CD8+ T cells as indicated by impaired proliferation, cytokine production and degranulation. This important association between TOX expression and impaired antiviral effector function was also evident in vivo in cHBV infection. In contrast to NUC treatment-mediated viral control of cHBV infection, endogenous control at low viral titers in HBeAg- patients was linked to lower TOX expression and accordingly higher effector functions of HBV-specific CD8+ T cells. Of note, an association between the functionality of HBV-specific CD8+ T cells and the clinical phase of cHBV infection has also been reported previously by others.4 5 Importantly, our results demonstrate that TOX expression marks dysfunctional virus-specific CD8+ T cells only in an actively persisting infection such as cHBV infection that is associated with T-cell exhaustion. Indeed, although TOX was similarly expressed in HBV-specific, CMV-specific and EBV-specific CD8+ T cells probably reflecting ongoing repetitive antigen stimulation, we only found a link between TOX expression and dysfunction for HBV-specific CD8+ T cells but not CMV-specific and EBV-specific CD8+ T cells. This is in line with the recent report by Sekine et al which showed a high TOX expression in functional competent memory CMV-specific and EBV-specific CD8+ T cells.16 Thus, in latently persisting viral infections, such as CMV and EBV infection, TOX seems to be associated with another underlying molecular programme of virus-specific CD8+ T cells compared with cHBV. This assumption is further supported by our observation that TOX expression is linked to terminal differentiation/senescence of CMV-specific and EBV-specific CD8+ T cells while this was not the case for HBV-specific CD8+ T cells. In contrast, TOX+ HBV-specific CD8+ T cells were rather characterised by coexpression of markers that are associated with T cell exhaustion. Recently published data obtained in the mouse model of chronic LCMV infection showed that the TOX locus is epigenetically remodelled in exhausted virus-specific CD8+ T cells indicating a distinct underlying programme of high TOX expression in exhausted compared with effector CD8+ T cells.13 14 Therefore, future studies will have to show whether a similar epigenetic remodelling takes place in exhausted HBV-specific CD8+ T cells. In the context of an actively persisting, chronic viral infection that is associated with T cell exhaustion, TOX has been shown to contribute to the maintenance of the exhausted CD8+ T cell response inhibiting terminal differentiation to mediate protection against T cell-mediated immunopathology.13 In accordance with this, only in HBV-specific and not in CMV-specific or EBV-specific CD8+ T cells TOX was highly co-expressed with TCF-1 that is essential for maintaining T cell responses in chronic viral infection.24–26
Another important finding of our study is that the expression of TOX is imprinted in HBV-specific CD8+ T cells even after spontaneous resolution (HBsAg seroconversion) of cHBV infection or after NUC therapy-mediated viral suppression. This is in contrast to spontaneous resolution during acute HBV infection since HBV-specific CD8+ T cells obtained from these subjects only displayed a low TOX expression. Noteworthy, we recently reported a similar dichotomous TOX expression in HCV-specific CD8+ T cells where TOX was highly detectable in chronic but not spontaneously resolved HCV infection and where TOX expression was also still significantly expressed after pharmacological resolution of HCV infection.13 Thus, in agreement with the LCMV mouse model, these data suggest that TOX expression in chronically stimulated virus-specific CD8+ T cells is irreversible probably due to a TOX-dependent epigenetic programming that cannot be simply reversed by antigen elimination. In line with this, only a partial functional recovery of HBV core-specific CD8+ T cells has been reported in HBeAg-chronically HBV-infected patients after NUC-induced HBsAg seroconversion.4 Accordingly, Le Bert et al have recently shown that HBV envelope-specific CD8+ T cell responses are reduced after long-term exposure to high levels of HBsAg and do also not recover after resolution of cHBV infection.33 These combined results, therefore, indicate that next to direct antiviral therapies, reversion of TOX-dependent epigenetic or transcriptional programming of HBV-specific CD8+ T cells may be required to make them fully functional. Thus, our results highlight TOX as a biomarker that marks dysfunctional HBV-specific CD8+ T cells specifically in the context of an actively persisting infection and may thus be used to guide immunotherapeutic approaches in HBV cure.
Data availability statement
All data relevant to the study are included in the article or uploaded as online supplemental information.
Ethics statements
Ethics approval
In agreement with the federal guidelines, local ethics committee regulations of Albert-Ludwigs-University, Freiburg, Germany (HBUF 474/14) and Hannover Medical School (3374–2016) and the Declaration of Helsinki (1975).
Acknowledgments
We thank all patients and healthy donors who donated blood for this study as well as the physicians and nurses involved in patient recruitment and sample acquisition.
References
Supplementary materials
Supplementary Data
This web only file has been produced by the BMJ Publishing Group from an electronic file supplied by the author(s) and has not been edited for content.
Footnotes
MH and RT are joint senior authors.
Contributors KH planned, performed and analysed the experiments. BBi, SS, DW, NH and HV contributed to the analysis. SL-L., EG, DP, ARMK and MC provided resources. FE performed four-digit HLA-typing by next generation sequencing. TB, CN-H, DZ and BBe contributed to data interpretation. MH and RT designed and supervised the study, contributed to experimental design and planning, interpreted data and wrote the manuscript.
Funding This work was supported by IMPATH CRC1160-Project A02 to RT and MH, IMPATH CRC1160-Project A03N to BBe, IMPATH CRC1160-Project A06 to CN-H and CRC/TRR 179-Project TP04 to TB, all from of German Research Foundation (DFG). DP was supported by a Wellcome Trust Senior Investigator Award (100326/Z/12/Z).
Competing interests None declared.
Provenance and peer review Not commissioned; externally peer reviewed.
Supplemental material This content has been supplied by the author(s). It has not been vetted by BMJ Publishing Group Limited (BMJ) and may not have been peer-reviewed. Any opinions or recommendations discussed are solely those of the author(s) and are not endorsed by BMJ. BMJ disclaims all liability and responsibility arising from any reliance placed on the content. Where the content includes any translated material, BMJ does not warrant the accuracy and reliability of the translations (including but not limited to local regulations, clinical guidelines, terminology, drug names and drug dosages), and is not responsible for any error and/or omissions arising from translation and adaptation or otherwise.