Article Text

Abstract
Objective Fetal growth restriction (FGR) is a devastating pregnancy complication that increases the risk of perinatal mortality and morbidity. This study aims to determine the combined and relative effects of genetic and intrauterine environments on neonatal microbial communities and to explore selective FGR-induced gut microbiota disruption, metabolic profile disturbances and possible outcomes.
Design We profiled and compared the gut microbial colonisation of 150 pairs of twin neonates who were classified into four groups based on their chorionicity and discordance of fetal birth weight. Gut microbiota dysbiosis and faecal metabolic alterations were determined by 16S ribosomal RNA and metagenomic sequencing and metabolomics, and the long-term effects were explored by surveys of physical and neurocognitive development conducted after 2~3 years of follow-up.
Results Adverse intrauterine environmental factors related to selective FGR dominate genetics in their effects of elevating bacterial diversity and altering the composition of early-life gut microbiota, and this effect is positively related to the severity of selective FGR in twins. The influence of genetic factors on gut microbes diminishes in the context of selective FGR. Gut microbiota dysbiosis in twin neonates with selective FGR and faecal metabolic alterations features decreased abundances of Enterococcus and Acinetobacter and downregulated methionine and cysteine levels. Correlation analysis indicates that the faecal cysteine level in early life is positively correlated with the physical and neurocognitive development of infants.
Conclusion Dysbiotic microbiota profiles and pronounced metabolic alterations are associated with selective FGR affected by adverse intrauterine environments, emphasising the possible effects of dysbiosis on long-term neurobehavioural development.
- INTESTINAL MICROBIOLOGY
- NEONATAL GUT
Data availability statement
Data are available upon reasonable request. All data relevant to the study are included in the article or uploaded as supplementary information. Not applicable.
This is an open access article distributed in accordance with the Creative Commons Attribution Non Commercial (CC BY-NC 4.0) license, which permits others to distribute, remix, adapt, build upon this work non-commercially, and license their derivative works on different terms, provided the original work is properly cited, appropriate credit is given, any changes made indicated, and the use is non-commercial. See: http://creativecommons.org/licenses/by-nc/4.0/.
Statistics from Altmetric.com
Significance of this study
What is already known on this topic?
Fetal growth restriction (FGR) is associated with adverse perinatal and neonatal mortality and worse neurocognitive outcomes.
The selective FGR model in twins is excellent for studying placental-related growth disorders in view of the identical fetal genetic factor and the maternal factor within twin pairs.
A few studies of FGR piglets have shown significantly unbalanced gut microbiota colonisation and disturbed metabolic profiles mediated by FGR.
What are the new findings?
We established a twin birth cohort including 73 monochorionic (MC) twin pairs and 77 dichorionic-diamniotic (DC) twin pairs, which was the largest number of DC twins and MC twins with intertwin birth weight discordance worldwide.
Both the intrauterine environment and genetics shaped the neonatal microbial communities, and an adverse intrauterine environment reduced the colonisation of heritable taxa.
Gut microbiota dysbiosis and faecal metabolic alterations in twin neonates with selective FGR were characterised by a decreased abundance of Enterococcus and downregulated methionine and cysteine levels.
Adverse intrauterine environmental factors related to selective FGR have a long-term effect on the neurobehavioural development of infants.
Significance of this study
How might it impact on clinical practice in the foreseeable future?
Decreased abundance of Enterococcus and Acinetobacter and associated downregulated methionine and cysteine levels in neonates with selective FGR may trigger oxidative stress and lower levels of 1-C (one carbon) metabolism, which might be related to the pathogenesis of selective FGR.
FGR-induced longitudinal microbial shift and neurobehavioural impairments correlated with metabolic profile disturbances may provide a non-invasive monitoring and intervention strategy to improve adverse prognoses.
Introduction
Fetal growth restriction (FGR) generally refers to the restricted growth potential of individuals subjected to a variety of maternal, fetal and placental conditions.1 FGR occurs in up to 10% of pregnancies and is a leading cause of infant morbidity and mortality.2 3 Moreover, FGR may have adverse consequences on lifelong health, including long-term neurological impairment,4 5 cognitive and learning disabilities,6 increased risk of future development of metabolic syndrome and consequent cardiovascular and endocrine diseases.7 8
Recently, emerging studies have documented that gut bacteria and metabolites play non-negligible roles in the gut-systemic metabolic interplay, which may influence immune and metabolic development in early life9 10 and alter offspring cognitive development and behaviour through the microbiota–gut–brain axis.11 12 An increasing number of studies have indicated that host genetics, prenatal environment and delivery mode can shape the microbiome at birth.13 Twins, with their high genetic and environmental resemblance, are excellent model for disentangling the effect of genetic and environmental factors on shaping the gut microbiota. For example, a few twin studies have investigated the genetic determinants of the gut microbiota.14 15 However, knowledge on the impact of intrauterine environment on early-life gut microbiota remains largely unknown to date.
Twins can be classified as dichorionic-diamniotic (DCDA) and monochorionic-diamniotic (MCDA) twins, occasionally suffering from adverse perinatal outcomes, which are mainly involved in chorionicity, birth weight discordance and at least one fetus with FGR.16 17 Discordant birth weight in dichorionic (DC) twin pregnancies can be attributed to various genetic or environmental factors, including differences in placental mass and placental insufficiency.18 19 Compared with DC twin pregnancies, monochorionic (MC) twin pregnancies with birth weight discordance, that is, selective FGR, sharing more genetic resemblance, are primarily due to differential intrauterine environments influenced by peripheral cord insertion, uneven placental sharing and characteristics of placental vascular anatomy,20 21 which may lead to increased perinatal mortality rate in MC twins than that in DC twins.22 Selective FGR model is ideal for investigating placental-related growth disorders and how genetic and environmental factors shape the gut microbiome. Therefore, well-designed twin studies with birth weight discordance are urgently needed to elucidate the genetic and intrauterine environmental influences on gut microbiota.
Here, we collected faecal samples from the first intestinal discharge to the discharge several days after birth and then used them for 16S ribosomal RNA (rRNA) sequencing, metabonomics and metagenome sequencing. 16S rRNA sequencing of the 428 faecal samples was performed to identify early-life microbiota perturbations. An untargeted gas metabonomic study was performed on 218 faecal samples immediately after birth to investigate the effects of genetic and environmental factors on intestinal microbial metabolism in neonates. Combined with these results, data on gut microbiota dysbiosis and faecal metabolic alterations related to unfavourable intrauterine environment were obtained. Furthermore, metagenome analysis was performed in 12 pairs of selective FGR twins and 10 pairs of MC twins with birth weight concordance to identify selective FGR-associated microbial species and their effects on metabolic profiles. By conducting a follow-up survey of 94 twin pairs at a mean age of 2.5 years, we further evaluated the effects of early-life gut microbes and metabolites on long-term physical and neurobehavioural development.
Materials and methods
Subject recruitment
This study was conducted based on an ongoing twin cohort study (Clinical Trials ID: NCT03220750). Mothers were approached for informed consent between February 2017 and December 2018 at Peking University Third Hospital in China. The inclusion criteria included two live neonates from MCDA and DCDA twin pregnancies, caesarean delivery and agreement to undergo follow-up after birth. The exclusion criteria included maternal factors including antibiotic usage in the third trimester of pregnancy, medical complications and severe pregnancy complications; fetal factors including major congenital anomalies or aneuploidy in at least one fetus (online supplemental figure S1); and complicated MC twin pregnancy including twin-to-twin transfusion syndrome (TTTS), TTTS superimposed on selective FGR, selective FGR following laser treatment for TTTS, selective FGR complications with twin anaemia polythaemia sequence and twin reversed arterial perfusion (online supplemental figure S2).
Supplemental material

Overview of the twin cohort and the influence of the intrauterine environment on the colonisation of the gut microbiota. DCDA-C and DCDA-D represent DC twins with birth weight concordance and birth weight discordance, respectively. MCDA-C and MCD represent MC twins with birth weight concordance and birth weight discordance, respectively. (A) The cohort of 150 twin pregnancies was divided into four groups based on chorionicity and discordance of fetal birth weight. The number of samples in each twin group is listed in the right table for gut microbiome profiling, metabonomics and follow-up survey. (B) The comparison of alpha diversities of gut microbiota among DCDA-C, DCDA-D, MCDA-D and MCDA-C groups. (C) Bray-Curtis distances were calculated and compared among the four groups. Statistical significance was determined by Wilcoxon’s rank-sum test. (D) Principal component analysis plot of neonatal gut microbiota in the DCDA-C, DCDA-D, MCDA-D and MCDA-C groups. Ellipses represent a 95% CI. (E) The ratio of the average relative abundance of each taxon in discordance and concordance of fetal birth weight in DC twins (red nodes) and MC twins (blue nodes). The x-axis represents different bacteria. (F) The cumulative frequency of discriminatory taxa in four group. The x-axis refers to discriminatory taxa among four groups. The y-axis represents the cumulative sample frequency of each taxon in the corresponding group. (G) The clustering of discriminatory taxa in the four groups, which is shown using the Pheatmap package in R. DC, dichorionic; MC, monochorionic.
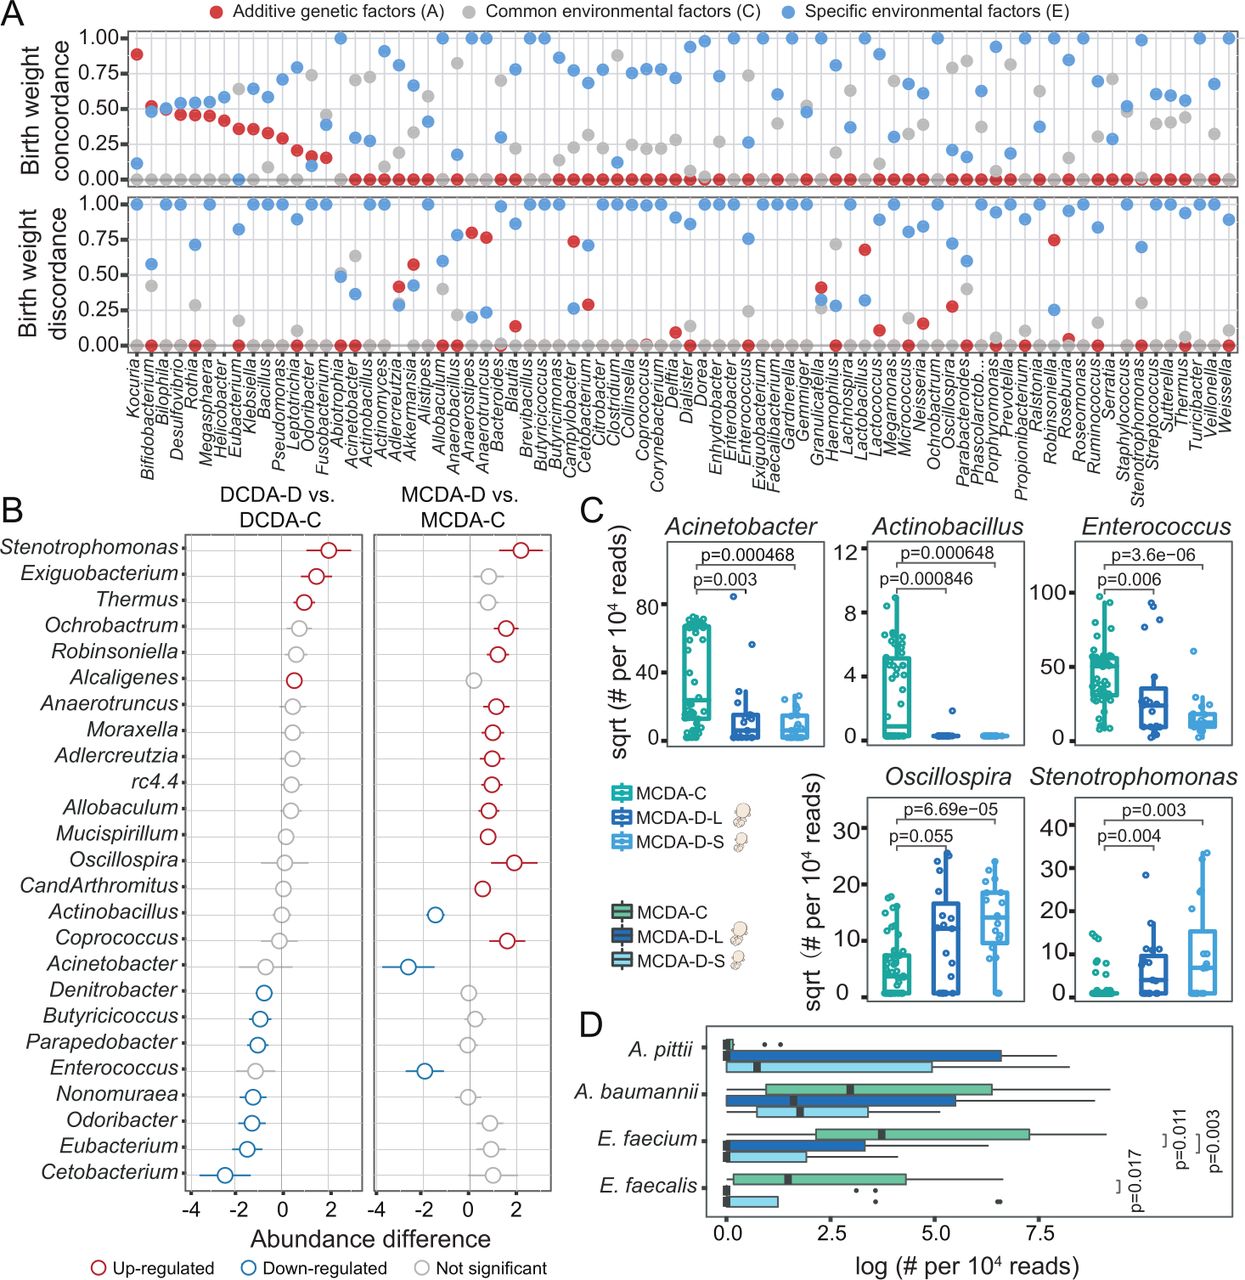
Both intrauterine environmental and genetic factors shape gut microbial composition in neonates. DCDA-C and DCDA-D represent DC twins with birth weight concordance and birth weight discordance, respectively. MCDA-C and MCDA-D represent MC twins with birth weight concordance and birth weight discordance, respectively. MCDA-D-L and MCDA-D-S represent the larger twin and smaller twin, respectively, according to birth weight for each MCDA-D twin pair. (A) Quantifying the contribution of various factors to shaping the neonate gut microbiota using the ACE model, in which the total variance is partitioned into genetic (A), common environment (C), and unique environment (E) effects. The x-axis refers to gut microbes at the genus level, which are ranked based on their A values in the twin with birth weight concordance. The y-axis represents the proportion of genetic effects (red), common environment effects (blue), and specific environment effects (grey) for each genus. (B) The discriminatory genera identified between the DCDA-D and DCDA-C groups or between the MCDA-D and MCDA-C groups. The x-axis represents the relative abundance of discriminatory genera. Blue and red circles denote DCDA-D- or MCDA-D-decreased and DCDA-D- or MCDA-D-enriched genera, respectively. (C) Bacterial genera with significant differences among the MCDA-C, MCDA-D-L and MCDA-D-S groups (adjusted p<0.05). Genus abundance in each sample was normalised to 104 reads. (D) Relative abundance of four species from metagenomic sequencing data among the MCDA-C, MCDA-D-L and MCDA-D-S groups. P values were determined by two-tailed Wilcoxon’s rank-sum test. DC, dichorionic; DCDA, dichorionic-diamniotic; MC, monochorionic; MCDA, monochorionic-diamniotic.
This study recruited twin neonates, who were grouped by their chorionicity and discordance of fetal birth weight. Birth weight discordance was calculated as 100 × (larger birth weight—smaller birth weight)/larger birth weight.23 A discordant twin was defined as a twin having birth weight discordance exceeding 25% and birth weight of one twin <10th centile in DCDA twins based on the following reasons: consensus-based diagnostic criteria24 and consistent standards of birth weight discordance in DCDA and MCDA twins. A discordant twin in MCDA twins was defined as the same two parameters above in the absence of TTTS.24 Twin neonates were classified into four groups, MCDA-D (MCDA twins with birth weight discordance, that is, selective FGR), MCDA-C (MCDA twins with birth weight concordance), DCDA-D (DCDA twins with birth weight discordance) and DCDA-C (DCDA twins with birth weight concordance), according to chorionicity and intertwin weight discordance (online supplemental figure S3 and online supplemental tables S1-S3).
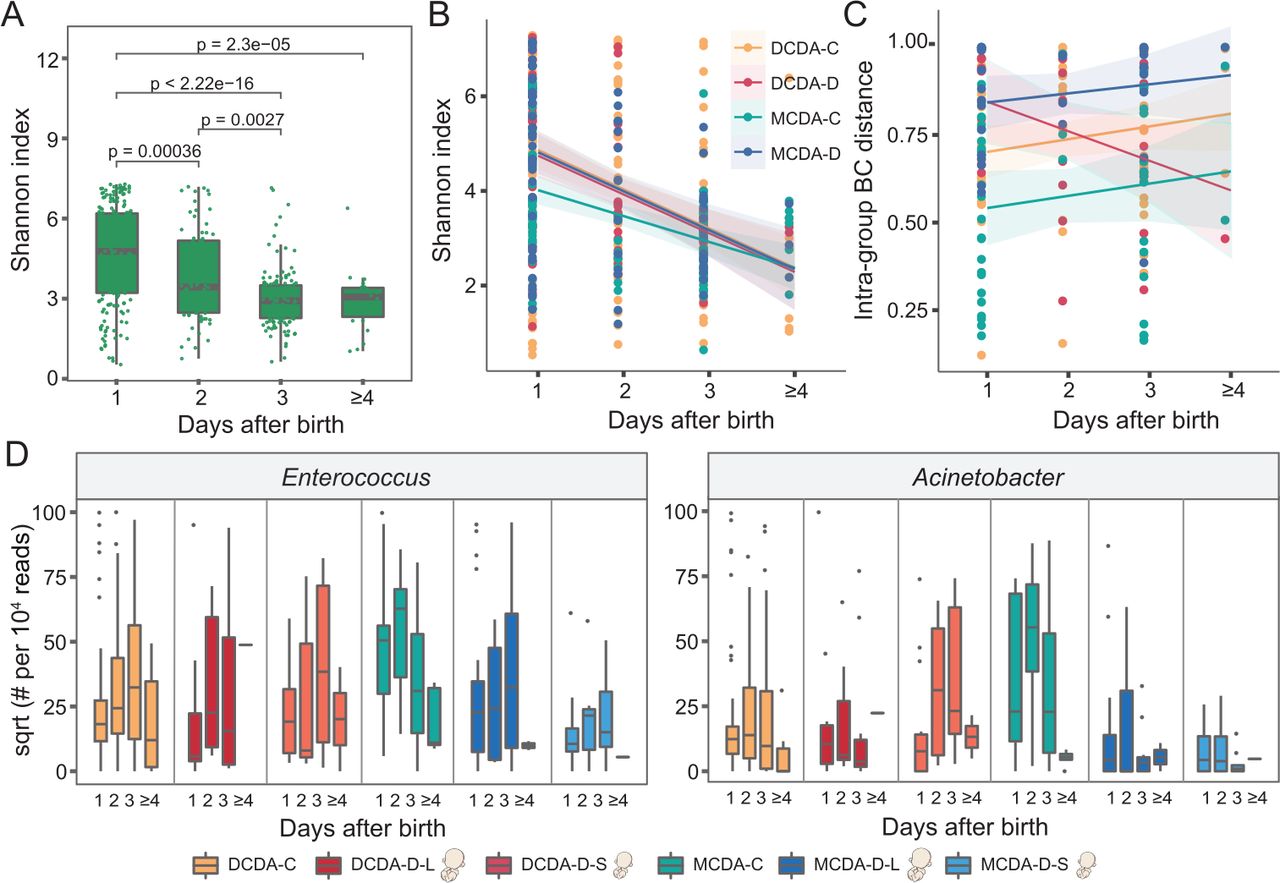
Longitudinal impact of adverse uterine environment on the gut microbiota in early life. DCDA-C and DCDA-D represent DC twins with birth weight concordance and birth weight discordance, respectively. MCDA-C and MCDA-D represent MC twins with birth weight concordance and birth weight discordance, respectively. DCDA-D-L and DCDA-D-S represent the larger twin and smaller twin, respectively, according to birth weight for each DCDA-D twin pair. MCDA-D-L and MCDA-D-S represent the larger twin and smaller twin, respectively, according to birth weight for each MCDA-D twin pair. (A) Microbial diversities of the neonatal gut microbiota in the first few days after birth. The scales 1, 2, 3 and ≥4 on the x-axis represent the first day, the second day, the third day and after 4 days, respectively. P values were determined by two-tailed Wilcoxon’s rank-sum test. (B) The alpha diversity in the gut microbiota for each group (DCDA-C, DCDA-D, MCDA-C and MCDA-D groups) within a few days after birth. (C) The short-term change pattern of the BC distance of the microbial communities after birth for each group within a few days after birth. (D) Abundance shifts of Enterococcus and Acinetobacter in the DCDA-C, DCDA-D-L, DCDA-D-S, MCDA-C, MCDA-D-L, and MCDA-D-S groups. BC, Bray-Curtis; DC, dichorionic; DCDA, dichorionic-diamniotic; MC, monochorionic; MCDA, monochorionic-diamniotic.
Faecal sampling, DNA extraction and high-throughput sequencing
Faecal samples were collected from the first intestinal discharge (meconium) and daily until the infants were discharged from the neonatology or maternity ward. Each infant had faecal samples from at least 3 days after birth. Sampling was conducted following a previously published protocol.14 Approximately 1–1.5 g faecal samples were sampled using a sterile plastic spoon and then placed in sterile tubes under strict aseptic conditions. All specimens were immediately frozen at −20°C on collection and then transported and stored at −80°C until the extraction of DNA and metagenomic and metabolomic profiling. DNA extraction, PCR amplification, library construction and sequencing operations were conducted using sterile tools and containers with a uniform protocol in a strictly controlled, separate and sterile workplace. To rule out possible contaminations of environmental or reagent sources, we first used DNA-free water as negative controls in DNA extraction and PCR amplification to ensure no amplification products in this process. DNA extraction was performed on all faecal samples as previously described.25 26 We amplified the V3–V4 region of the 16S rRNA gene using 515F (5’-GTGCCAGCCGGTAA-3’) and 806R (5’-GGACTACHVGGTWTCTAAT-3’) primers and then performed PE250 sequencing on the Illumina HiSeq 2500 platform. Three negative controls of DNA-free water were included in each batch of DNA extraction and PCR amplification. Only if there was no amplification product in the negative controls, samples of this batch were used for the following sequencing and analysis. Metagenomic DNA of meconium samples from 12 type II/III selective FGR and 10 MCDA-C twin pairs (~0.5 µg per sample) were sheared into ~300 bp fragments using a focused ultrasonicator (Covaris, Woburn, Massachusetts, USA). Metagenomic libraries were constructed with 0.2 µg DNA following the instructions of the NEBNext Ultra DNA Library Prep Kit for Illumina. Metagenomic sequencing was performed with PE150 on the HiSeq 2500 platform.
16S rRNA data processing and microbial community analysis
The raw 16S rRNA sequencing data were processed by QIIME2.27 Corresponding taxonomy assignments were obtained by comparing amplicon sequence variants (ASVs) with the reference sequences (gg-13-8-99-nb-classifier) acquired from the Greengenes database using the q2-feature classifier.28 Raw ASV data counts were transformed into relative abundances. Alpha diversity (Shannon diversity index) was calculated to indicate intrasample diversity. Bray-Curtis (BC) distance matrices were used to represent inter-sample diversity. Principal coordinates analysis (PCoA) was performed using BC distance. Taxonomic diversity was represented by genus-level relative abundance that was obtained by normalising the total reads of every sample by sum. Zero values were disposed of by plus one before log-transformation. We used linear models allowing for Tukey’s honestly significant difference (HSD) comparisons to identify microbial species that were differentially abundant between the DCDA-D and DCDA-C groups and between the MCDA-C and MCDA-D groups with maternal factors including mother’s age, body mass index (BMI) and other abnormalities as covariates. Differential genus features with a Spearman correlation threshold of r>0.5 were clustered using the Pheatmap package in R.
Heritability calculation
To determine the amount of variation due to genetic and environmental effects on the composition and function of the gut microbiota, the twin-based ACE model29 was employed to measure the heritability of specific taxa shaped by genetic factors. The ACE model estimates the variation in a trait of interest that is related to additive genetic (A) and common/shared (C) or unique (E) environmental factors by comparing trait variability in monozygotic (MZ) twin pairs versus dizygotic (DZ) twin pairs. The similarity (or difference) between twin pairs presumed by the ACE model can be explained by genes or heredity, their common environment (prenatal environment, family environment and socio-economic status, which makes twins resemble one another) and their specific (non-shared) environmental factors (some special experiences or diseases like differential placental and umbilical cord in our study, which makes twins different from one another). Before calculating the microbial heritability, raw count tables were filtered and transformed as follows: (1) Data in the ACE model were collected from MZ twins (all twins in the MCDA group) and DZ twins (twins in the DCDA group with opposite sex). (2) Only genus-level taxa present in >10% of faecal samples from the first day after delivery were used, and raw microbial counts were normalised by sum, log transformed and scaled. The heritability estimation of each taxon was calculated using R’s mets package, which was implemented by controlling for maternal and neonatal factors in the calculation of A, C and E.
Metagenomic analysis
A subset of samples within the first day after delivery were selected for metagenomic sequencing with more than 0.2 µg DNA amount for each of twin neonates, which included 12 pairs in the MCDA-D-II/III group, and randomly selected 10 pairs from the MCDA-C group. Adaptor and low-quality reads were discarded from raw metagenomic reads, and the remaining reads were filtered to eliminate human host DNA based on the human genome reference. The obtained reads were subjected to taxonomic profiling with MetaPhlAn2 (V.2.5.0) with default parameters.30 HUMAnN2 was used to determine metabolic pathways in the microbial community with default parameters.31
Untargeted metabolomics analysis of faecal samples
Faecal samples within the first day after delivery were used for untargeted metabolomics including the same 10 pairs in the MCDA-D-II/III group and 9 pairs from the MCDA-C group for metagenomic sequencing. Faecal samples were dried in a SpeedVac (LabconcoTM), 10 mg ±1 mg of samples were weighed, and then 600 µl of 100% methanol was added with an internal standard mix (10 mM 2,3,3,3-d4-alanine; 10 mM 2,3,4,5,6-d5-phenylalanine; 2 mM 3,3-d2-tyrosine). Each stool-solvent mixture was homogenised using a Qiagen Tissuelyser-II (Qiagen, Hilden, Germany) at 30 Hz for 30 s. After centrifugation at 17 000 g for 15 min, the supernatants were isolated and dried using a SpeedVac (Labconco, USA). The dried metabolites were chemically derivatised via a methyl chloroformate (MCF) approach based on the protocol published by Smart et al.32 The derivatised samples were analysed by an Agilent GC7890 system coupled to an MSD5975 with electron impact ionisation (70 eV) (Agilent, California, USA). The gas column was a ZB-1701 (30 m×250 µm id ×0.15 µm with 5 m guard column, Phenomenex). The GC oven programme and mass spectrometry parameters were set according to Han et al.33 The derivatised samples were injected with the pulsed splitless mode into the GC inlet at 290°C, and helium gas was set at 1 mL/min. The temperatures of the auxiliary, MS quadrupole, and MS source were set at 250°C, 230°C and 150°C, respectively. The detected mass range was from 38 µm to 550 µm. The scan speed was 1.562 μs−1, and the solvent delay was 5.5 min.
Automated mass spectral deconvolution and identification system software was applied for compound deconvolution and identification using the in-house MCF mass spectral library built by chemical standards. The relative abundance of the metabolites was extracted by an in-house MassOmics R package. The faecal metabolite levels were normalised to the relative level of the internal standards and weight of dried stool. Relative abundance differences of metabolites and PCoA analyses were performed. Samples with both 16S rRNA taxonomy and metabolite data were adopted for association analysis using SPARCC in R’s SpiecEasi package (V.1.0.7) with 200 bootstrap replicates to estimate p values. Correlations are displayed using the Pheatmap package in R with statistical significance (*p<0.05, **p<0.01, ***p<0.001).
Follow-up surveys of physical and neurocognitive development
Infants in our cohort participated in a follow-up survey 2 or 3 years after birth. Physical assessment of each infant was conducted by trained professional physicians, and the assessments included height and weight, which were measured according to the WHO’s specifications. Information on the timing of first walking and speaking was obtained through interviews with parents. The infant’s neurobehavioural development was evaluated using the infant Ages and Stages Questionnaires, third edition (ASQ-3) containing five developmental domains: communication, gross motor, fine motor, problem solving and personal social with 60 points possible in the combined evaluation for each infant.34 35 All follow-up surveys were carried out via oral answers by telephone or online questionnaire. The height and weight measurements were standardised by using Z score, and two different z-scores, height-for-age and weight-for-age were obtained according to the WHO Anthro program (V.3.2.2) for children 5 years of age or younger. Spearman’s correlation was used to analyse the correlation between cysteine relative abundance and the timing of first walking and speaking. Spearman’s correlation and partial correlation with actual age included in covariates were used to determine the correlation between cysteine relative abundance and the indices of physical development and five developmental domains of ASQ-3.
Statistical analysis
Intergroup comparisons, including for microbial alpha and beta diversity, relative abundance differences for specific taxa, and follow-up indicators of physical development such as height and weight, were conducted using Wilcoxon’s rank-sum test with multiple testing correction. Permutational multivariate analysis of variance for microbes and metabolites was carried out to test the significance of community dissimilarity using the ‘Adonis’ function within R’s vegan package. Effect sizes of relative abundance differences of faecal microbes and metabolites adopted Tukey’s test with p values adjusted according to a false discovery rate of 0.05 using the Benjamini-Hochberg method. Correlation between bacteria and metabolites generated by 16S rRNA sequencing, metagenomic sequencing and untargeted metabolomics was further calculated using MIMOSA and mmvec.36 37
Results
We included 150 twin pregnancy cases, including 73 MC twins and 77 DC twins. According to the discordance of fetal birth weight, 73 MC twin pairs were divided into the MCDA-D group (30 cases) and the MCDA-C group (43 cases) and 77 DC twin pairs were divided into the DCDA-D group (26 cases) and the DCDA-C group (51 cases) (figure 1A and online supplemental table S4). The DCDA-C group included 34 cases of DCDA-C-SS (DCDA-C with same sex) and 17 cases of DCDA-C-OS (DCDA-C with opposite sex). Based on the severity of growth restriction and the involvement of umbilical cord blood in the growth-restricted fetus, the MCDA-D group was further divided into the MCDA-D-I group (MCDA-D with type I selective FGR, 10 cases) and the MCDA-D-II/III group (MCDA-D with type II/III selective FGR, 20 cases) (online supplemental figure S3, online supplemental tables S1, S5). According to birth weight discordance, the larger of each twin pair in the MCDA-D group was referred to as MCDA-D-L, and the smaller was called MCDA-D-S. Similarly, twins in the DCDA-D group were also classified as DCDA-D-L (larger) and DCDA-D-S (smaller) (online supplemental tables S5, S6).
Intrauterine environment outweighs genetics in shaping newborn gut microbiota
We first examined whether chorionicity and FGR caused by adverse intrauterine environments could affect microbial communities in early life, and observed that the alpha diversity of gut microbiota in the DCDA-C group was significantly higher than that in the MCDA-C group (p=0.04, Wilcoxon’s rank-sum test) (figure 1B). The higher alpha diversity in the DC twins, especially the DZ twins (online supplemental figure S4A), suggests the effect of chorionicity in shaping the gut microbiota and the existence of possible microbial-genetic associations. However, the alpha diversity of the gut microbiota in the MCDA-D group was slightly higher than that in the MCDA-C group (p=0.069, Wilcoxon’s rank-sum test) and DCDA-C group (figure 1B), and the MCDA-D-II/III group exhibited significantly higher alpha diversities than those of the MCDA-C group (p=0.000102, Wilcoxon’s rank-sum test) and MCDA-D-I group (p=0.000165, Wilcoxon’s rank-sum test) (online supplemental figure S4B). These results suggested that adverse intrauterine environmental factors outweighed genetics in shaping the early-life gut microbiota by contributing to a more diverse composition of neonatal microbiota at birth. Notably, this effect was positively related to the severity of FGR.
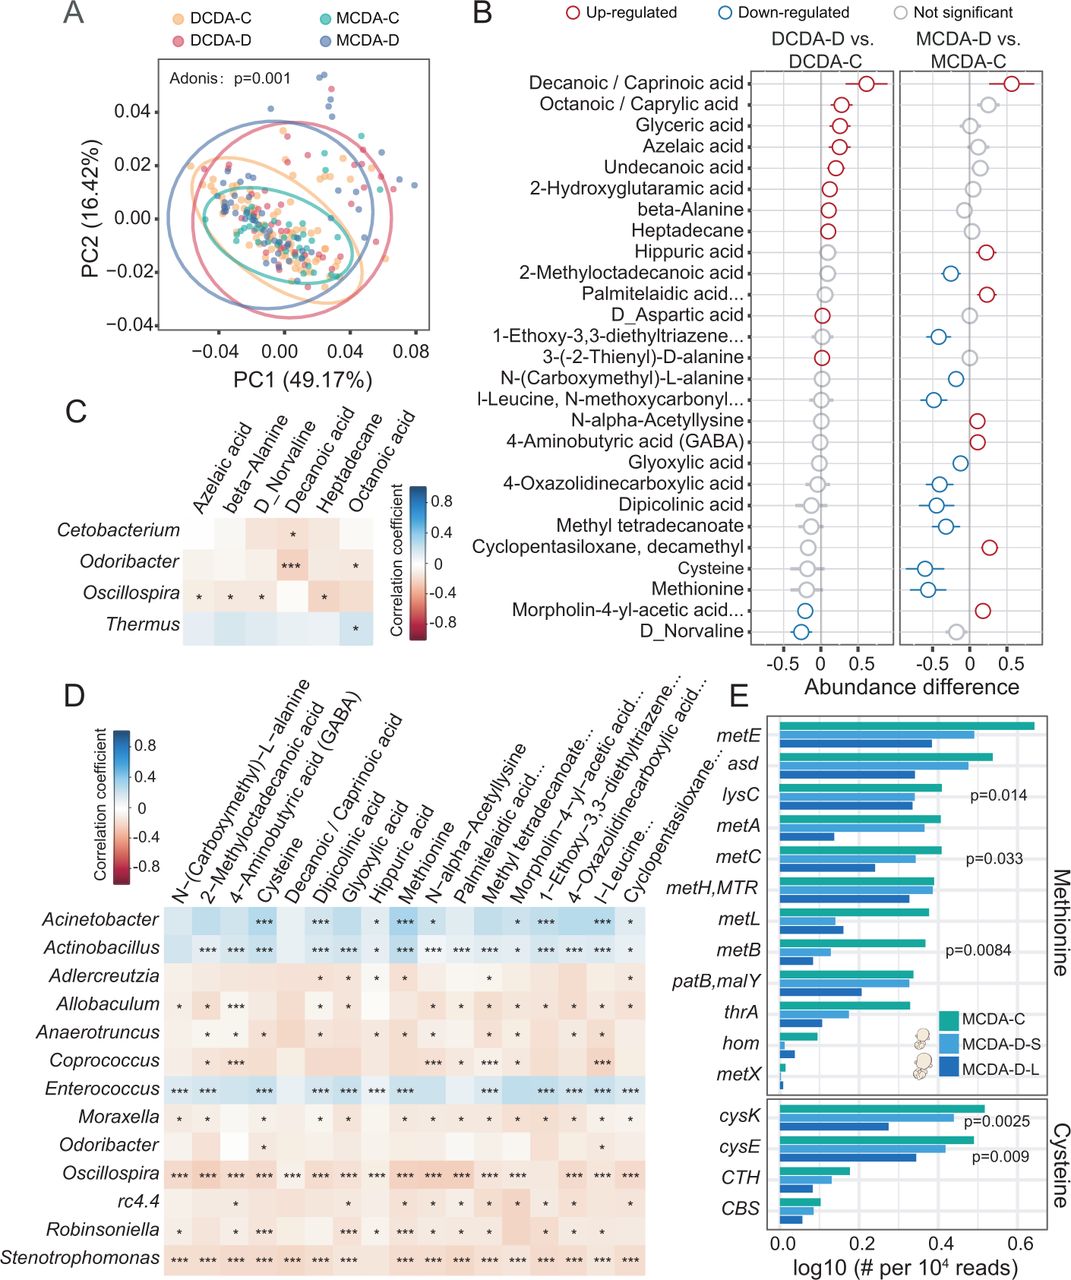
Dysbiotic microbiota and metabolic disturbances in individuals with selective fetal growth restriction. DCDA-C and DCDA-D represent DC twins with birth weight concordance and birth weight discordance, respectively. MCDA-C and MCDA-D represent MC twins with birth weight concordance and birth weight discordance, respectively. (A) Principal coordinates analysis plot of faecal metabolites in the DCDA-C, DCDA-D, MCDA-D and MCDA-C groups. Ellipses represent a 95% CI. (B) The discriminatory metabolites were identified and ranked according to the extent of the difference by comparing DCDA-C group versus DCDA-D group and MCDA-D group versus MCDA-C group. Blue and red circles denote DCDA-D- or MCDA-D-downregulated and DCDA-D- or MCDA-D-upregulated metabolites, respectively. (C) Correlations between the relative abundance of discriminatory bacteria at the genus level and faecal metabolites using the Pheatmap package with statistical significance in the DCDA-D and DCDA-C groups (*p<0.05, **p<0.01, ***p<0.001). (D) Correlations between the relative abundance of discriminatory genera and faecal metabolites using the Pheatmap package with statistical significance in the MCDA-D and MCDA-C groups (*p<0.05, **p<0.01, ***p<0.001). (E) Relative abundance and rank of the highly abundant discriminatory microbial genes involved in the methionine and cysteine synthesis pathways by Kruskal test. DC, dichorionic; DCDA, dichorionic-diamniotic; MC, monochorionic; MCDA, monochorionic-diamniotic.
Next, we calculated the BC distance of the microbial community between individuals of each group at the ASVs level (figure 1C). The BC distances between samples in the MCDA-C group were significantly smaller than those in the DCDA-C group (p=0.038, Wilcoxon’s rank-sum test) (figure 1C and online supplemental figure S4C). We further found that the BC distance of the microbial community in twins with birth weight discordance (MCDA-D and DCDA-D) was significantly larger than that in twins with no discordance (MCDA-C and DCDA-C) (p<0.01, Wilcoxon’s rank-sum test) (figure 1C). In addition, there were more significant dissimilarities in the interindividual community in the MCDA-D-I group and MCDA-D-II/III group than in the MCDA-C group (p<0.01, Wilcoxon’s rank-sum test) (online supplemental figure S4D). These results indicated that both genetic and intrauterine environments can affect interindividual community variability and that the latter exhibits a more obvious and positive effect.
To further explore the clustering effect of microbial communities among the four groups, PCoA was carried out. The samples were clustered within each group and separated between different groups (p=0.001, Adonis test), with the distribution of DCDA-C and MCDA-C samples relatively more dispersed than that of DCDA-D and MCDA-D samples (figure 1D). Notably, the distribution of MCDA-C samples was more dispersed than that of DCDA-C-SS and DCDA-C-OS samples (p=0.001, Adonis test) (online supplemental figure S4E). Inversely, the sample distribution of the MCDA-D-II/III groups was more compact than that of the MCDA-D-I group and the MCDA-C group (p=0.001, Adonis test) (online supplemental figure S4F), revealing that an adverse intrauterine environment related to FGR may shape the gut microbial communities of different neonates in the same direction.
To discern the extent to which genetic and adverse intrauterine environmental factors influenced the bacterial taxa, the ratio of the average relative abundance of each taxon was calculated separately between the DCDA-D and DCDA-C groups and between the MCDA-D and MCDA-C groups (figure 1E). The number of taxa with a ratio below one was obviously larger than that of taxa with a ratio above one between the DCDA-D and DCDA-C groups, but was almost the same between the MCDA-D and MCDA-C groups. Compared with the respective control groups (MCDA-C or DCDA-C), there was a more significant effect on the abundance of specific bacterial taxa in the MCDA-D group than in the DCDA-D group, which may be related to the severity of the adverse intrauterine environment. Most of the low-frequency bacteria were found in the MCDA-D and DCDA-D groups, indicating gut microbiota dysbiosis due to an adverse intrauterine environment. In the high-frequency region, the area of the MCDA-D group was larger than that of the DCDA-D group, indicating a higher frequency of differential bacteria in the MCDA-D group than in the DCDA-D group (figure 1F). These results further confirmed that the intrauterine environment plays a significant role in shaping the neonatal gut microbiota.
By conducting clustering analysis of microbial classification and abundance in each group, we identified 21 genera in four groups with differential relative abundance and a Spearman correlation threshold of r>0.5 (figure 1G). Compared with the other three groups having dozens of enriched or depleted genera, only Actinobacillus was slightly enriched in the MCDA-C group, which were consistent with the result of the lowest alpha diversity in the MCDA-C group in view of the limited influences of genetics and the intrauterine environment.
Specific taxa correspond to adverse intrauterine environmental or genetic factors
To assess how the intrauterine environment and genetic factors impact specific bacterial taxa, the twin data were separated into two groups (figure 2A), twins with birth weight concordance and twins with birth weight discordance. We observed an obvious effect of selective FGR on the specific taxa by increased proportion of environmental effects (blue dots) and decreased proportion of genetic effects (red dots). To evaluate the fluctuation in the three component sources, we compared the effects of A, C (common environment) and E factors on the microbial communities in these two groups of twins. The number of specific taxa influenced by E was significantly higher than that influenced by A or C (online supplemental figure S5), and the relative abundances of highly heritable bacteria with heritability >0.2, such as Bilophila and Eubacterium, were significantly different among the MCDA-C, DCDA-C-SS and DCDA-C-OS groups (p<0.05, Tukey’s test) (online supplemental figure S6). These results demonstrated that the influence of genetic and common environmental factors on the microbiota was weakened when adverse intrauterine factors appeared.
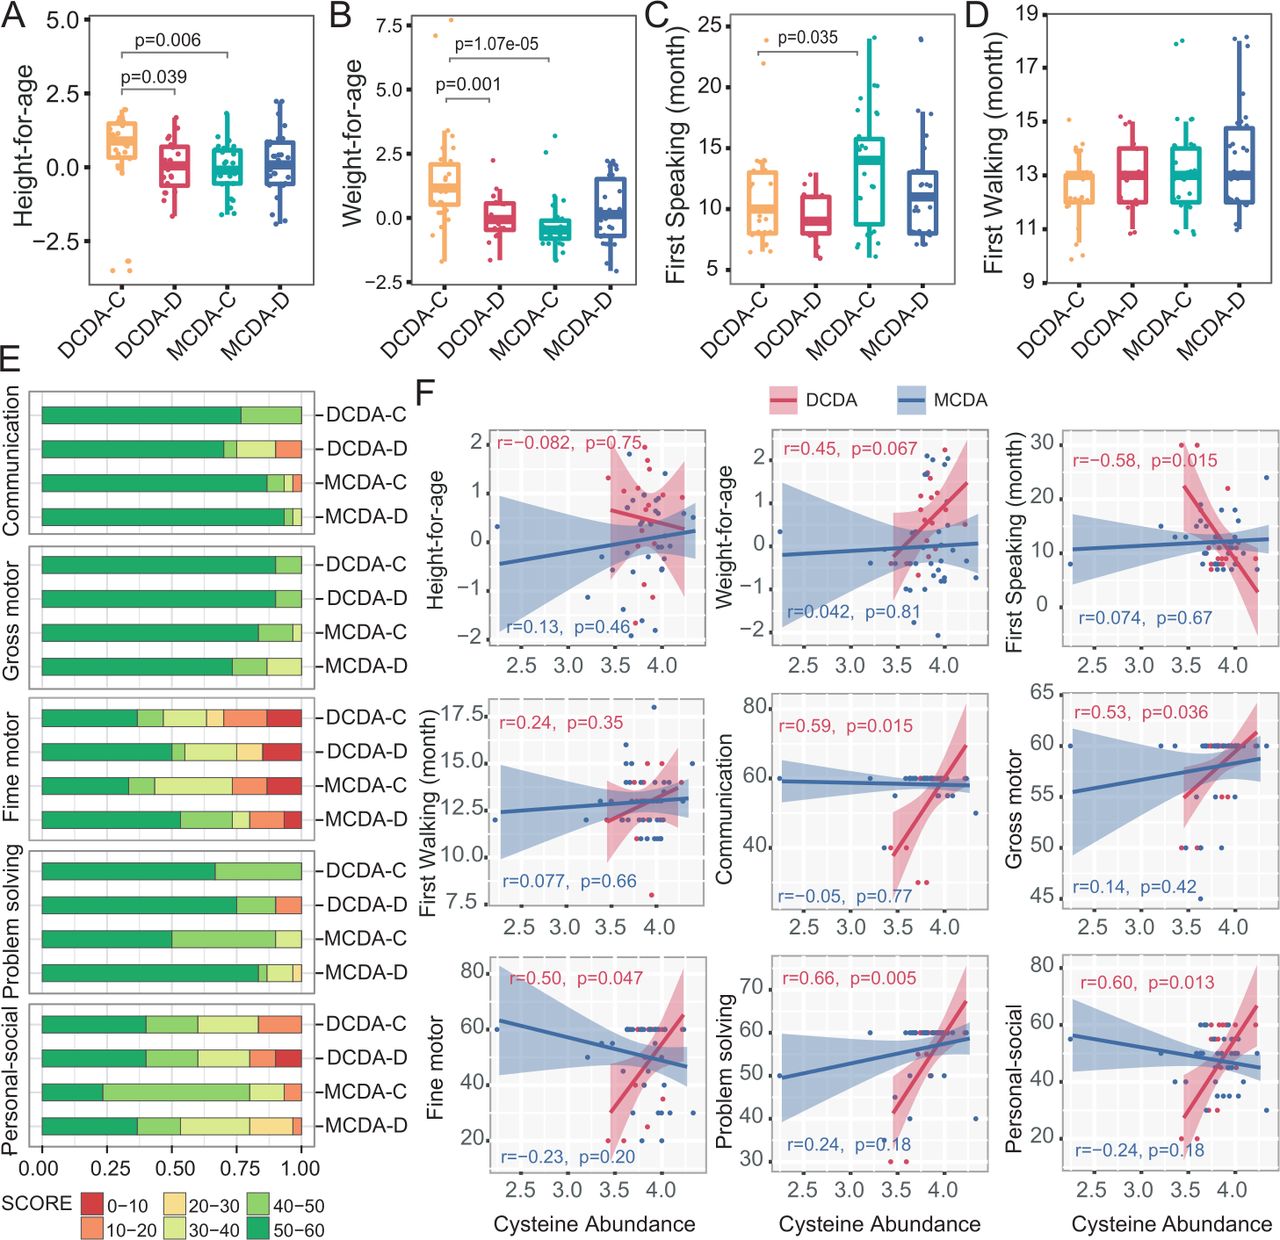
Correlation between neonatal faecal metabolites and physical and neurocognitive development later in life. DCDA-C and DCDA-D represent DC twins with birth weight concordance and birth weight discordance, respectively. MCDA-C and MCDA-D represent MCDA twins with birth weight concordance and birth weight discordance, respectively. (A–D) Comparison of height-for-age, weight-for-age, first speaking time and first walking time among the DCDA-C, DCDA-D, MCDA-C and MCDA-D groups. Statistical significance was determined by Wilcoxon’s rank-sum test. (E) Comparison of the percentage of score areas in the four groups for each developmental domain of the Ages and Stages Questionnaires third edition subscale. (F) The correlation between the faecal cysteine concentration and evaluation indices of physical and neurocognitive development. The shadow around the linear regression trendline shows the 95% CI. DC, dichorionic; DCDA, dichorionic-diamniotic; MC, monochorionic; MCDA, monochorionic-diamniotic.
We next explored the taxonomic differences related to fetal birth weight discordance. Notably, comparison of gut microbiota between the MCDA-D and MCDA-C groups showed more pronounced dysbiosis than that between the DCDA-C group DCDA-D group, with an increase in Coprococcus, Robinsoniella and Oscillospira and a decrease in Acinetobacter, Enterococcus and Actinobacillus in the MCDA-D group (figure 2B). A more significant difference in the abovementioned genera was also observed between the MCDA-D-II/III group and the MCDA-C group (online supplemental figure S7). These results indicate a positive correlation between the severity of the adverse intrauterine environment and gut microbiota dysbiosis. Then, we explored the extent of gut microbiota dysbiosis in smaller twin pairs in the MCDA-D or DCDA-D groups (online supplemental figure S8). Comparisons were performed between larger and smaller twin pairs in the MCDA-D or DCDA-D groups, and comparisons of larger or smaller twin pairs to their controls were also performed. The most obvious dysbiosis was found between MCDA-D-S and MCDA-C (figure 2C and online supplemental figure S8).
We finally performed whole-genome shotgun sequencing on 44 samples, including 12 pairs of MCDA-D-II/III and 10 pairs of MCDA-C. Discriminatory species were compared among the MCDA-C, MCDA-D-L and MCDA-D-S groups. We detected two species of Enterococcus (Enterococcus faecium and Enterococcus faecalis) that exhibited significant differences among the three groups. For example, a significantly higher abundance of E. faecium was found in the MCDA-C group than in the MCDA-D-S and MCDA-D-L groups (p<0.05, Wilcoxon rank-sum test) (figure 2D). Combining 16S rRNA with metagenomic sequencing, we revealed that gut microbiota dysbiosis in neonates with selective FGR was characterised by the absence of Enterococcus, especially a decreased abundance of E. faecium in the smaller twin with selective FGR.
The longitudinal impact of adverse intrauterine environment on the gut microbiota
To explore how the intrauterine environment and genetic associations impacted short-term neonatal gut microbiota development, we further investigated dynamic changes in the gut microbiota within the initial days after birth. Alpha diversity significantly decreased within the first few days after birth in all these groups by a linear model of time series analysis (figure 3A–B). A possible explanation was that some bacterial taxa at birth disappeared, and the community structure of the neonatal microbiota was gradually simplified with environmental fluctuations after birth.
We next investigated the effects of genetic relatedness on the change in microbiota diversity by comparing the MCDA-C, DCDA-C-SS and DCDA-C-OS groups. The differences in alpha diversity among the three groups gradually disappeared during the first few days after birth (online supplemental figures S9A-B). To investigate the potential effect of adverse intrauterine environments, we also compared the decreased microbiota diversity among the MCDA-D-I, MCDA-D-II/III and MCDA-C groups and found that the alpha diversity in the MCDA-D-II/III group declined dramatically from the highest at birth to a level similar to the other two groups at 3–4 days after birth (online supplemental figure S9C). When evaluating the longitudinal microbial shift associated with selective FGR, we found that the difference in abundance of Enterococcus and Acinetobacter gradually diminished among the MCDA-D-S, MCDA-D-L and MCDA-C groups (figure 3D).
We then calculated and compared the BC distance of the microbial community between individuals in the four groups at the ASVs level (figure 3C). A gradual dissimilarity was observed in the MCDA-D group (p=0.37), MCDA-C group (p=0.35) and DCDA-C group (p=0.15) within the first few days after birth, whereas the interindividual community dissimilarity markedly decreased in the DCDA-D group (p=0.05), similar to that in the MCDA-D-I group. Conversely, a rapid increase in BC distance was observed in MCDA-D-II/III group (online supplemental figure S9D), indicating that the severity of adverse intrauterine environments may contribute to interindividual community dissimilarities after birth. These longitudinal variations demonstrated that adverse intrauterine environmental factors may play more dramatic roles in shaping the gut microbiome than genetics and that the effects persist in the first few days after birth.
Metabolic alterations related to dysbiotic gut microbiota in selective FGR
To characterise the alterations of metabolic patterns correlated with the microbial shifts of meconium, faecal metabolic profiles were investigated using gas chromatography-mass spectrometry (GC–MS). The PCoA showed that metabolites of samples were clustered within each group and were separated between different groups (p=0.001, Adonis test) (figure 4A). When comparing the metabolites of the DCDA-C-OS and DCDA-C-SS groups to those of the MCDA-C group, a similar alteration was observed, reflecting the genetic effect on the metabolic profiles (online supplemental figure S10).
Compared with those between the DCDA-D and DCDA-C groups, there were more significantly different metabolites between the MCDA-D and MCDA-C groups. A total of 17 differential metabolites were observed in the MCDA-D group with lower concentrations of cysteine, methionine and dipicolinic acid (figure 4B). Downregulated levels of cysteine and methionine were identified in either the MCDA-D-II/III or MCDA-D-I group, particularly in the smaller twin with selective FGR (online supplemental figure S11, S12). We further explored the correlation between altered gut microbiota and faecal metabolites. Only Oscillospira was negatively correlated with four metabolites, as revealed by the comparison between the DCDA-D and DCDA-C groups (figure 4C). In contrast, 13 genera showed significant correlations with different metabolites for MCDA-D and MCDA-C individuals. Notably, gut microbiota dysbiosis in selective FGR (figure 2) was significantly correlated with these metabolites (figure 4D). Consistent with the dysbiotic gut microbiomes, the MCDA-D group showed more pronounced metabolic alterations and more significant correlations with altered gut bacteria than the DCDA-D group, which was further confirmed by the correlation analysis using MIMOSA (ref) and mmvec (ref) (online supplemental figure S13A-C).
With metagenome sequencing data, the methionine synthesis pathway was closely related to 12 microbial genes, the relative abundance of which was lower in the MCDA-D-L and MCDA-D-S groups than in the MCDA-C group. Of the 12 microbial genes, the abundance of LysC, metB and metC was dramatically reduced (p<0.05, Kruskal test). We found that the cysteine synthesis pathway was closely related to four microbial genes, the relative abundance of which was lower in the MCDA-D-L and MCDA-D-S groups than in the MCDA-C group. Of the four microbial genes, the abundances of cysK and cysE were dramatically reduced (p<0.05, Kruskal test) (figure 4E). Notably, cysE, cysK, lysC, metB and metC genes identified in the metagenomic data were significantly correlated with many amino acids measured by metabolomics, such as methionine, norvaline, cysteine, D-aspartate and beta-alanine (online supplemental figure S13D). Interestingly, when measuring the correlation between metabolites and bacteria classified by metagenomic data (online supplemental figure S13E), we found that most of these amino acids were significantly correlated with Acinetobacter baumannii, E. faecium and E. faecalis, further highlighting the significance of these bacteria.
The above results further confirmed that the depletion of genetic abundance was associated with selective FGR by downregulating cysteine and methionine metabolism in MCDA-D. Combined with a striking reduction in E. faecium and E. faecalis in MCDA-D, we speculated that the downregulated amino acid metabolism by the gut microbiota may contribute to the pathological impairment in selective FGR. We further performed metabolic pathway enrichment analysis of these genes and metabolites based on metagenomic data to compare the difference between MCDA-C and MCDA-D, and found that nitrogen metabolism, folate metabolism and biotin metabolism pathway were significantly enriched in MCDA-D (online supplemental figure S13F).
Neonatal cysteine levels correlated with physical and neurocognitive development later in life
To explore the possible effects of metabolic alteration in early life on later physical and neurocognitive development, we analysed the correlation between the level of faecal metabolites and evaluation indices of physical and neurocognitive development in infants 2–3 years after birth. Both height and weight of infants in the MCDA groups and the DCDA-D group were significantly lower than those in the DCDA-C group (figure 5A–B). Similarly, the first-speaking time for infants in the MCDA-C group was also later than that in the DCDA-C group (p=0.035) (figure 5C). There was no significant difference in the first-walking time among the four groups (figure 5D), as well as in standardised weight/height among MCDA-C, MCDA-D-I, and MCDA-D-II/III groups (online supplemental figure S14) and between the smaller twin and the larger co-twin of the DCDA-D and MCDA-D groups (online supplemental figure S15).
The ASQ-3 subscale contained five developmental domains: communication, gross motor, fine motor, problem solving and personal social, with 60 points possible as a complete combined score for the ASQ-3. We evenly divided the 60 points into 6 intervals for each domain of the ASQ-3 and evaluated infants’ neurobehavioural development by comparing the occurrence of low scores (30 score or less) in each domain between the DCDA-D and DCDA-C groups or the MCDA-D and MCDA-C groups (figure 5E). The DCDA-D group showed a higher frequency of lower scores (<20 score) in the individual-society domain, communication and problem-solving domain than the DCDA-C group. A similar trend in the individual-society domain was also observed between the MCDA-D and MCDA-C groups. Notably, for the individual-society domain, the MCDA-D-II/III group showed a much higher frequency of lower score intervals (10–20 score) than the MCDA-D-I group (online supplemental figure S14). There was little difference in the five developmental domains between larger and smaller twin pairs in the MCDA-D and DCDA-D groups (online supplemental figure S15).
In the DCDA-C and DCDA-D groups, each of the five domains had significantly positive correlation with faecal cysteine levels. Correlation of weight later in life and cysteine level was r=0.45 (p=0.067), although the difference did not reach statistical significance. A significant negative association was found between faecal cysteine levels and the first speaking time (p<0.05) (figure 5F). Such an association did not appear in the MCDA-C and MCDA-D groups, which may be attributed to more high-quality early education interventions and intensive childcare after birth in these groups. These results indicate that adverse intrauterine environmental factors have a relatively long-term impact on physical and neurobehavioural development, especially in the individual-society domain, and the low level of faecal cysteine in early life may be correlated with physical and neurobehavioural development for twin infants with FGR.
Discussion
Epidemiological studies have demonstrated that host genetics, prenatal environment including maternal medical disorders38 and placental abnormalities39 or a combination of these factors can shape the neonatal microbiota at birth. Besides fetal and genetic factors, most of FGR usually develops in an adverse intrauterine environment caused by chronic hypoxia at the feto-maternal interface. However, no study has focused on how the intrauterine environment and genetic factors determine early-life microbial features, particularly for selective FGR. By investigating gut microbiota dysbiosis and faecal metabolic alterations in neonates with selective FGR in a sample of MZ and DZ twins, we demonstrated that the intrauterine environment was a more crucial driver of neonatal microbial communities than genetics and that the dysbiotic microbiota in selective FGR has a long-term impact on physical and neurocognitive development.
Regarding the influence of adverse intrauterine environments on gut microbial composition, our results revealed the degree of gut microbiota dysbiosis in selective FGR was highly correlated with the severity of selective FGR, which was in line with previous studies showing that birth weight is an underlying factor in determining infant microbial balance.40 Disorder of the gut microbiota may be involved in inflammatory and metabolic disturbances in FGR, which has been demonstrated by increasing evidence.41 42 For example, the dysbiosis pattern of depleted Acinetobacter and enriched Stenotrophomonas in FGR is consistent with a previous report on intrauterine growth-restricted piglets.43 Several recent studies have observed that Oscillospira is positively associated with leanness or lower BMI in both children and adults.44 45 In our study, Oscillospira was found to be enriched in the early-life microbiome of individuals with selective FGR. In addition, the genus Coprococcus was positively correlated with lipid metabolic dysfunction and the proinflammatory response in low birth weight pigs.46 Both Oscillospira and Coprococcus are butyrate producers,47 and previous studies have revealed that butyrate represents a major source of energy for the colonic epithelium by regulating glucose metabolism48 and alleviates ischaemia/reperfusion damage via the upregulation of intracellular oxidant stress and inflammation.49 Therefore, we speculate that elevated abundance of butyrate producers in selective FGR may be a mechanism to compensate for intrauterine malnutrition by regulating energy metabolism and reducing inflammatory responses.
16S rRNA amplicon and metagenome sequencing of faecal samples revealed that the genus Enterococcus and its representative species (E. faecium) were closely related to selective FGR. E. faecium can remove excess free radicals in the serum and promote the release of various antioxidant enzymes, which improves the antioxidant capacity of the serum.50 In this study, we found that the abundance of Enterococcus and E. faecium was positively correlated with methionine and cysteine in faecal samples. In individuals with selective FGR, the abundance of genes involved in methionine and cysteine metabolism was significantly reduced. Previous studies51 52 have revealed that methionine could counteract oxidative stress by eliminating the concentrations of reactive oxygen species (ROS) as an activator of nicotinamide adenine dinucleotide phosphate (NADPH)-dependent antioxidant enzymes such as methionine sulfoxide reductase A.53 54 Emerging studies have indicated that common pathological abnormalities in individuals with FGR include damaged vascular endothelium in maternal-placenta-fetal circulation, including amniotic fluid,55 caused by increased oxidative stress.56–58 We thus speculated that dynamic changes in the early-life microbiome and the reduction in Enterococcus colonisation may downregulate methionine and cysteine levels and lead to vascular damage in individuals with selective FGR via an excessive oxidative stress response.
Methionine participates in the biosynthesis of S-adenosyl-methionine as the main 1 C (one carbon) donor acting as the precursor of succinyl-CoA, homocysteine.59 Due to the role of 1 C in nucleic acid synthesis and protein synthesis,60 methionine and cysteine metabolism plays a vital role in fetal nutrition and growth.61 Notably, previous studies have showed that methionine in amniotic fluid from gestational weeks 13–17 could predict the final birth weight and length.62 In addition, several recent studies have showed that modified DNA methylation, such as of the promoter region of dopamine-specifying factor63–65 caused by 1 C metabolism (methyltransferase), was associated with abnormal neurobehavioural development of individuals with FGR in infanthood. Therefore, low levels of methionine and cysteine could interfere with 1 C metabolism and inhibit DNA synthesis and methylation, which may in turn impede embryonic and fetal growth. This may explain why reduced cysteine in individuals with FGR was associated with retardation and neurocognitive development abnormalities in this study.
In conclusion, we reported gut microbiota dysbiosis and faecal metabolic alterations in neonates in an adverse intrauterine environment with selective FGR and explored their possible effects on short-term microbiome shift and long-term neurobehavioural development. The decreased abundance of Enterococcus and Acinetobacter may downregulate methionine and cysteine levels and thereby cause excessive oxidative stress and low levels of 1-C metabolism. These findings provide novel insights into gut disruption and metabolic profile disturbances in early life associated with adverse intrauterine environment, which will undoubtedly improve our understanding of the underlying mechanism of early-life microbial colonisation and contribute to improving adverse outcomes and curbing-related metabolic diseases later in life by targeting the gut microbiota and related metabolites.
Data availability statement
Data are available upon reasonable request. All data relevant to the study are included in the article or uploaded as supplementary information. Not applicable.
Ethics statements
Patient consent for publication
Ethics approval
This study involves human participants and was approved by The Human Research Ethics Committee of Peking University Third Hospital (IRB00006761-2016145). Participants gave informed consent to participate in the study before taking part.
References
Supplementary materials
Supplementary Data
This web only file has been produced by the BMJ Publishing Group from an electronic file supplied by the author(s) and has not been edited for content.
Footnotes
JY, LH and JW contributed equally.
Contributors FZ is responsible for the overall content as the guarantor. FZ and YZ conceived the study. JY, Jinfeng Wang, NY, YW, SY, KC, WZ, ZS, Jing Wang, HJ, NH, YY, ML, RS, YW collected the samples and conducted the experiments. JY, LH, Jinfeng Wang, LX and JZ analysed the data. JY, LH, Jinfeng Wang and FZ wrote the manuscript. All authors approved the final version of the manuscript.
Funding This work was supported by grants from the National Natural Science Foundation of China (32025009, 81971399, 32070122) and National Key R&D Project (2021YFA1301000, 2021YFC2300017).
Competing interests None declared.
Provenance and peer review Not commissioned; externally peer reviewed.
Supplemental material This content has been supplied by the author(s). It has not been vetted by BMJ Publishing Group Limited (BMJ) and may not have been peer-reviewed. Any opinions or recommendations discussed are solely those of the author(s) and are not endorsed by BMJ. BMJ disclaims all liability and responsibility arising from any reliance placed on the content. Where the content includes any translated material, BMJ does not warrant the accuracy and reliability of the translations (including but not limited to local regulations, clinical guidelines, terminology, drug names and drug dosages), and is not responsible for any error and/or omissions arising from translation and adaptation or otherwise.