Article Text

Abstract
Objective Enteropathy-associated T-cell lymphoma (EATL) is a rare but severe complication of coeliac disease (CeD), often preceded by low-grade clonal intraepithelial lymphoproliferation, referred to as type II refractory CeD (RCDII). Knowledge on underlying oncogenic mechanisms remains scarce. Here, we analysed and compared the mutational landscape of RCDII and EATL in order to identify genetic drivers of CeD-associated lymphomagenesis.
Design Pure populations of RCDII-cells derived from intestinal biopsies (n=9) or sorted from blood (n=2) were analysed by whole exome sequencing, comparative genomic hybridisation and RNA sequencing. Biopsies from RCDII (n=50), EATL (n=19), type I refractory CeD (n=7) and uncomplicated CeD (n=18) were analysed by targeted next-generation sequencing. Moreover, functional in vitro studies and drug testing were performed in RCDII-derived cell lines.
Results 80% of RCDII and 90% of EATL displayed somatic gain-of-functions mutations in the JAK1-STAT3 pathway, including a remarkable p.G1097 hotspot mutation in the JAK1 kinase domain in approximately 50% of cases. Other recurrent somatic events were deleterious mutations in nuclear factor kappa-light-chain-enhancer of activated B-cells (NF-κB) regulators TNFAIP3 and TNIP3 and potentially oncogenic mutations in TET2, KMT2D and DDX3X. JAK1 inhibitors, and the proteasome inhibitor bortezomib could block survival and proliferation of malignant RCDII-cell lines.
Conclusion Mutations activating the JAK1-STAT3 pathway appear to be the main drivers of CeD-associated lymphomagenesis. In concert with mutations in negative regulators of NF-κB, they may favour the clonal emergence of malignant lymphocytes in the cytokine-rich coeliac intestine. The identified mutations are attractive therapeutic targets to treat RCDII and block progression towards EATL.
- COELIAC DISEASE
- GASTROINTESTINAL LYMPHOMA
- GENE MUTATION
Data availability statement
All data relevant to the study are included in the article or uploaded as supplementary information. The data that support the findings of this study are available from the corresponding author, nadine.cerf-bensussan@inserm.fr, upon reasonable request.
This is an open access article distributed in accordance with the Creative Commons Attribution 4.0 Unported (CC BY 4.0) license, which permits others to copy, redistribute, remix, transform and build upon this work for any purpose, provided the original work is properly cited, a link to the licence is given, and indication of whether changes were made. See: https://creativecommons.org/licenses/by/4.0/.
Statistics from Altmetric.com
Significance of this study
What is already known on this subject?
Low-grade intraepithelial lymphoproliferation, called type II refractory coeliac disease (RCDII), and aggressive enteropathy-associated T-cell lymphoma (EATL) are severe complications of coeliac disease (CeD).
What are the new findings?
Both RCDII and EATL display a complex mutational profile dominated by highly recurrent gain-of-functions mutations of JAK1 and STAT3, frequently associated with mutations which activate the NF-κB pathway.
How might it impact on clinical practice in the foreseeable future?
This study establishes the characteristic oncogenetic identity of CeD-associated lymphomas, points to a driver role of JAK1-STAT3 mutations in malignant transformation and reveals potential therapeutic targets.
Disclaimer: this video summarises a scientific article published by BMJ Publishing Group Limited (BMJ). The content of this video has not been peer-reviewed and does not constitute medical advice. Any opinions expressed are solely those of the contributors. Viewers should be aware that professionals in the field may have different opinions. BMJ does not endorse any opinions expressed or recommendations discussed. Viewers should not use the content of the video as the basis for any medical treatment. BMJ disclaims all liability and responsibility arising from any reliance placed on the content.
Introduction
Coeliac disease (CeD) is a frequent autoimmune-like enteropathy induced by gluten in genetically predisposed individuals, with a worldwide distribution and rising incidence in industrialised countries.1 Although generally reversible and effectively controllable through gluten-free diet, CeD predisposes to severe lymphoid malignancies. These malignant complications are thought to develop from the compartment of intraepithelial lymphocytes (IELs)2–4 and can manifest either as type II refractory CeD (RCDII), a low-grade clonal intraepithelial lymphoproliferation5 6 or as a highly aggressive enteropathy-associated T-cell lymphoma (EATL).7 EATL can arise ‘de novo’ in patients with CeD, but up to 50% of EATL develop through an intermediary RCDII step.5 6 RCDII is characterised by the massive infiltration of the gut epithelium by lymphocytes which display clonal rearrangements of the T-cell receptor (TCR) and, in most cases, an unusual immunophenotype combining both T-cell and NK-cell traits that reflects their origin from a small subset of innate-like T-IEL.2 8–11 Although initially localised within the gut epithelium, RCDII-IEL can disseminate into lamina propria and blood and ultimately reach other organs, notably skin, liver and lungs, even in the absence of transformation into EATL.12 Due to their normal cytological appearance, RCDII-IEL are difficult to differentiate on histological sections from the normal population of T-IEL that infiltrate the gut epithelium in active CeD and diagnosis of RCDII is often challenging as it requires a combination of molecular and phenotypic methods.5 11 13
In contrast, EATL are characterised by a pleomorphic infiltrate of medium and large-sized proliferative lymphoma cells.14 Alike RCDII-IEL, EATL usually express the integrin CD103, a signature of their intraepithelial origin.4 15 They also display Ki67 staining, attesting their proliferative state and frequently express CD30, an activation marker.7 16 As both markers are absent in RCDII, their appearance is useful to monitor RCDII transition to EATL and to indicate the need for chemotherapeutic regimens targeting dividing cells, a therapeutic option that is inefficient and even dangerous in RCDII. EATL prognosis remains very poor, with a 5-year survival rate of around 60% in de novo EATL, which decreases to less than 5% in patients with EATL complicating RCDII,7 stressing the need for strategies allowing early diagnosis and efficient treatment of RCDII in order to prevent its transformation into EATL. Based on the analysis of TCRγ rearrangements, we have reported that EATL complicating RCDII share a common clonal origin with RCDII-IEL.3 Mechanisms of IEL transformation remain however largely elusive, although some genomic alterations have been reported in a small number of RCDII10 and EATL17 cases.
Herein, we have applied a combination of genetic approaches in order to comprehensively map the mutational landscape of RCDII and EATL, to identify genetic events driving lymphocyte transformation during RCDII and its progression to EATL, and to delineate potential differences between EATL complicating RCDII and those arising de novo in CeD. We demonstrate the outstanding frequency of JAK1 and STAT3 gain-of-function (GOF) mutations but also reveal the frequent occurrence of deleterious mutations in negative regulators of NF-κB and in several epigenetic regulators, thus revealing candidate targets for therapeutic intervention.
Methods
Tissue sampling
Tissue samples and blood were obtained from patients with CeD (n=18), RCDI (n=7) and RCDII (n=50) enrolled prospectively in the French national ‘centres experts des lymphomes associés à la maladie coeliaque’ (CELAC) registry until June 2018. Nineteen patients had EATL complicating CeD (n=8) or RCDII (n=11). Paired tumour and non-tumour biopsies were available for 12 out of 19 patients (CeD=3, RCDII=9). Clinical characteristics are summarised in table 1 and online supplemental table 1. For detailed description of diagnostic procedures, see online supplemental experimental procedures.
Supplemental material
Supplemental material
Supplemental material
Supplemental material
Supplemental material
Characteristics of patients with CeD, RCDI and RCDII
Genomic analyses
Genomic DNA was extracted from cell lines, peripheral blood mononuclear cells and frozen biopsy specimens with QIAamp DNA Mini Kit according to the manufacturer’s instructions. Comparative genomic hybridisation (CGH), whole exome sequencing (WES), targeted next-generation sequencing (TNGS), targeted amplicon sequencing (TAS) and TCR rearrangements were performed and analysed as detailed in online supplemental experimental procedures.
Cell culture and drug inhibition assays
Patient-derived cell lines were obtained as described8 and maintained in complete RPMI (Invitrogen, Thermo Fisher Scientific, Villebon-sur-Yvette, France) with 20 ng/mL IL-15 (R&D Systems, Bio-Techne, Lille, France). Cells, incubated or not with various drugs, were analysed by flow cytometry for apoptosis and proliferation assays, by western blot for STAT3 phosphorylation determination or imaging flow cytometry for nuclear NF-κB/p50 translocation. For a detailed description, see online supplemental experimental procedures.
Statistical analysis
Prism V.6 software (GraphPad Software, La Jolla, California, USA) was used for statistical analysis. Multiple comparisons were performed via one-way analysis of variance with Dunnett’s correction, and categorical comparisons were analysed with Fisher’s exact test. Survival analysis was performed using Kaplan-Meier curves and log-rank test in patients followed up from diagnosis to the latest news in June 2018.
Results
Whole exome sequencing and comparative genomic hybridisation reveal recurrent mutations in RCDII
In order to establish a comprehensive and complete catalogue of the somatic genetic events associated with malignant transformation in RCDII, WES and CGH were performed on pure populations of RCDII cells (>99% sCD3-iCD3+sTCR-) that were either cell lines derived from biopsies of RCDII patients (n=9) or FACS-sorted circulating RCDII cells from peripheral blood (n=1; case 3). For WES, RCDII cells were compared with normal autologous CD3+ PBL (n=9) or sorted T-cells (n=1, case 3).
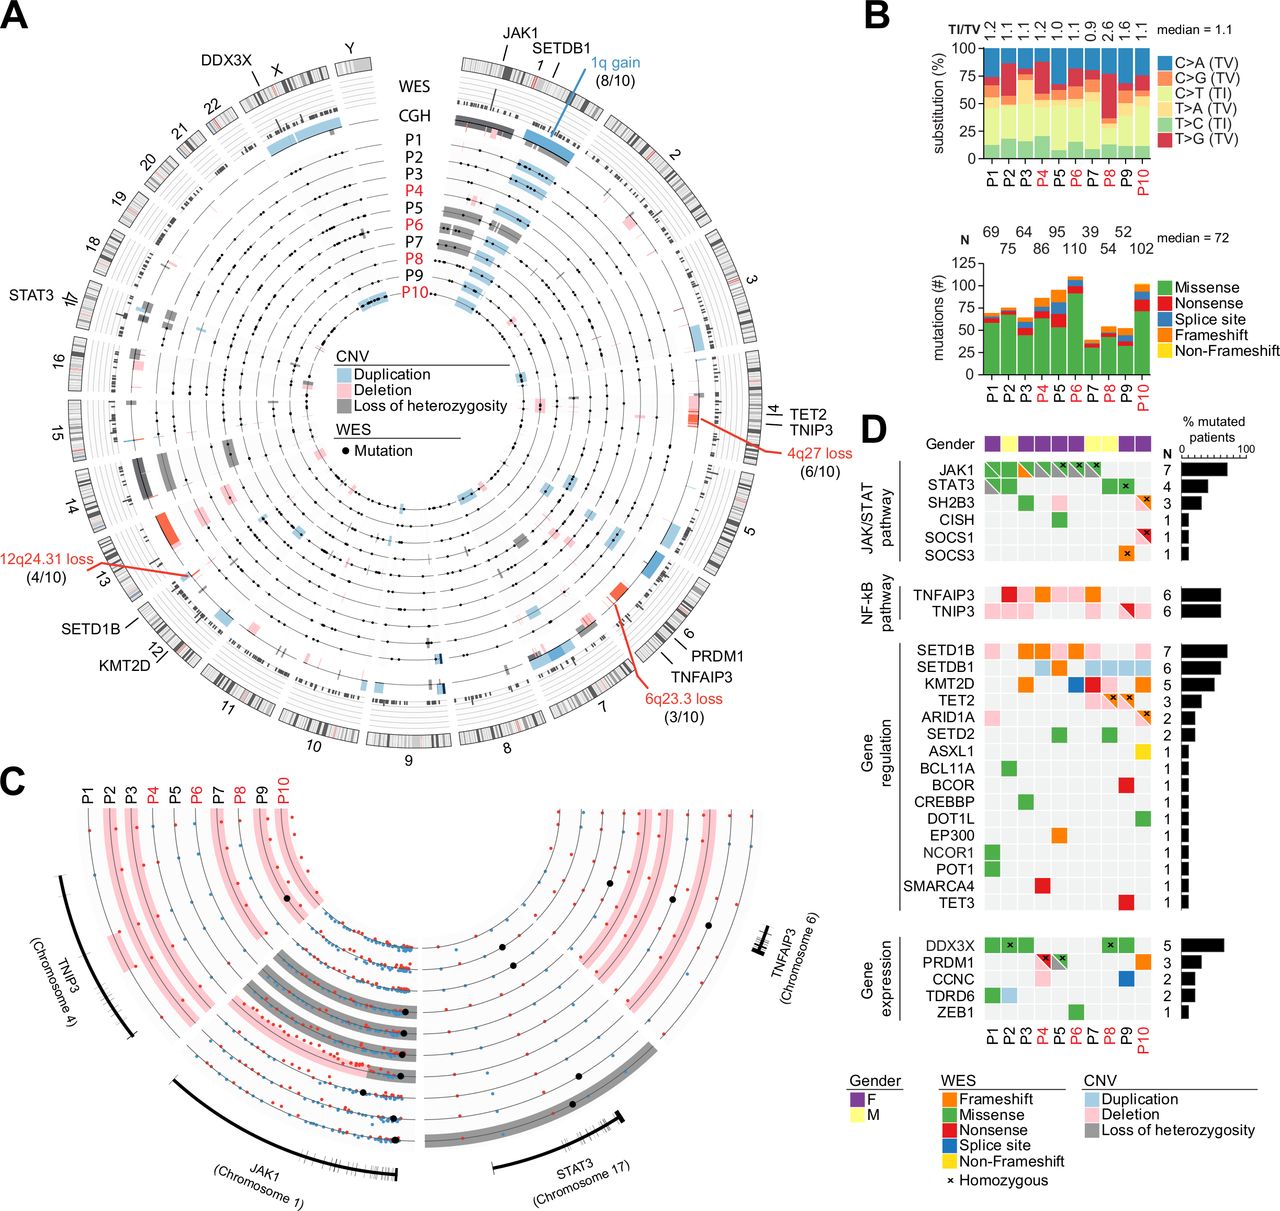
After curation of WES data, the number of non-synonymous somatic mutations ranged from 39 to 110 (median=72) per case (figure 1A; online supplemental figure 1). Most frequent curated exonic mutations were C>T transitions (32%), followed by C>A transversions (22%), except for patient 8 (P8) which showed mainly T>G transversions (figure 1B). Integrative analysis of WES and CGH disclosed both recurrent and distinctive somatic alterations in RCDII cells. Predicted GOF somatic JAK1 and or STAT3 missense mutations were most frequent, occurring in 7 out of 10 and 4 out of 10 cases, respectively. STAT3 mutations were predominantly found within the SH2 domain and JAK1 mutations in the JH1-kinase domain. In one case, a JAK1 frameshift mutation was observed on the second allele and, in three additional cases, CGH revealed concomitant loss-of-heterozygosity (LOH) of a region including JAK1 on chromosome 1p (figure 1C,D). Two patients carried both JAK1 and STAT3 mutations and three cases with only JAK1 or STAT3 mutation showed additional deleterious alterations in negative regulators of the JAK-STAT pathway such as CISH, SH2B3 or SOCS3.18 Of note, the only case without JAK1 or STAT3 mutation displayed deleterious homozygous mutations of SOCS1 as well as of SH2B3, resulting in 100% prevalence of mutations activating the JAK1-STAT3 pathway.18 Additional recurrent somatic events included mutations of the X-linked RNA-helicase DDX3X19 (5/10), of the methyl-cytosine dioxygenase TET220 (3/10) as well as of the tumour suppressor PRDM1/BLIMP121 (3/10).
Supplemental material

Genomic characterisation of the mutational landscape of type II refractory coeliac disease (RCDII) cells. Results from whole exome sequencing (WES) and comparative genomic hybridisation (CGH) in primary RCDII-IEL lines (n=9) and RCDII-cells sorted from peripheral blood (n=1). (A) Circos plot depicts distribution of curated somatic variants and copy number variants (CNV) across chromosomes. Outer ring shows ideograms of human chromosomes 1–22, X and Y from p-region to q-region, divided by centromeres in red and with cytogenetic bands depicted by light and dark shades. Gene names and CNV adjacent to ideograms highlight selected candidate genes or regions with lines pointing to their approximate location on the genome. Bar graphs on second ring and box plot on third ring summarise variants per gene and CNV per location, respectively. Numbered concentric circles show WES results from individual patients as black dots and CNV as boxes colour coded as indicated in the legend. (B) Bar graphs show proportion of transitions and transversions (upper graph) and mutation types per patient (lower graph). (C) Circos plot excerpt shows magnified regions from chromosomes 1, 4, 6 and 17 with indicated gene loci for individual patients. Dots indicate hybridisation status of CGH probes (blue=positive, red=negative) or small mutations (black) and coloured boxes summarise CNV coded as in (A). (D) Heatmap summarises selected somatic gene variants in combination with CNV results per patient (column) and gene (row) grouped by pathway or function with mutations colour coded as indicated in the legend. Bar graphs indicate percentage of occurrence per gene. IEL, intraepithelial lymphocyte.
CGH revealed recurrent trisomy 1q (8/10) and losses within 4q (6/10) and 6q (4/10) (figure 1A–C). Chromosome 4q losses spanned 4q27, thereby including TNIP3, a member of the ubiquitin editing complex for nuclear factor kappa-light-chain-enhancer of activated B-cells (NF-κB) regulation.22 The 6q losses included the well-known tumour suppressor TNFAIP3/A20,23 a binding partner of TNIP3, in three cases. Deleterious somatic mutations in this gene were detected in three additional cases by WES. Overall, loss-of-function (LOF) alterations of TNIP3 and TNFAIP3/A20 were found in 90% (9/10), making NF-κB signalling the second most affected pathway in RCDII cell lines. Other frequently affected genes included histone modifiers, with deleterious SETD1B alterations (7/10) due to frameshifts (3/7) and 12q losses (4/7) including a minimal 960 kb 12q24.31 microdeletion, gain of SETDB1 (6/10), through chromosome 1q gain in five cases, as well as deleterious mutations of KMT2D (5/10).24 25 Beyond this core mutational signature, RCDII-cells contained a broad spectrum of additional uniquely occurring pathogenic mutations that potentially shaped individual identity. Accordingly, transcriptional analysis of the RCDII-cell lines (n=4) revealed a heterogeneous transcriptional profile (online supplemental figure 2). Importantly, transcriptional analysis (n=5) did not reveal any fusion transcripts (data not shown).
Supplemental material
Since cell lines might acquire mutations during cell culture, WES was compared between one RCDII line derived from an intestinal biopsy and circulating RCDII-cells freshly sorted from autologous peripheral blood (case 4, figure 1 and online supplemental figure 3). Both samples displayed the same clonal TCR rearrangement (online supplemental figure 3), attesting their clonal origin from a common ancestor. Many mutations, notably those involving JAK1, TNFAIP3 and SETD1B, overlapped between the two samples, arguing against artificial induction of these mutations during cell culture. Moreover, biopsy-derived and PBL-sorted RCDII cells also showed substantial differences, suggesting clonal evolution and selection.
Supplemental material
Overall, these data highlight the malignant nature of RCDII and illustrate a unique mutational profile. They suggest a driver role for JAK1-STAT3 GOF mutations and a contribution of NF-κB activating mutations to RCDII pathogenesis.
Analysis of primary intestinal biopsies confirms recurrent activating mutations of the JAK1-STAT3 and NF-κB pathways
We next screened frozen biopsies from 50 patients with RCDII via TNGS of a panel of 104 genes involved in T-cell malignancies (online supplemental file 1). Results were confirmed using TAS that covered mutated regions identified by TNGS and 22 additional genes identified in the explorative WES- and CGH-based approach (online supplemental file 2). TNGS and TAS were chosen over WES and CGH to analyse biopsies as both techniques allow deeper sequencing and were therefore anticipated to detect RCDII-associated mutations despite the low frequency of RCDII cells in biopsies. Duodenal biopsies from patients with CeD (n=15) and RCDI (n=6) served as controls. Biopsies from three patients with CeD (T4, 6, 7) and one patient with RCDI(T11), who developed EATL but had no evidence of RCDII, were also studied. Description of patients is provided in table 1.
Supplemental material
Supplemental material
All biopsies from CeD and RCDI showed a polyclonal TCRγ and VDJβ repertoire. In contrast, 48 out of 50 (96%) of RCDII biopsies displayed clonal TCRγ rearrangement, while 2 out of 50 (4%) had polyclonal TCRγ but clonal TCRδ. Abnormal expansion of RCDII cells was confirmed by flow cytometry in 30 out of 33 patients. Three patients had RCDII-IEL that lacked CD4 and CD8 but showed expression of surface CD3 with either TCRγδ (2 cases with 70% and 95% TCRγ+ IEL, respectively) or TCRαβ (95%).
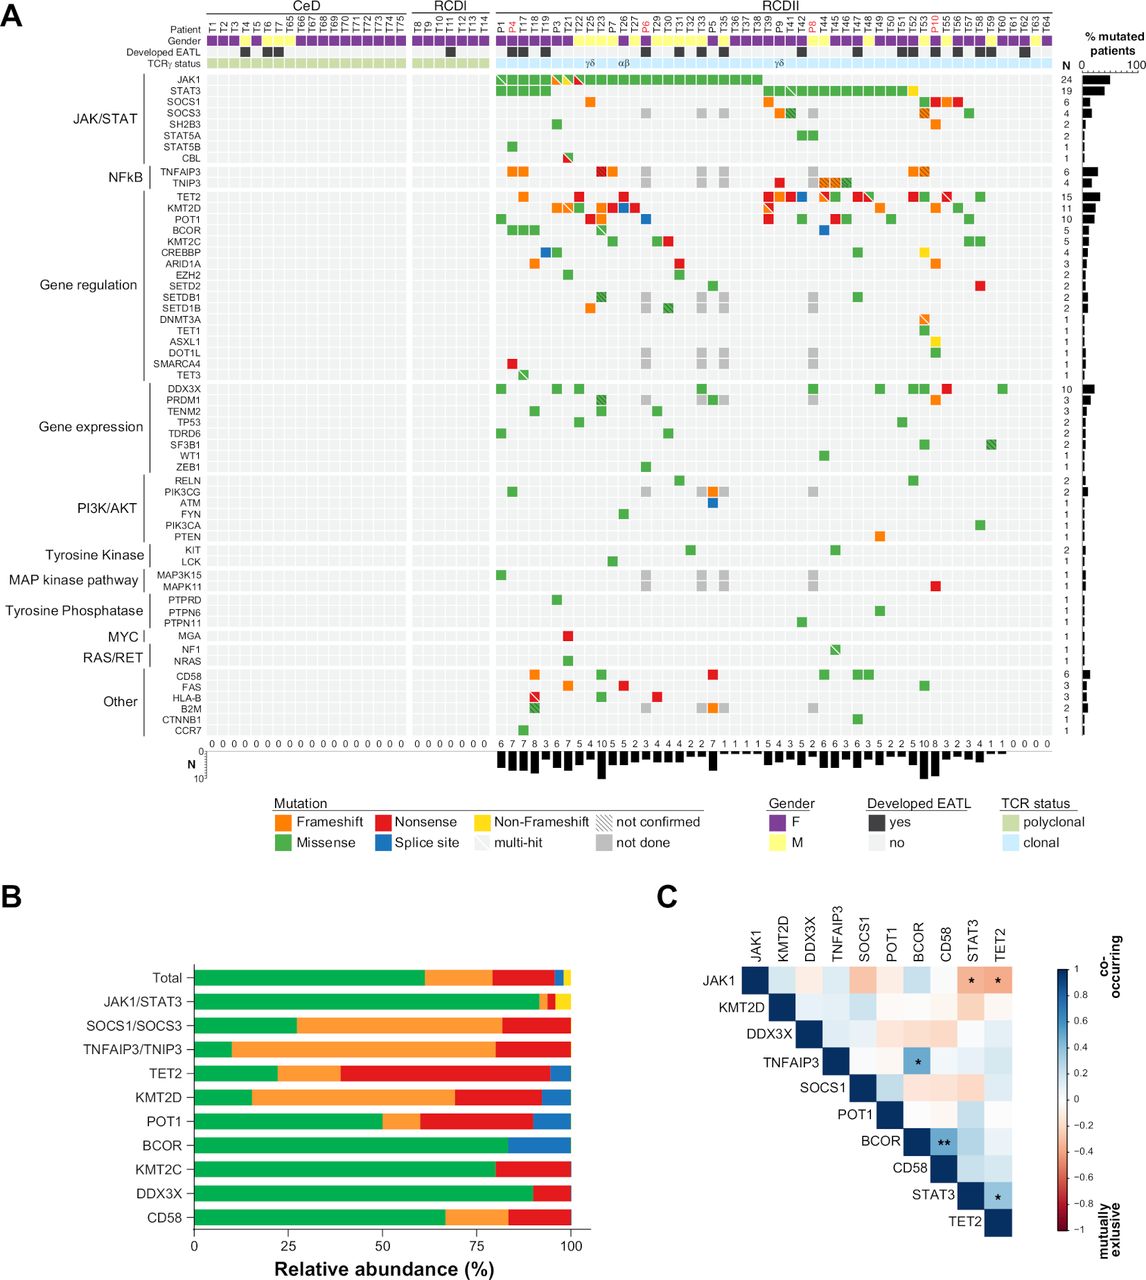
While no mutation was detected in CeD or RCDI, a mean of 3.9 mutated genes (0–10) was observed per RCDII biopsy (figure 2A). Again, the JAK-STAT pathway was the most abundantly mutated signalling pathway, with frequent mutations in JAK1 (48%) and STAT3 (38%) as well as in the negative JAK-STAT regulators SOCS1 (12%) and SOCS3 (8%). Overall, 43 out of 50 (86%) patients showed at least one somatic alteration of the JAK1-STAT3 axis. Other frequent mutations were again observed in TET2 (30%), KMT2D (22%) and DDX3X (20%), confirming the above findings. Mutations of the NF-κB regulating genes TNFAIP3 (13%) and TNIP3 (9%) were found in 22% (10/46) of RCDII biopsies tested. Globally, most mutations were missense, followed by nonsense and frameshift mutations (figure 2B). Notably, mutations in TNFAIP3/A20, TNIP3, KMT2D, TET2, SOCS1 and SOCS3 were mainly nonsense and frameshift mutations indicating their deleterious nature (figure 2B). There were, however, no detectable copy number varations (CNV) in TNFAIP3/A20 or TNIP3, in contrast to RCDII lines. Four RCDII samples (8%) did not contain any detectable mutation, either because the panel did not cover the corresponding genes or due to insufficient tissue infiltration despite detection of clonal TCRγ or TCRδ rearrangement within the same biopsy (figure 2A). The variant allele frequency (VAF) of mutations detected in whole frozen biopsies across RCDII samples ranged from 28% to 1% (online supplemental figure 4), overall suggesting that the number of mutations might be underestimated, most notably CNV. VAF of distinct mutations were also highly variable within individual samples, suggesting intratumour heterogeneity. VAF of JAK1 mutations were however largely dominant in individual samples arguing for a founding role (online supplemental figure 4). In RCDII, JAK1 mutations tended to be mutually exclusive with STAT3 and TET2 mutations (figure 2C, online supplemental tables 2 and 3), while STAT3 mutations significantly co-occurred with TET2 mutations. We also observed a striking co-occurrence of BCOR26 and TNFAIP3/A20 or CD5827 mutations (figure 2C). Patients with JAK1 mutations showed significantly higher frequencies of RCDII cells among IEL and LPL (online supplemental table 2), while patients with mutations in TNFAIP3/A20 and TNIP3 had significantly increased RCDII cells in LPL and even showed malignant cell dissemination to the PBL compartment (online supplemental table 3). We found no significant prognostic impact on overall survival in relation to the JAK1 or STAT3 mutational status (online supplemental figure 5). Contrary to NK/T-cell lymphomas,19 DDX3X mutations were not associated with an inferior prognosis in patients with RCDII.
Supplemental material
Supplemental material
Supplemental material
Supplemental material

Characterisation of type II refractory coeliac disease (RCDII)-associated somatic mutations in intestinal biopsies. (A) Heatmap summarises mutations determined by targeted next-generation sequencing (TNGS) and targeted amplicon sequencing (TAS) for individual patients (column) and genes (row), grouped by pathway or function. Mutations are colour coded according to the type of mutation and upper header bar shows sample ID and colour codes for gender, development of enteropathy-associated T-cell lymphoma (EATL) and TCRγ status as indicated in the legend. Vertical bar graph illustrates mutation frequency per gene and horizontal bar graph shows number of mutations per patient. (B) Stacked bar graph summarises relative abundance of mutation types per gene according to the colour code indicated in (A) for selected genes. (C) Correlation plot visualises co-occurrence for top 10 mutated genes in RCDII. The Pearson correlation value is coded by colour as in scale on right. Significance levels were assessed via Fisher’s exact test (***p<0.001, **p<0.01, *p<0.05).
Taken together, these data confirm the importance of the JAK1-STAT3 and NF-κB pathways as founders or drivers of RCDII pathogenesis in a large series of primary patient samples.
RCDII is characterised by increased cytokine responsiveness through mutations activating the JAK1-STAT3 and NF-κB pathways
Topographic mapping of the recurrent JAK1 and STAT3 mutations indicated predominance in the SH2 domain of STAT3 (65%) and showed that virtually all (93% 26/28) JAK1 mutations clustered at the p.G1097 position in the C-terminal JH1-kinase domain, a highly conserved position, and the site of interaction of the JAK1 negative regulator SOCS128 (figure 3A,B). Within this hotspot, the p.G1097D (14/24) variant was most frequent, followed by p.G1097V/C/S/R (25%, 8%, 4% and 4%, respectively). Of note, almost all JAK1 or STAT3 mutations not located in the JAK1 p.G1097 hotspot or in the STAT3 SH2 domain co-occurred with a JAK1 p.G1097 hotspot mutation. Exceptions included one case with the known STAT3 p.Q344H GOF mutation in the DNA-binding domain, and one with two STAT3 p.D173E/p.F174I mutations on the same allele. Mutations in TNFAIP3/A20 and TNIP3 were scattered over their N-terminal or central regions (figure 3C). Western blot analyses performed in RCDII lines revealed constitutive STAT3 phosphorylation in P4 cell line with JAK1 p.G1097D mutation and LOH, suggesting intrinsic activation of the JAK1-STAT3 pathway. Cells from P6 with homozygous JAK1 p.G1097D and P8 with heterozygous STAT3 p.D661Y mutation as well as cells from P4 displayed enhanced and sustained phosphorylation in response to extrinsic interleukin (IL)-15 stimulation when compared with normal T-cell lines. This held also true for P10-derived cells, which harboured deleterious SOCS1 and SH2B3 mutations, although to a lesser extent (figure 3D). Analysis of NF-κB activation by imaging flow cytometry revealed constitutive nuclear translocation of the NF-κB/p50 subunit in the RCDII lines derived from P5 and P6, with loss of one TNFAIP3/A20 allele (figure 3E and online supplemental figure 6) and enhanced tumour necrosis factor-α (TNFα)-induced nuclear translocation in the RCDII lines from P4, with a c.102_103insGG/p.G35 frameshift in TNFAIP3/A20, and from P10, with loss of one TNIP3 allele, when compared with the P8 cell line, with wild-type alleles for these genes (online supplemental figure 6).
Supplemental material
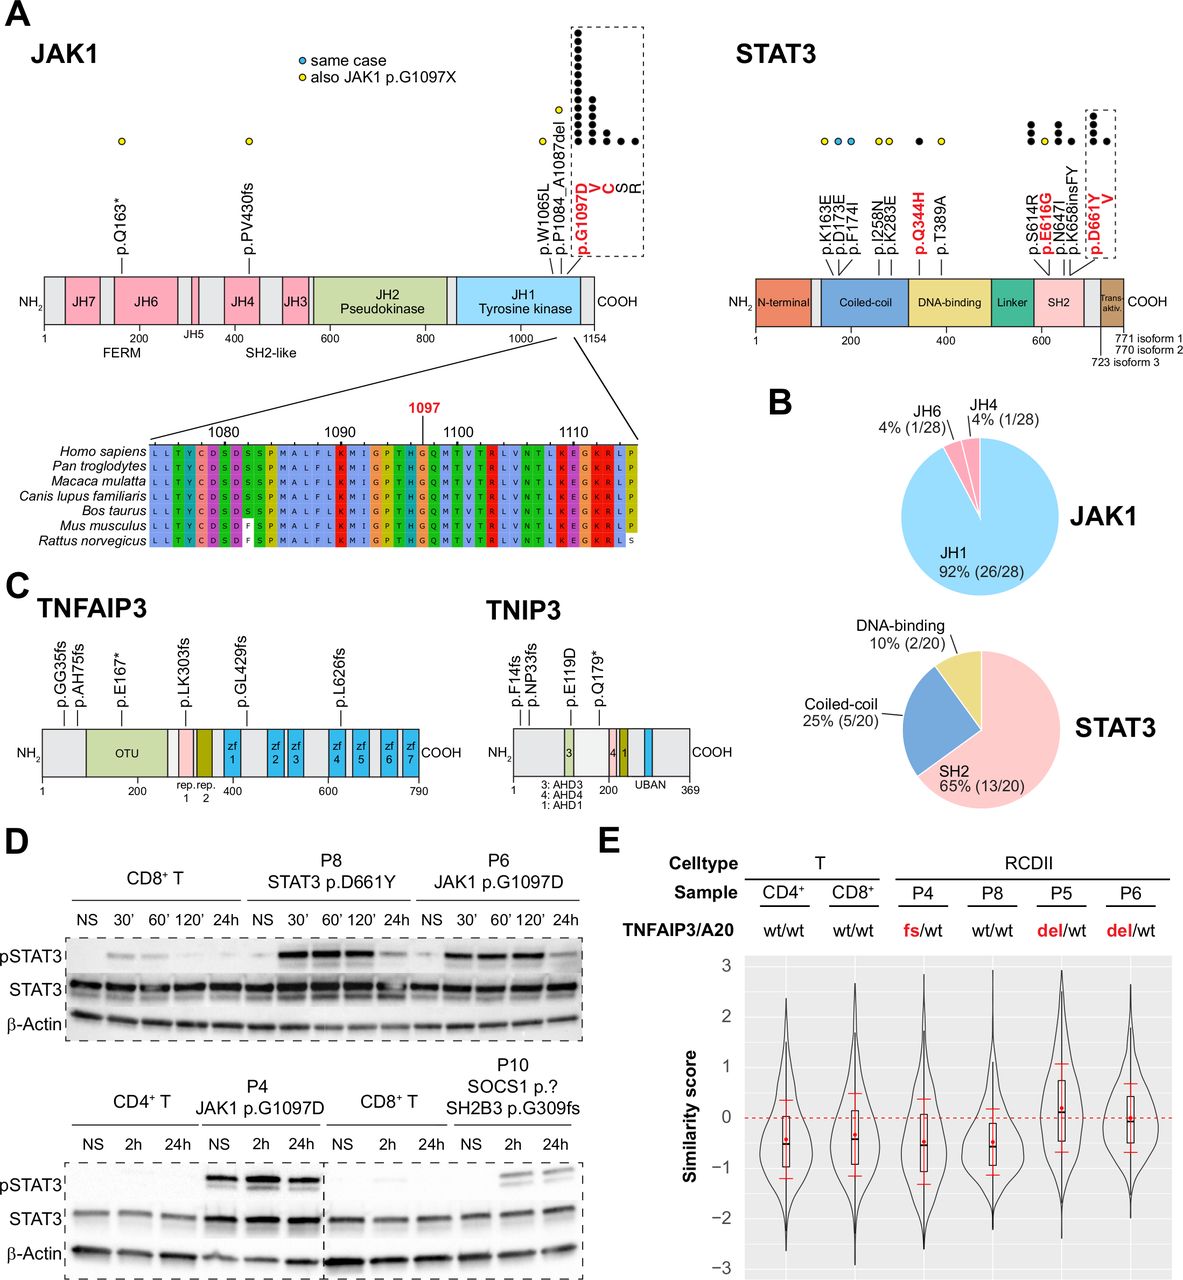
Functional analysis of JAK1-STAT3 and NF-κB pathway activating mutations in type II refractory coeliac disease (RCDII) cell lines. (A) Schematic illustration of topographic localisation of JAK1-STAT3 mutations found in RCDII and conservation plot for indicated species centred on the JAK1 p.G1097 hotspot. Dots represent mutations per position with yellow dots depicting those co-occurring with JAK1 p.G1097 hotspot mutations and blue dots for mutations found in the same patient. Mutations highlighted in red indicate known gain-of-function (GOF) variants. (B) Pie charts show relative distribution of mutations per protein domain for JAK1 and STAT3. (C) Topographic localisation of TNFAIP3/A20 and TNIP3 mutations found in RCDII. (D) Western blots for pSTAT3, STAT3 and β-actin for RCDII-cell lines from four patients and control CD3+ T-cell lines on stimulation with 20 ng/mL IL-15 for indicated time points. (E) Violin plot shows translocation scores for NF-κB/p50 in unstimulated RCDII-cell lines (n=4) and in unstimulated control CD3+ CD4+ and CD3+ CD8+ T-cell lines. Representative results from at least two independent experiments. del, deleted; fs, frameshift; IL-15, interleukin-15; NS, not stimulated; p.?, start-loss.
Altogether, these data indicate that RCDII-cells contain highly recurrent mutations in the JAK1-STAT3 and NF-κB pathways that result in their intrinsic activation and/or enhanced responsiveness to extrinsic inflammatory stimuli.
The oncogenic signatures of EATL and RCDII largely overlap and are dominated by JAK1-STAT3 mutations
EATL can complicate RCDII and, thereby, share the same clonal origin as RCDII IEL3 (RCDII-EATL) but it can also develop in CeD patients without RCDII (‘de novo’ EATL). Prognosis of EATL is better in the latter case,7 raising the possibility that distinctive oncogenic events underlie these two entities. To address this hypothesis, we compared TNGS results in biopsies obtained from RCDII-EATL (n=11) and de novo EATL (n=8).
Overall, the mutational profile of both RCDII-EATL and de novo EATL largely overlapped with that of RCDII, including recurrent GOF mutations at the JAK1 p.G1097 hotspot and in the SH2 domain of STAT3, as well as SOCS1 frameshift or nonsense mutations in two patients without JAK1 or STAT3 mutations (figure 4). Further, 37% of EATL (9/19) showed multiple JAK1 or STAT3 mutations with up to three mutations in two patients and JAK1 and STAT3 double mutations in 6 out of 19 (32%) patients. Other mutations frequently found in EATL were in KMT2D (37%), TET2 (32%), DDX3X (32%), TNFAIP3 (28%) and POT129 (26%). Interestingly, the mean number of mutations detectable by TNGS and TAS were comparable between de novo EATL and RCDII-EATL (online supplemental figure 7). There were however some minor differences as all de novo EATL but only 55% of RCDII-EATL showed at least one JAK1 mutation (p=0.045), while mutations in TNFAIP3 (p=0.036) were only found in RCDII-EATL.
Supplemental material

Mutational profiles of enteropathy-associated T-cell lymphoma (EATL) complicating type II refractory coeliac disease (RCDII) or developing de novo in coeliac disease. Heatmap summarises mutations determined by targeted next-generation sequencing (TNGS) and targeted amplicon sequencing (TAS) for individual patients (column) with de novo EATL (left block) or RCDII-EATL (right block). Genes (row) are grouped by pathway or function. Mutations are colour coded according to the type and upper header bar shows sample ID and colour codes for gender as indicated in the legend below. Horizontal bar graph illustrates frequency of mutations per gene with adjacent absolute numbers for all EATL, de novo EATL and RCDII-EATL. Vertical bars illustrate absolute counts of mutations per patient. P values are shown for categorical differences between de novo EATL and RCDII-EATL as assessed via Fisher’s exact test.
We also compared RCDII-EATL (n=9) to autologous RCDII biopsies without evidence of EATL (figures 3A and 4). Most RCDII-EATL samples showed increased VAF in whole biopsies when compared with their non-EATL controls (figure 5). Strikingly, JAK1-STAT3 and TNFAIP3/A20 mutations were never lost during progression from RCDII to EATL, supporting their founding or driving role in transformation. Of note, EATL in P4 showed particular expansion of a STAT3 p.E616G mutated clone (figure 5), a variant that was not detected in the autologous RCDII-cell line, pointing to the coexistence or emergence of various clones. When compared with autologous RCDII biopsies without EATL, RCDII-EATL samples contained additional pathogenic mutations in STAT3, SH2B3, JAK3, KMT2D, BCOR, ARID1A, SETD1B, PTPRC, PTPRD, NF1 and NOTCH1, suggesting that these newly acquired mutations represent driver events supporting RCDII transformation into EATL. Moreover, JAK1-STAT3 double mutations as well as TNFAIP3/A20 mutations tended to predispose to EATL transformation (online supplemental figure 8). Definitive demonstration of the prognostic value of these mutations to predict the risk of RCDII progression to EATL will however require analysis of more cases.
Supplemental material
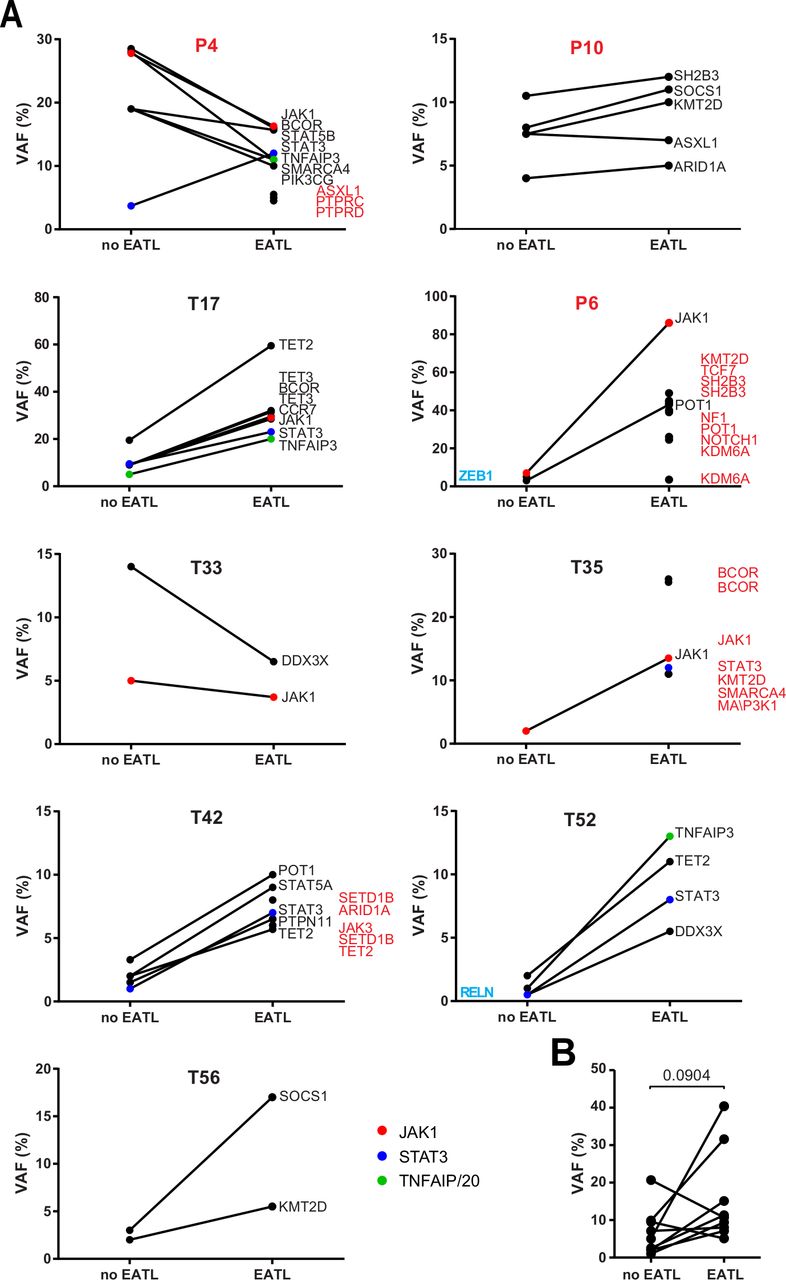
Comparison of somatic mutations during transformation of type II disease coeliac disease (RCDII) into enteropathy-associated T-cell lymphoma (EATL). (A) Before and after plots show mean variant allele frequency (VAF) of individual mutations detected in whole biopsies of RCDII cases without (no EATL) or with EATL (EATL) for individual patients. Highlighted genes were detected in only one group (blue=no EATL, red=EATL). (B) Before and after plot summarises mean VAF of RCDII samples without (no EATL) or with EATL (EATL) in each patient; p value was calculated via paired two-tailed t-test.
Overall, these data indicate that common mechanisms underlie lymphomagenesis in de novo EATL and RCDII-EATL, but with restriction of TNFAIP3/A20 mutations to RCDII-EATL, whereas JAK1 mutations were over-represented in de novo EATL.
The JAK1-STAT3 pathway is a potential therapeutic target in RCDII
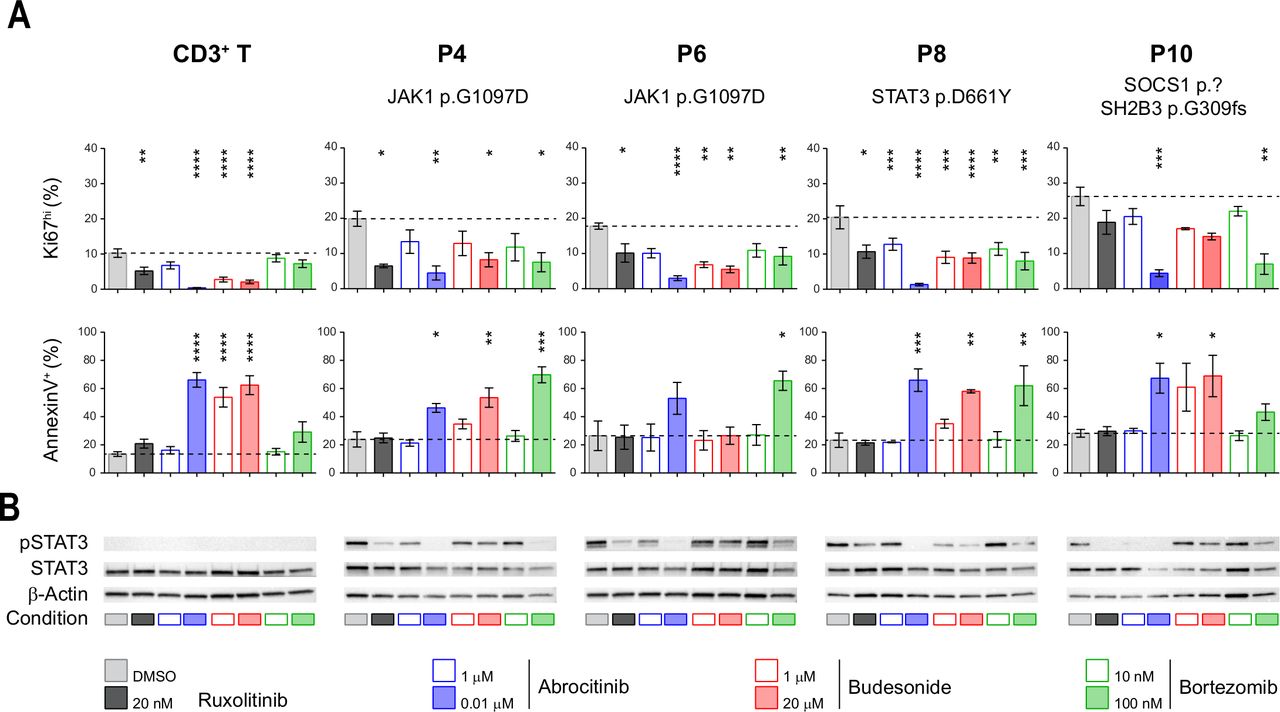
Given the severe prognosis of EATL, identifying therapies that efficiently treat RCDII and block progression to EATL is indispensable. RCDII lines were used as in vitro preclinical models to assess the therapeutic efficacy of drugs targeting the highly recurrent JAK1-STAT3 GOF mutations using ruxolitinib, which inhibits JAK1 and JAK2, and abrocitinib (PF-04965842), a specific JAK1 inhibitor.30 Their effect was compared with that of budesonide, a corticosteroid commonly used in RCDII31 and bortezomib, a proteasome inhibitor which has demonstrated efficacy in myeloma by modulating survival and apoptosis of malignant cells32 and which has also been shown to interfere with STAT3 signalling.33–35 Confirming and extending our published results in two distinct RCDII lines,10 both ruxolitinib and abrocitinib reduced proliferation, induced apoptosis and, simultaneously, inhibited STAT3 phosphorylation in all four RCDII-cell lines tested (figure 6A,B). These drugs, however, exerted comparable or even stronger effects in cultured control T-cells. Similarly, budesonide impaired survival and growth of both RCDII-cell and normal T-cell lines. Moreover, and in line with the lack of clinical response of P6 to budesonide, this drug had no effect on the RDCII line derived from intestinal biopsies of P6. In contrast, the reversible 26S proteasome inhibitor bortezomib exerted proapoptotic and/or antiproliferative effects on the 4 RCDII lines, while normal T-cell lines remained largely unaffected. Moreover, bortezomib was also able to inhibit STAT3 phosphorylation in the four RCDII lines (figure 6B).
Differential efficacy of candidate therapeutic drugs in type II refractory coeliac disease (RCDII) cell lines. (A) Bar plots show mean percentages±SD of flow cytometry-based assessment of annexin V+ (left column) and Ki67hi cells (right column) from four patients (n=3–5) and control CD3+ T-cells (n=14) after 72 hours of the indicated treatment; asterisks denote statistical significant change relative to untreated (dimethyl sulfoxide (DMSO)) condition; p values (****p<0.00001, ***p<0.001, **p<0.01, *p<0.05). (B) Representative western blots for pSTAT3, STAT3 and β-actin for RCDII-cell lines from four patients and T-cells as controls on 24 hours of treatment with indicated drugs or vehicle (DMSO).
Overall, these functional studies emphasise the relevance of JAK1 inhibitors for the treatment of RCDII and EATL. They also reveal the capacity of the proteasome inhibitor bortezomib to eliminate malignant cells while concomitantly preserving normal T-cells.
Discussion
This study, based on the largest cohort of RCDII and EATL patients to date, identifies JAK1 and STAT3 mutations in the vast majority of the 50 RCDII and 19 EATL studied, strongly supporting their driver role in CeD-associated lymphomagenesis. Almost all detected JAK1 and STAT3 variants have been reported as GOF mutations10 36 37 and, completing our previous report,10 additional RCDII-cell lines showed constitutive and/or enhanced cytokine-driven phosphorylation of STAT3. Frequent deleterious mutations of the negative JAK-STAT regulators and, notably, of SOCS1 in the rare cases without JAK1 or STAT3 mutations, further stress the outstanding role of this pathway in CeD-associated oncogenesis. A role of the JAK-STAT pathway has already been highlighted in other intestinal lymphomas. Thus, recurrent JAK3 and STAT5 GOF mutations have been observed in monomorphic epitheliotropic intestinal T-cell lymphoma, a highly aggressive lymphoma that is not associated with CeD,17 38 39 and JAK2-STAT3 fusion transcripts associated with STAT5 activation have been reported in indolent intestinal CD4+ T cell lymphomas.40 We now show that JAK1 and STAT3 GOF mutations are a hallmark of CeD-associated lymphomas. Moreover, the JAK1 p.G1097 hotspot identified in almost 50% of the cohort has been rarely reported except in ALK-negative anaplastic lymphomas (8%)36 including those developing on breast implants (18%).41 Its frequency is however less than in RCDII and EATL (50% and 68%, respectively). Together with data reported in a small number of EATL,17 39 it suggests that JAK1 p.G1097 mutations may be a diagnostic marker for CeD-associated lymphomas. Interestingly, mutations in negative regulators of NF-κB were detected in almost all RCDII-cell lines or RCDII cells sorted from blood. They were detected less frequently in biopsies of RCDII and RCDII-EATL. Many alterations were copy number variations and may not have been detected by NGS in biopsies. The tumour-suppressive function of TNFAIP3/A20 is well described.23 The role of TNIP3, a partner of TNFAIP3/A20 in the ubiquitin editing complex,22 is much less known, but TNIP3 inversion was reported in one case of indolent intestinal CD4+ T cell lymphoma.42
CeD pathogenesis has been linked to cytokines such as IFNγ, IL-21 and IL-15 that trigger the JAK-STAT pathway.43 44 Some studies have also pointed to a potential role of NF-κB signalling. Predisposing TNFAIP3/A20 and REL gene risk variants have been associated with CeD.45 TNFα, a potent activator of NF-κB, was shown to be produced by IEL46 and gliadin-specific CD4+ T cells and could promote the growth of RCDII lines in vitro.47 Of note, NF-κB and STAT3 can cooperate to promote transcription of their target genes,48 while NF-κB signalling can be limited by SOCS149 that was mutated in several patients. Mutations activating the JAK1-STAT3 and NF-κB pathways may thus synergise and, in conjunction with cytokines released in the inflammatory CeD intestine, promote the clonal expansion of malignant RCDII cells as well as stimulate their autonomous production of cytokines and their cytotoxicity against epithelial cells,8 9 overall creating the vicious circle of a genotoxic inflammatory environment that favours genomic instability, enabling accumulation of more genetic aberrations and ultimately leading to transformation into EATL. Accordingly, other potentially oncogenic mutations were observed in epigenetic modifiers such as TET2,20 KMT2D24 and in the translational regulator DDX3X.19
The overlap between the mutational fingerprints of individual RCDII cases and their corresponding EATL strongly supports the sequential model for EATL development through an intermediate RCDII phase. Of note, JAK1-STAT3 double mutations tended to predispose to progression of RCDII to EATL (online supplemental figure 8), an observation in keeping with previous demonstration of a cooperative effect of STAT3 and JAK1 GOF mutations in malignant transformation.36 Despite minor differences, the mutational profile of de novo EATL and RCDII-EATL was very similar, suggesting comparable mechanisms of lymphomagenesis. Along this line, diagnosis of de novo EATL was made in all cases at the same time or shortly after CeD (data not shown). This observation, which is coherent with previous reports,50 further stresses the role of chronic inflammation in promoting EATL development. Overall, the much more severe prognosis of RCDII-EATL cannot be explained by a distinct mutational profile. An alternative hypothesis is that RCDII provides a reservoir of malignant cells with little sensitivity to chemotherapeutic regimens used in EATL (as they do not divide actively) from which relapse can develop.
Our results indicate that blockade of the JAK1-STAT3 pathway is one therapeutic option to inhibit the growth of malignant RCDII cells and prevent progression into EATL. Benefits and risks however require careful consideration. JAK1 inhibitors had a profound impact on RCDII cells but also on normal T-cell lines, which is in line with their known negative effect on the activation of cytotoxic lymphocytes, some of which may harbour antitumour function.51 Conversely, JAK inhibitors exert anti-inflammatory effects and may thereby help switch off the vicious circle that promotes CeD-associated lymphomagenesis, a benefit that could outweigh the risk of impaired tumour surveillance.52 Interestingly, bortezomib, a drug approved for the treatment of multiple myeloma,32 selectively impaired the growth of RCDII-cell lines. As described in myeloma, inhibition of RCDII cells may result from the stabilising effect of bortezomib on proteins that stimulate apoptosis and inhibit cell-cycle progression53 but also on its inhibitory effect on STAT3 phosphorylation in RCDII cells.33–35 Therapies combining JAK1 inhibitors and bortezomib were shown to increase therapeutic efficacy in myeloproliferative neoplasia54 and may thus be worthy of consideration in RCDII. Mutations identified in epigenetic modifiers provide additional clues to design personalised treatments adapted to the mutational profile of individual RCDII cases and to minimise the risk of progression to EATL.
In conclusion, the mutational landscape of CeD-associated lymphoid malignancies points to convergent mechanisms driving lymphomagenesis in RCDII and EATL. Our results support a scenario in which the cytokines present in the chronically inflamed CeD intestine contribute to the clonal outgrowth of innate-like IEL carrying highly recurrent JAK1-STAT3 GOF mutations that synergise with mutations impairing NF-κB regulation to foster transformation. Besides shedding new insight into the pathogenesis of CeD-associated lymphomagenesis, our work provides the rationale for new therapeutic strategies that may prevent RCDII progression to EATL and improve the prognosis of these most severe complications of CeD.
Data availability statement
All data relevant to the study are included in the article or uploaded as supplementary information. The data that support the findings of this study are available from the corresponding author, nadine.cerf-bensussan@inserm.fr, upon reasonable request.
Ethics statements
Patient consent for publication
Ethics approval
The study was approved by the Ile-de-France II ethical committee (Paris, France) with INSERM as study promoter (C08-34).
References
Supplementary materials
Supplementary Data
This web only file has been produced by the BMJ Publishing Group from an electronic file supplied by the author(s) and has not been edited for content.
- Data supplement 1
- Data supplement 2
- Data supplement 3
- Data supplement 4
- Data supplement 5
- Data supplement 6
- Data supplement 7
- Data supplement 8
- Data supplement 9
- Data supplement 10
- Data supplement 11
- Data supplement 12
- Data supplement 13
- Data supplement 14
- Data supplement 15
- Data supplement 16
- Data supplement 17
Footnotes
CC, VA and NC-B are joint senior authors.
LL, GM and SB contributed equally.
Collaborators The authors would like to thank all clinicians and pathologists for contributing in diagnostic approach and for helping with sample management in the CELAC network: Yoram Bouhnik, Charles-André Cuenod, Sabine Brechignac, Matthieu Allez, Jacques Cosnes, Agnès Fourmestraux, Jean-Charles Delchier, Jehan Dupuis, Corinne Haioun, Taoufik El Gnaoui, Eric Lerebours, Guillaume Savoye, Herve Tilly, Bernard Flourie, Bertrand Coiffier, Xavier Hebuterne, Nadia Arab, Jérôme Filippi, Stéphane Schneider, Frank Zerbib, Noel Milpied, Krimo Bouabdallah, Reza Tabrizi, Stéphane Vigouroux, Arnaud Pigneux, Thibaut Leguay, Marie-Sarah Dilhuydy, Charles Dauriac, Serge Bologna, Cyrille Hulin, Caroline Bonmati, Fréderic Magnin, Dana Ranta, Tamara Matysiakbudnik, Eric Deconinck, Philippe Pouderoux, Bruno Bonaz, Remy Gressin, Franck Carbonnel, Jean-Marc Gornet, Julien Branche, Georgette Saint-Georges, Jean-Marie Reimund, Stéphane Nancey, Maria Nachury, Stéphanie Viennot, Camille Zallot, Bettina Fabiani, Lysiane Marthey, Karine Juvin, Yann Le Baleur, Sandy Kwiatek, Eric Saillard, Dominique Louvel, Xavier Roblin, Philippe Beau, Pierre Feugier, Laurent Peyrin-Biroulet, Hélène Zanaldi, Hedia Brixi-Benmansour, Guillaume Cadiot, Thierry Lecomte, Jean-Francois Bretagne, Olivier Casasnovas, Denis Caillot, Laurent Bedenne, Jacques-Olivier Bay, Corinne Bouteloup, Bernard Duclos and Carine Foucaud.
Contributors Conception and design of the study: SC, VA, NC-B. Patient care and clinical data acquisition: GM, ShK, MC, DS, OH, CC. Biological data generation and analysis: SC, LL, SB, AT, NG, PV, SK, BM, MD, MB, BT, NC, CB-F, JB, TJM, EM. Data interpretation: SC, LL, GM, AT, VA, NC-B. Drafting of the manuscript: SC, LL, AT, NC-B. All authors reviewed and approved the final manuscript.
Funding This work was supported by institutional grants from INSERM and Université de Paris and by grants from ANR (Nr18-CE14-0005), Foundation ARC-Recherche Clinique (PGA1 RF20180206809), Foundation Princesse Grace and Association Française Des Intolérants au Gluten (AFDIAG). Institute Imagine is supported by the Investissement d’Avenir grant ANR-10-IAHU-01. SC is supported by ANR and AT received a fellowship from ARC.
Competing interests None declared.
Provenance and peer review Not commissioned; externally peer reviewed.
Supplemental material This content has been supplied by the author(s). It has not been vetted by BMJ Publishing Group Limited (BMJ) and may not have been peer-reviewed. Any opinions or recommendations discussed are solely those of the author(s) and are not endorsed by BMJ. BMJ disclaims all liability and responsibility arising from any reliance placed on the content. Where the content includes any translated material, BMJ does not warrant the accuracy and reliability of the translations (including but not limited to local regulations, clinical guidelines, terminology, drug names and drug dosages), and is not responsible for any error and/or omissions arising from translation and adaptation or otherwise.