Article Text

Abstract
Objective Gastro-oesophageal reflux disease (GERD) has heterogeneous aetiology primarily attributable to its symptom-based definitions. GERD genome-wide association studies (GWASs) have shown strong genetic overlaps with established risk factors such as obesity and depression. We hypothesised that the shared genetic architecture between GERD and these risk factors can be leveraged to (1) identify new GERD and Barrett’s oesophagus (BE) risk loci and (2) explore potentially heterogeneous pathways leading to GERD and oesophageal complications.
Design We applied multitrait GWAS models combining GERD (78 707 cases; 288 734 controls) and genetically correlated traits including education attainment, depression and body mass index. We also used multitrait analysis to identify BE risk loci. Top hits were replicated in 23andMe (462 753 GERD cases, 24 099 BE cases, 1 484 025 controls). We additionally dissected the GERD loci into obesity-driven and depression-driven subgroups. These subgroups were investigated to determine how they relate to tissue-specific gene expression and to risk of serious oesophageal disease (BE and/or oesophageal adenocarcinoma, EA).
Results We identified 88 loci associated with GERD, with 59 replicating in 23andMe after multiple testing corrections. Our BE analysis identified seven novel loci. Additionally we showed that only the obesity-driven GERD loci (but not the depression-driven loci) were associated with genes enriched in oesophageal tissues and successfully predicted BE/EA.
Conclusion Our multitrait model identified many novel risk loci for GERD and BE. We present strong evidence for a genetic underpinning of disease heterogeneity in GERD and show that GERD loci associated with depressive symptoms are not strong predictors of BE/EA relative to obesity-driven GERD loci.
- Barrett's oesophagus
- gastro-esophageal reflux disease
- genetics
- oesophageal reflux
Data availability statement
Data are available in a public, open access repository. Data are available upon reasonable request. All data relevant to the study are included in the article or uploaded as supplementary information. The MTAG GWAS summary statistics on GERD (study accession GCST90000514) and BE (GCST90000515) can be obtained from the GWAS catalog (ebi.ac.uk). Sources for the individual GWAS summary statistics used in the multi-trait model are listed in Supplementary Information. GWAS summary statistics for the 23andMe samples are available via direct request to 23andMe (dataset-request@23andMe.com; a data transfer agreement is required). The raw genetic and phenotypic UK Biobank data can be obtained via direct application to the UK Biobank (http://www.ukbiobank.ac.uk/).
This is an open access article distributed in accordance with the Creative Commons Attribution Non Commercial (CC BY-NC 4.0) license, which permits others to distribute, remix, adapt, build upon this work non-commercially, and license their derivative works on different terms, provided the original work is properly cited, appropriate credit is given, any changes made indicated, and the use is non-commercial. See: http://creativecommons.org/licenses/by-nc/4.0/.
Statistics from Altmetric.com
Significance of this study
What is already known on this subject?
Gastro-oesophageal reflux disease (GERD) is a common but heterogeneous disorder, which increases one’s risk of developing Barrett’s oesophagus (BE) and oesophageal adenocarcinoma (EA). Previous studies have identified 25 genetic loci, which confer risk for a broad GERD phenotype and have shown genetic overlaps with risk factors such as obesity and depression.
What are the new findings?
By leveraging genetic data on BE, GERD and its risk factors in a multitrait model, we identified 88 risk loci for GERD and seven novel loci for BE. Stratifying the GERD loci by association on body mass index and depression revealed differences in gene expression across tissue types. Only loci falling in an obesity-driven GERD subgroup predicted the risk of BE/EA.
How might it impact on clinical practice in the foreseeable future?
This study markedly increases our knowledge of the specific genes conferring GERD and BE risk. One subset of the GERD genes acts along a depression-driven GERD axis (and typically does not lead to downstream alterations of BE/EA risk), while another subset demarcates an obesity-driven GERD axis, whereby a person’s genetic risk of GERD is likely to translate to a subsequent increase in risk of BE and EA.
Introduction
Gastro-oesophageal reflux disease (GERD) is a complex condition with different consensus statements using a variety of clinical, endoscopic and physiological criteria to define the disease.1–3 Although in a narrow sense, GERD can be considered the result of pathological oesophageal acid exposure4, the heterogeneous definition of GERD may help explain the range of traits that have been associated with GERD risk including obesity and psychological traits.5 6 GERD has risen in prevalence in many western countries in recent years and it now accounts for a substantial proportion of direct healthcare costs for digestive diseases.7 GERD is the major risk factor for Barrett’s oesophagus (BE), a precancerous condition in which GERD-induced erosions of the distal oesophageal squamous epithelium are replaced by metaplastic columnar epithelium.8 Most oesophageal adenocarcinomas (EA), a lethal malignancy with poor survival, arise from underlying BE tissue.9
Recent studies have sought to better understand GERD and its downstream consequences (BE, EA) by identifying the genes influencing risk of GERD. For most complex conditions, the most successful study design has been the genome-wide association study (GWAS), with large sample size and a key feature in successful studies. Initial GWAS for GERD failed to identify any risk genes,10 11 but more recent approaches using a broad phenotype definition to maximise sample size identified 25 risk loci.12 The recent GWAS also revealed strong genetic relationships between GERD and a variety of traits.12 For example, there was a strong genetic correlation between depression and GERD, likely reflecting the psychological component previously shown to be associated with GERD.13 Another genetically correlated trait was obesity, an expected result given being overweight is a major risk factor for GERD.14
In this study, we took advantage of the genetic overlap between GERD and other traits12 to improve our power for gene discovery on GERD and BE. Because some of the traits most strongly correlated to GERD have been subjected to GWAS on a very large scale, there is potential for a large increase in gene mapping power if a multitrait approach is taken. We, hence, employed a multitrait approach using GERD and BE, alongside three traits, which had large sample sizes and high correlation with GERD: obesity, depression and educational attainment (EDU). We then replicated the GERD and BE loci in a large replication cohort and conducted gene enrichment and transcriptome-wide association analyses. Finally, using BE as a clinical endpoint indicative of pathological erosive chronic acid reflux (rather than forms of symptomatic reflux associated with psychological traits such as depression), we then assessed the relevance of subsets of the GERD loci to serious oesophageal disease.
Methods
Detailed methods are provided in online supplemental materials.
Supplemental material
Overview of methods
Leveraging the strong genetic correlation between GERD and related traits, we applied a multitrait GWAS model combining GWASs for body mass index (BMI), major depressive disorder (MDD), education attainment and GERD (and BE), to identify more susceptibility loci for GERD and BE (figure 1). The brief description for each input GWAS in the multitrait GWAS analysis and the equivalent effect sample size is shown in online supplemental table ST1. Candidate loci for GERD and BE achieving genome-wide significance (p<5e-8) were sent for replication in the independent 23andMe cohort (4 62 753 cases; 1 127 474 controls). Findings from these GWAS analyses were followed up with transcriptome-wide association studies (TWAS) and tissue enrichment analyses. TWAS analysis allows us to infer if there is a relationship between predicted gene-expression levels and GERD/BE risk. Tissue enrichment analyses allow us to assess whether the relevant GERD/BE-associated genes showed differential enrichment across 44 human tissues including oesophageal-related tissues. We finally applied a simple heuristic to dissect aetiological heterogeneity in GERD by separating GERD risk loci into obesity-driven and depression-driven categories; we then assessed these categories for differences in predicted gene expression in various tissues and for their ability to predict BE/EA susceptibility.
Supplemental material

Schematic diagram describing overall study approach of the multi-trait GWAS analysis for GERD and BE susceptibility. GWAS data obtained from published studies are shown in bold. BE,Barrett’s oesophagus; EA,esophageal adenocarcinoma; EDU, Education Attainment; GERD,gastro-oesophageal reflux disease; GWAS, genome-wide association study; MDD, major depressive disorder; MTAG,multitrait analysis of GWAS; PGC, Psychiatric Genomics Consortium; QSKIN, Queensland Sun and Health Study; SSGAC, Social Science Genetics Association Consortium; UKBB, UK Biobank. Traits within the blue/red boxes are traits selected for the multi-trait GWAS analysis for GERD (blue) and BE (red). The trait BE was not modelled in the MTAG model for GERD, to avoid sample overlap bias in the genetic prediction analysis for GERD into the BE/EA datasets. Asterisk (*) highlights genetic correlation estimates for each trait against GERD (shown by the blue arrows) obtained from previous An et al 12 findings.
Results
Multitrait analysis reveals 88 risk loci for GERD and 17 for BE with strong evidence of replication
In our multitrait GWAS combining GERD with BMI, MDD and EDU, we identified 88 GERD risk loci, where one or more single nucleotide polymorphisms (SNPs) exceeded genome-wide significance (5×10⁻⁸). There was no evidence for inflation of the GWAS test statistic (LD-Score intercept <1, QQ-plot in online supplemental figure 1). The association estimates for each of the 88 lead SNPs are presented in online supplemental table ST2. To benchmark the power improvement resulting from our multitrait approach, we compared the average χ2 test statistic for GERD from the multitrait GWAS (1.72) with that from the standard univariate GWAS (1.44); the increase corresponds to an estimated increase in GERD effective sample size of 64% (estimated via ratio of genomic inflation: (1.72–1)/(1.44–1)).12
Supplemental material
The GWAS Manhattan plot for the multitrait GERD GWAS along with the circular Manhattan plot showing the contribution of the BMI and depression associations to the multitrait GERD GWAS are shown in figures 2A and 3. The associations between independent genome-wide significant GERD loci in the multitrait GWAS model (multitrait analysis of GWAS (MTAG)) against BMI, EDU and MDD are tabulated in online supplemental table ST3. The linkage disequilibrium among SNPs in each of the 88 GERD loci is displayed via locusZoom plots in online supplemental figure 2). The vast majority (78 of 88) of the GERD–MTAG associations replicated at an uncorrected p<0.05 level in the independent GERD validation sample from the 23andMe cohort, with 59 significant at p<0.05 after Bonferroni correction (ie, p<8.4×10⁻⁴) for 88 tests (online supplemental table ST2). The effect sizes for GERD in the MTAG and 23andMe replication analyses were highly consistent (r2=0.85) (figure 4A).
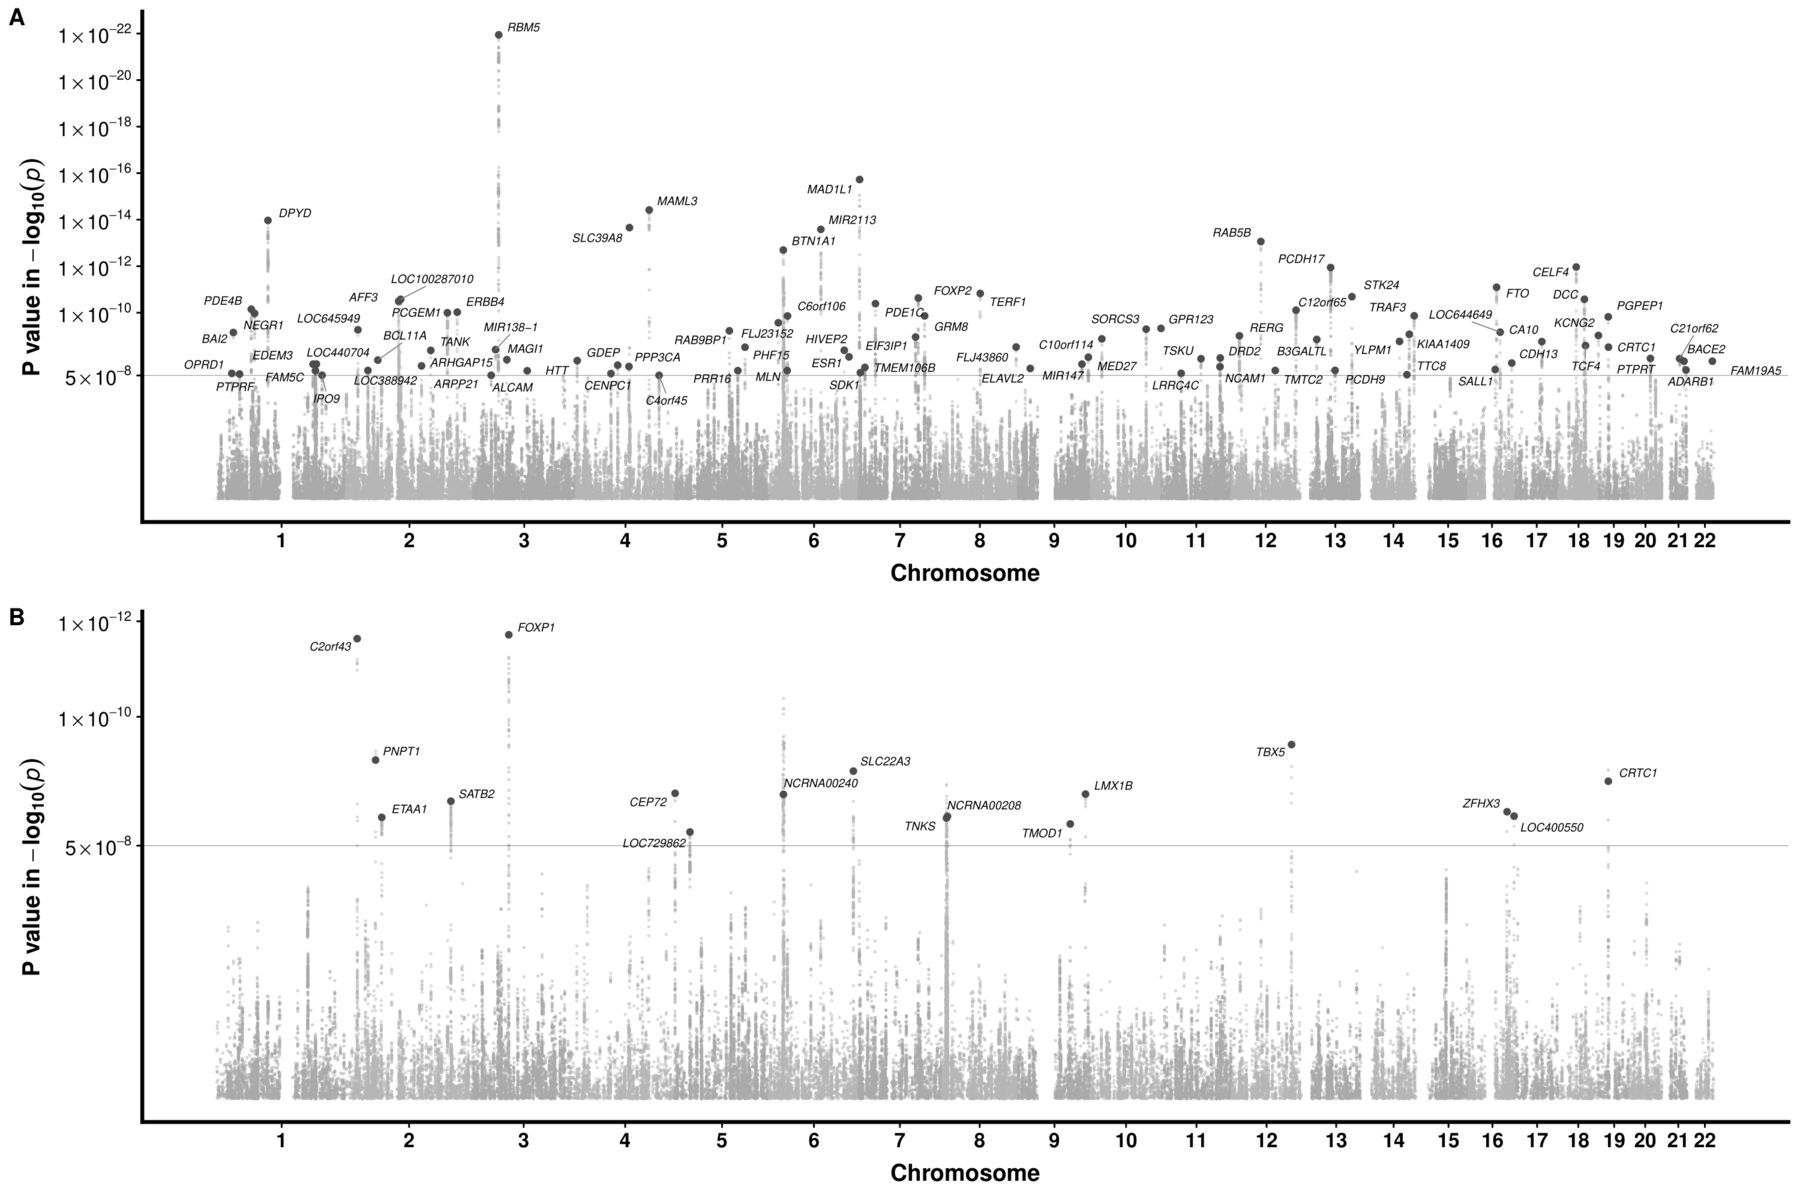
Manhattan plot for the multi-trait meta-analysed GWAS of GERD and BE. (A) for GERD; (B) for BE. The red dotted line indicates the genome-wide significance threshold at p=5×10⁻⁸. Single nucleotide polymorphisms (SNPs) with p values <0.01 were not shown. Loci with GERD association exceeding this threshold are deemed as a genome-wide GERD loci and followed up with the replication analysis in 23andMe. Each of the genome-wide loci is denoted with a red dot followed by the name of the relevant gene mapped through location proximity and expression quantiative trait loci (eQTL) information. BE,Barrett’s oesophagus; GERD, gastro-oesophageal reflux disease; GWAS, genome-wide association study.
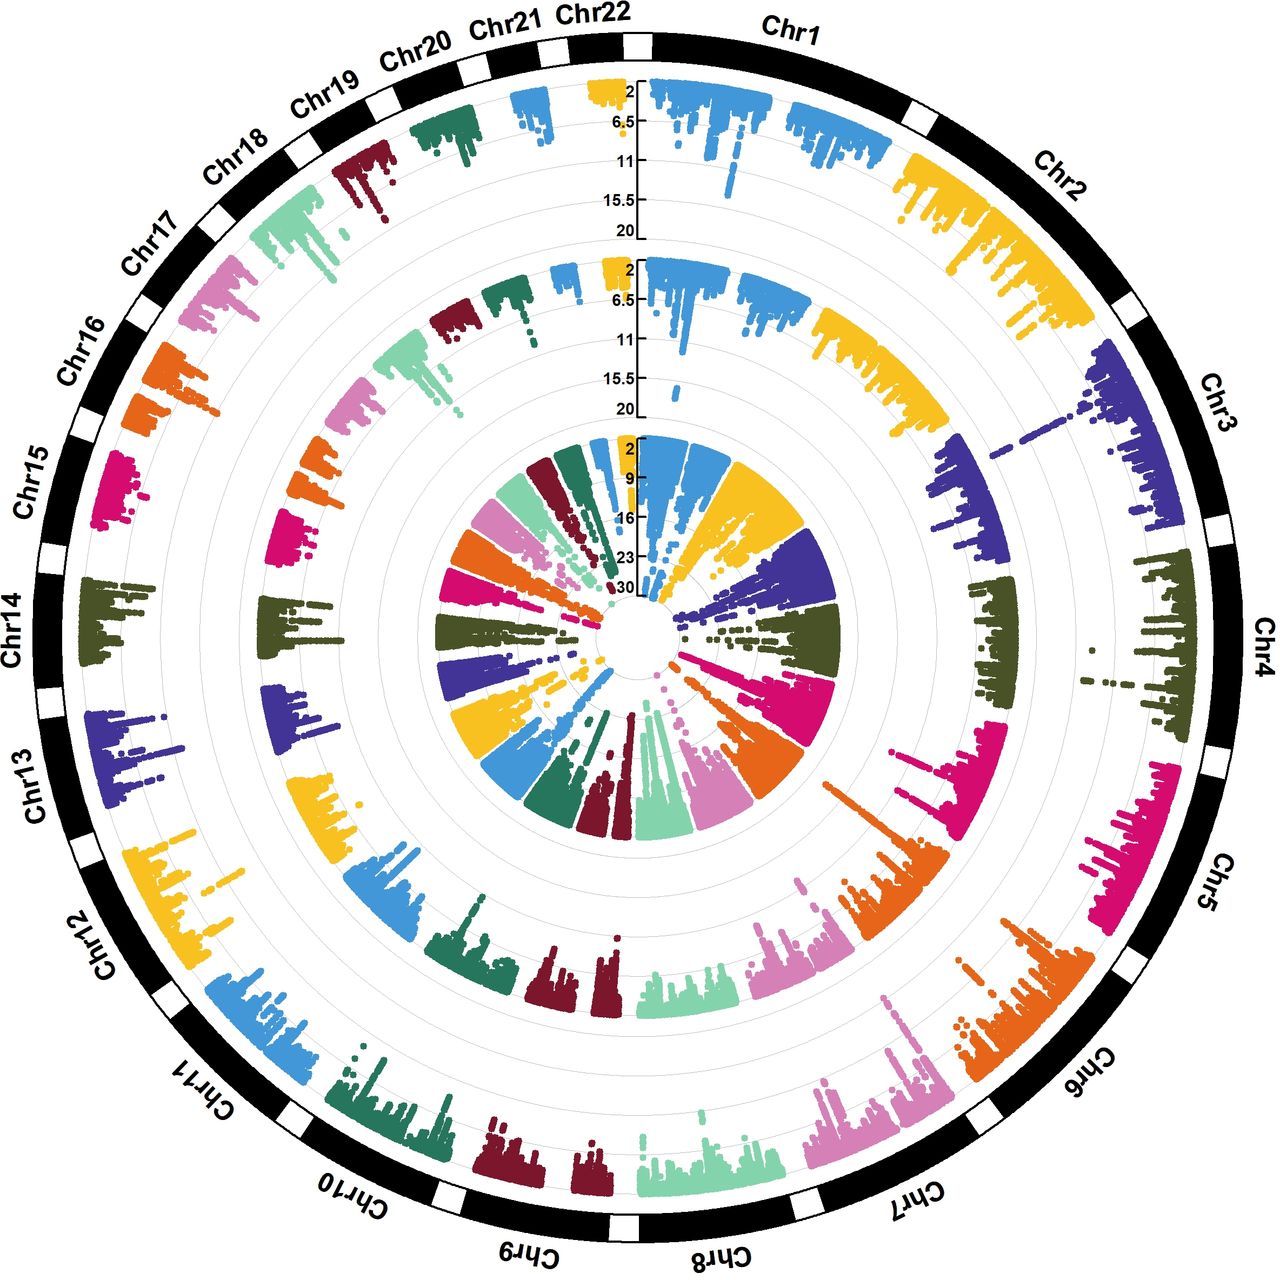
The circular Manhattan plot for BMI, MDD and the multitrait (MTAG) GERD GWAS. The trait from the innermost circle belongs to the (GIANT+UKB) Yengo et al. BMI GWAS39, followed by the Howard et al. (excluding 23andMe) MDD GWAS40 and the result from our multi-trait GERD GWAS. The plot illustrates different patterns of colocalisation between GERD and MDD/BMI for some regions, contributing to the genetic heterogeneity within GERD. BMI,body mass index; GERD, gastro-oesophageal reflux disease; GWAS, genome-wide association study; MDD, major depressivedisorder;MTAG, multitrait analysis of GWAS.

Replication of GERD and BE association for the genome-wide significant loci from MTAG analysis on GERD and BE in the 23andMe cohort. A refers to the findings for GERD; (B) for BE. Data points that are shaded in blue are those that have a Bonferroni corrected p value below 0.05/88 for GERD and 0.05/17 for BE. Both the x- and y-axes represent log(OR) for GERD/BE and points are plotted with error bars representing one SE. Most of our GERD and BE loci showed strong evidence of being replicated, although the estimated effect size for GERD/BE in the 23andMe cohort were on average smaller than those estimated in the MTAG analysis (slope ~0.5 for both traits). BE,Barrett’s oesophagus; GERD, gastro-oesophageal reflux disease; MTAG, multitrait analysis of genome-wide association studies, SNP, single nucleotide polymorphism.
Our MTAG GWAS analysis focusing on BE discovered 17 BE susceptibility loci achieving genome-wide significance. Of these, 14 replicated at p<2.9×10⁻³ (0.05/17) in the independent 23andMe BE case–control cohort (online supplemental table ST4; QQ-plot in online supplemental figure 1). Relative to Gharahkhani et al,[15 %5D, seven of the loci were novel (rs2861695, rs10080150, rs10039754, rs622217, rs11792928, rs739414 and rs7187365). The effect sizes for BE in the MTAG and 23andMe replication analyses were highly consistent (figure 4B). Regional locusZoom plots for these novel loci are in online supplemental figure 3.
To assess whether our MTAG results were robust against issues of phenotypic heterogeneity, due to the use of self-report and inference through medication data that are diagnostically less reliable, we repeated our multitrait GWAS analyses using only GERD defined through the International Classification of Disease, tenth version (ICD-10) code (for GERD MTAG) and pathologically confirmed BE diagnosis (for BE MTAG). Differences in GERD and BE definition made no meaningful difference to the results, with strong correlations (r2 >0.99) observed between the SNP effect sizes of the original and revised MTAG models for both the GERD and BE analyses (online supplemental figures 4 and 5). Moreover, results from the MTAG BE model excluding MDD and EDU were not meaningfully different from the BE+GERD+BMI+MDD+EDU model (online supplemental table ST5), suggesting that at least for these BE risk loci, the associated SNPs act on BE risk either via BMI or via pathways to GERD, which are not shown to be robustly related to traits such as MDD.
Transcriptome-wide association analyses reveal more than 200 genes associated with GERD and 49 with BE
Our metaXcan TWAS for GERD identified 37 significant genes when using expression quatitative trait loci (eQTL) information specifically derived from oesophageal muscularis tissue. Similarly, TWAS on gastro-oesophageal junction and oesophageal mucosa tissue identified 19 and 37 genes, respectively (online supplemental table ST6). As well as conducting TWAS on the three oesophageal tissues above, we also employed a TWAS approach using a much broader range of tissues types in multiXcan; this identified 212 significant genes after multiple testing corrections (see online supplemental table ST7).
A multiXcan TWAS for BE identified 49 significant genes using a weighted SNP-eQTL association across multiple tissues (online supplemental table ST8). For a TWAS focusing solely on each of the three oesophageal-related tissues, we identified fewer significant genes (<10 per tissue, online supplemental table ST9). Among the genes identified via TWAS, 31 genes were associated with both GERD and BE (online supplemental figure 6).
Tissue enrichment analysis shows enrichment of GERD-associated genes in brain tissues, but limited findings for BE genes
A tissue enrichment analysis based on the GERD genes mapped via the integrative web-based platform FUMA (available at http://fuma.ctglab.nl) for functional annotation revealed strong evidence for differential expression among brain tissues, but with no clear signal in oesophageal tissues (online supplemental figure 7). For BE-associated genes, moderate enrichment was seen in brain Cerebellar hemisphere, brain cerebellum, colon, bladder and oesophageal tissues (both in the gastro-oesophageal junction and the oesophagus muscularis), although the p values became nonsignificant after correction for multiple comparisons.
PheWAS analysis on novel hits for BE shows pleiotropic associations with other complex traits
As expected given our study design, and consistent with previous findings, the majority of GERD loci showed pleiotropic associations with a variety of anthropometric traits, education level, behavioural traits (including smoking).12 Several GERD genes were also associated with sarcoidosis, sleep duration and proxies of physical activity (online supplemental figure 8). A brief summary of our look-up for GERD loci driven by obesity and depression is in online supplemental table ST10.
For BE, again our study design leverages multiple input traits and, hence, pleiotropic associations are expected. PheWAS plots for the seven novel BE loci against traits available in the OpenTarget platform are provided in online supplemental figure 9. The BE-associated SNP rs10080150 is associated with risk of ulcerative colitis16, and rs7187365 and rs10039754 are associated with diaphragmatic hernia. Numerous BE SNPs (rs622217, rs10080150, rs11792928) showed pleiotropic associations with cardiovascular traits.
Genetic heterogeneity among the obesity-driven/depression-driven GERD subgroups showing differential patterns of enrichment on oesophageal tissues and genetic prediction onto BE/EA
Of the 88 genome-wide GERD loci, we categorised 27 as depression-driven, 46 as obesity-driven GERD loci and 15 as indeterminate/unclear based on their relative contribution to GERD in the multitrait model. We then sought to validate these categories using two separate approaches.
In our first approach, we compared the categories in a tissue enrichment-based analysis. The mapped genes for SNPs from each category using eQTL information and proximity are shown in online supplemental tables ST11 and ST12.17 While the regulation of gene expression was shown to be predominantly observed in brain tissues for the complete set of 88 genome-wide significant genetic loci, there were clear differences in the trend of gene expression across tissue types in the stratified obesity and depression driven subgroups (figure 5). Results for the directional (upward and downward separately) differential regulation for both subgroups are presented in online supplemental tables ST13 and ST14; directional regulation plots and gene expression heatmaps in online supplemental figures 10-13. Genes mapped in the depression GERD subgroup remain predominantly expressed in brain tissues. In contrast, for genes in the obesity GERD subgroup as well as there being expression in brain tissues, a clear signal can be seen in oesophageal tissues (online supplemental figure 10).

MAGMA gene-based tissue enrichment analysis for categorised functional and non-functional GERD gene sets on 53 human tissues. The dotted line represents the Bonferroni corrected significance threshold. While both the obesity-driven and neuropsychiatric-driven GERD genes were differentially expressed in brain tissues, only the regulation of gene expression in oesophageal tissues were detected from the obesity GERD gene set. Another observation is that the pattern of regulation is more pleiotropic across tissues for the obesity GERD set, consistent with the complex architecture of adiposity. The results for up-ward and down-ward regulation of gene expression can be viewed in online supplemental materials. GERD,gastro-oesophageal reflux disease
In our second approach, we compared the SNP effect sizes for GERD with those from an independent BE/EA GWAS. Based on the 88 GERD susceptibility loci from the MTAG analysis, each one unit (log(OR)) increase in risk of BE/EA was associated with a 0.6 (p=4.2×10⁻¹⁰) unit (log(OR)) increase in GERD susceptibility (figure 6; summary data for BE/EA for the 88 GERD SNPs available in online supplemental table ST15). However, the Cochran Q statistics for the derived overall estimate suggested substantial evidence for effect size heterogeneity among GERD SNPs (p heterogeneity <0.001), indicating the potential for multiple biological mechanisms in action (online supplemental table ST16). We, hence, followed up with an association analysis for BE/EA based on the two GERD subgroups. For GERD SNPs shown to be driven by obesity, the magnitude of association with BE/EA was 0.75 (p=3.9×10⁻¹⁰) per unit log(OR) increase in GERD. In contrast, for GERD SNPs driven by neuropsychiatric factors correlated with depression, the magnitude of association with BE/EA was only 0.22 (p>0.05). The estimated effect size on BE/EA between the groups was substantially different (p value for difference=0.02). The inferences drawn for BE and EA taken separately were similar to the combined BE/EA findings (online supplemental figures 14 and 15). Importantly, adjusting for BMI did not completely attenuate the genetic relationship between obesity-driven GERD and BE/EA (online supplemental table ST17).

Estimation of the genetic association between GERD and BE/EA, stratified by genetic GERD subtypes. Each of the slopes represents the estimated magnitude of association between per unit increase in log(OR) of GERD on log(OR) of BE/OA, for all GERD loci (line in blue), obesity-driven GERD loci (line and points in green), and neuropsychiatric-driven GERD loci (line and points in orange) using an inverse variance weighted regression model. Cochran Q statistics indicated strong heterogeneity in the overall all-GERD estimate (p<0.001). In the stratified analysis, it becomes apparent that the overall estimate was primarily driven by the much stronger effect sizes from the obesity-driven GERD loci subset. BE,Barrett’s oesophagus (or Barrett’s esophagus); EA, oesophageal adenocarcinoma (or esophageal adenocarcinoma); GERD, gastro-oesophageal reflux disease; MTAG, multitraitanalysis of GWAS; SNP, single nucleotide polymorphism.
Discussion
Leveraging the known genetic correlation between GERD diagnosis with depression, EDU and anthropometric traits, we identified 88 independent GERD loci, with more than two-thirds showing clear evidence of replication in the independent 23andMe cohort. Applying a similar multitrait model, we also discovered seven additional risk loci for BE that have not been previously reported. To the best of our knowledge, this is also the first study to have presented clear evidence for the existence of genetic subgroups within the complex and heterogeneous GERD (genetic) architecture.
Obesity and depression are known GERD risk factors; here, we first show that they can be combined to identify more loci for a broadly defined GERD phenotype, where we greatly expanded the number of GERD risk loci over and above previous GWAS findings12 through a multitrait model. More than two-thirds of the MTAG GERD loci replicated in 23andMe suggest that despite heterogeneous phenotyping being used, our findings represent genuine reflux loci. These results are also in good accord with our previous work showing high genetic concordance between these self-reported and clinical phenotypes. Second, we show that among the genome-wide significant GERD loci, a subgroup acts predominantly via effects on obesity while another acts via effects on depression. This is broadly consistent with previous observations that endoscopic findings18 in many (38%) patients with typical GERD symptoms are normal; in such cases, psychological factors may drive symptom reporting.19–23 We further showed that genes involved in the obesity-driven GERD subgroup were differentially expressed in oesophageal and adipose tissues—which was not evident from previous analyses evaluating GERD as a single, homogeneous disease.12 15
It was previously shown that psychosomatic factors are linked with functional oesophageal disorders through the gut-brain axis, which may alter a person’s emotional status, perception of pain and influence the self-reporting of GERD symptoms and severity.24 25 Previous studies have shown that among the broad class of individuals affected by GERD, those with functional oesophageal disorders typically have normal oesophageal acid exposure26, and this may lead to them having lower risk of downstream BE/EA compared with other patients with GERD. Despite many studies showing strong association between depression with GERD (notably, the nonerosive reflux disease subtype),27 studies evaluating psychosomatic factors and BE/EA susceptibility had been more limited,28 29 likely due to sample size constraints. While there have been no large-scale observational studies to date to clarify any link between depression and BE, the previously documented weak correlation30 between GERD symptom scores (which correlates strongly with presence of a functional oesophageal disorder) and severity of esophagitis, would imply that psychosomatic factors are unlikely to drive progression towards BE. Here, our results are in keeping with this as they show that the depression-driven GERD loci, which may predispose a person towards a functional oesophageal disorder rather than a disorder with abnormal oesophageal acid exposure, have no effect on BE/EA risk. In contrast, we show that GERD risk loci acting via the obesity-driven pathway do have an effect on BE/EA risk (figure 6).
PheWAS results reveal that these novel loci are enriched with anthropometric traits and cardiovascular-related risk factors (online supplemental figure 9), perhaps as a result of a pleiotropic effect on obesity and cardiovascular disease. Given our results showing very weak association between depression-driven GERD and BE/EA, we did not expect to see pleiotropy between the BE-associated SNPs and depression; while this was broadly true, one of the novel BE loci (rs2861695) showed moderate evidence of association with depression (p<6.7e-4).31 Moreover, dropping proxies of socioeconomic status (EDU) and depression (MDD) from the model did not change our GWAS findings for BE (online supplemental table ST5). While our analyses showed a potential shared pathway between the obesity-driven GERD loci and BE, due to limited power, very few loci achieved genome-wide significance (ie, p<5e-8) across both traits. However, most of the BE loci did show suggestive evidence (ie, p<1e-5) of an association with GERD (online supplemental table ST18).
Two of the novel MTAG GERD loci, rs9636202 (nearest gene PGPEP1) and rs7206608 (nearest gene CDH13), were previously shown to be associated with periodontitis.32 33 Apart from actual pH-monitoring, periodontitis is also reported as one of the risk factors that are more commonly observed among cases with erosive GERD.34 35 However, whether the potential role of PGPEP1 and CDH13 on reflux esophagitis and poor oral health represents a common effect on (1) dietary behaviour or (2) changes in adiposity (resulting in genetic associations with BMI) remains unclear. Our gene-based PheWAS identified substantial overlap of GERD-associated genes with those involved in sarcoidosis, consistent with previous findings estimating one-third of patients with sarcoidosis being diagnosed with GERD-related symptoms and irritable bowel syndrome.36 Although fine-mapping is required to unambiguously link SNPs to genes, genes associated with several of the loci identified here (CRTC1, CDK2, PDE4B, DPYD, PDE1C) are targeted by drugs that are currently on trial for oesophageal and digestive system cancers.12 Despite the fact that we have not undertaken the substantial task of unambiguously fine-mapping each associated GERD SNP to the relevant gene(s), many of the genes we identify here may be promising drug targets for further research.
Our observation of a greater magnitude of association between obesity-driven GERD loci and BE/EA is not surprising, given prior evidence37 showing that genetically predicted obesity was associated with increased risk of BE and EA. To evaluate whether obesity is a complete mediator between GERD and BE, we examined the genetic effect of obesity-driven GERD on BE adjusting for BMI and observed only partial attenuation (IVW-log(OR) from 0.726 (p=2.23e-8) to 0.513 (p=0.001)) of the GERD effect on BE (online supplemental table ST17). This implies that the relationship between GERD and BE cannot be solely explained by a common direct effect of obesity. Formal Mendelian randomisation (MR) analyses have been attempted previously38; however, interpreting the results from such studies is difficult given we have shown that there are at least two pathways leading to GERD (one acting via obesity associated SNPs, another acting via depression SNPs).
This study has several limitations. First, a proportion of UKB GERD cases was determined through use of heartburn-related medication12; however, as noted in our previous study, the genetic correlation between GERD inferred through medication, self-report and clinical diagnosis was very high. Similarly, our validation cohort (23andMe) adopted a broad GERD definition and diagnosis of BE were self-reported as opposed to being histologically verified. Overall, our approach of using a large GWAS sample size with a broad phenotype was much more effective in identifying novel loci than previous smaller studies using more well-defined phenotypes.10 11 Our heuristic for making the GERD obesity versus depression-driven subgroup classifications is limited by the accuracy of GWAS data, focused on only 88 SNPs, and, for ease of implementation, we used the BMI and depression GWAS results to group SNPs. Furthermore, while the combined effect of the obesity-driven GERD genome-wide significant loci (assembled in a genetic risk score) was robustly associated with BE/EA risk, the predictions from this genetic risk score lack precision to reliably predict BE/EA in clinical settings. Finally, some SNPs may have pleiotropic effects on both obesity and on psychiatric traits or could simply reflect other pleiotropic pathways not mediated by these factors (eg, mucosal tight junctions, inflammation and repair, oesophageal and gastric motility). Modelling these risk factors which are independent of the obesity and depression axis in our multitrait model could conceivably increase power to detect additional loci for both GERD and BE. GWAS studies on these additional traits are currently limited in size but investigating this will be worthwhile in future work.
In conclusion, using a multitrait framework, we greatly expanded the number of genome-wide significant genetic loci for GERD and also increased the number of BE loci by seven. Here, we present strong evidence for a genetic underpinning of disease heterogeneity in GERD, where we showed that GERD loci associated with depressive symptoms are not strong predictors of BE/EA relative to obesity-driven GERD loci.
Data availability statement
Data are available in a public, open access repository. Data are available upon reasonable request. All data relevant to the study are included in the article or uploaded as supplementary information. The MTAG GWAS summary statistics on GERD (study accession GCST90000514) and BE (GCST90000515) can be obtained from the GWAS catalog (ebi.ac.uk). Sources for the individual GWAS summary statistics used in the multi-trait model are listed in Supplementary Information. GWAS summary statistics for the 23andMe samples are available via direct request to 23andMe (dataset-request@23andMe.com; a data transfer agreement is required). The raw genetic and phenotypic UK Biobank data can be obtained via direct application to the UK Biobank (http://www.ukbiobank.ac.uk/).
Ethics statements
Patient consent for publication
Ethics approval
This study primarily uses GWAS summary data and does not involve the use of human test subjects. This research was approved by the QIMR Berghofer's Human Research Ethics Committee under project ID 3501. The UK Biobank cohort study is approved by the NHS National Research Ethics Service North West (11/NW/0382). Informed consent from all 23andMe research participants was obtained under a research protocol that was approved by the AAHRPP-accredited institutional review board, Ethical and Independent Review Services, USA. For the BE/EA GWAS, informed consent was obtained in the four studies (BEACON, Bonn, Cambridge and Oxford study) from all participants and ethics approval was obtained from the ethics boards of every participating institution.
Supplementary materials
Supplementary Data
This web only file has been produced by the BMJ Publishing Group from an electronic file supplied by the author(s) and has not been edited for content.
Supplementary Data
This web only file has been produced by the BMJ Publishing Group from an electronic file supplied by the author(s) and has not been edited for content.
Footnotes
Correction notice This article has been corrected since it published Online First. An author's name has been updated and figure 4 replaced.
Collaborators EA/BE datasets: (BEACON, Cambridge, Oxford (UK), Bonn) Rebecca Fitzgerald, Matt Buas, Marilie D Gammon, Douglas A Corley, Nicholas J Shaheen, Laura J Hardie, Nigel C Bird, Brian J Reid, Wong-Ho Chow, Harvey A Risch, Weimin Ye, Geoffrey Liu, Yvonne Romero, Leslie Bernstein, Anna H Wu, Johannes Schumacher, Ines Gockel, Anne Bohmer, Janusz Jankowski, Claire Palles, David C Whiteman. 23andMe Research Team: Michelle Agee, Stella Aslibekyan, Adam Auton, Robert K Bell, Katarzyna Bryc, Sarah K Clark, Sarah L Elson, Kipper Fletez-Brant, Pierre Fontanillas, Nicholas A Furlotte, Pooja M Gandhi, Karl Heilbron, Barry Hicks, David A Hinds, Karen E Huber, Ethan M Jewett, Yunxuan Jiang, Aaron Kleinman, Keng-Han Lin, Nadia K Litterman, Marie K Luff, Jennifer C McCreight, Matthew H McIntyre, Kimberly F McManus, Joanna L Mountain, Sahar V Mozaffari, Priyanka Nandakumar, Elizabeth S Noblin, Carrie A M Northover, Jared O'Connell, Aaron A Petrakovitz, Steven J Pitts, G. David Poznik, J Fah Sathirapongsasuti, Anjali J Shastri, Janie F Shelton, Suyash Shringarpure, Chao Tian, Joyce Y Tung, Robert J Tunney, Vladimir Vacic, Xin Wang, Amir S Zare.
Contributors SM has full access to all of the data in the study and takes responsibility for the integrity of the data and the accuracy of the data analysis. Study concept and design: J-SO, JA, PG, BJK, SM. Statistical analysis and interpretation of data: J-SO, JA, XH, MHL, PN, PG, BJK, SM. Acquisition of data and obtained funding: J-SO, IG, AB, JJ, CP, CMO, REN, RF, APT, TLV, MB, DAH, SM. Data preparation: JSO, JA, XH, PG, SM. Drafting of the manuscript: J-SO, XH, MHL, PG, BJK, SM. Critical review of the manuscript for important intellectual content: J-SO, JA, JJ, CP, CMO, REN, RF, APT, MB, DAH, PG, BJK, SM. Study supervision: SM. All authors read and approved the final version for submission.
Funding This work was primarily conducted using the UK Biobank Resource (application number 25331). This work was supported by funding from the US National Cancer Institute at the National Institutes of Health (grant number R01CA136725 awarded to BEACON authors TLV and DCW). SM and REN are supported by National Health and Medical Research Council (NHMRC) Fellowships. PG is supported by a NHMRC Investigator Grant (#1173390). XH is supported by the University of Queensland Research Training Scholarship and QIMR Berghofer PhD Top Up Scholarship. SM acknowledges funding from NHMRC grant 1123248. The QSkin study is supported by the Australian NHMRC grant APP1063061. The Swedish Esophageal Cancer Study was funded by grants (R01CA57947-03) from the National Cancer Institute, and the Swedish Cancer Society (4559-B01-01XAA and 4758-B02-01XAB). The Kaiser Permanente Study was supported by US NIH grants R01DK63616 and R01CA59636) and from the California Tobacco Related Research Program (3RT-0122 and 10RT-0251). The MD Anderson controls were drawn from dbGaP (study accession: phs000187.v1.p1) following approval. Genotyping of these controls (C. Amos, PI) were performed through the University of Texas MD Anderson Cancer Center (UTMDACC) and the Center for Inherited Disease Research (CIDR), supported in part by NIH grants R01CA100264, P30CA016672; and; R01CA133996, the UTMDACC NIH SPORE in Melanoma 2P50CA093459, as well as by the Marit Peterson Fund for Melanoma Research. CIDR is supported by contract HHSN268200782096C. Cancer controls from the Genome-Wide Association Study of Parkinson Disease were obtained from dbGaP (study accession: phs000196.v2.p1). This work, in part, used data from the National Institute of Neurological Disorders and Stroke (NINDS) dbGaP database from the CIDR: NeuroGenetics Research Consortium Parkinson's disease study. We acknowledge the principal investigators and co-investigators of this study: Haydeh Payami, John Nutt, Cyrus Zabetian, Stewart Factor, Eric Molho, and Donald Higgins. Cancer controls from the Chronic Renal Insufficiency Cohort (CRIC) were drawn from dbGaP (study accession: phs000524.v1.p1). The CRIC study was done by the CRIC investigators and supported by the National Institute of Diabetes and Digestive and Kidney Diseases (NIDDK). Data and samples from CRIC reported here were supplied by NIDDK Central Repositories. This report was not prepared in collaboration with investigators of the CRIC study and does not necessarily reflect the opinions or views of the CRIC study, the NIDDK Central Repositories, or the NIDDK. We acknowledge the principal investigators and the project officer of this study: Harold I Feldman, Raymond R Townsend, Lawrence J Appel, Mahboob Rahman, Akinlolu Ojo, James P Lash, Jiang He, Alan S Go, and John W Kusek. The UK Biobank was established by the Wellcome Trust medical charity, Medical Research Council (UK), Department of Health (UK), Scottish Government, and the Northwest Regional Development Agency. It also had funding from the Welsh Assembly Government, British Heart Foundation, and Diabetes UK. We thank Scott Wood, John Pearson, Scott Gordon from the QIMR Berghofer Medical Research Institute for technical support. We thank the participants and research staff from the UK Biobank. We finally also thank the 23andMe staff members and 23andMe research participants for generating the replication data in this publication.
Competing interests Authors listed in the 23andMe Research Team are employees for the company 23andMe Co.
Provenance and peer review Not commissioned; externally peer reviewed.
Supplemental material This content has been supplied by the author(s). It has not been vetted by BMJ Publishing Group Limited (BMJ) and may not have been peer-reviewed. Any opinions or recommendations discussed are solely those of the author(s) and are not endorsed by BMJ. BMJ disclaims all liability and responsibility arising from any reliance placed on the content. Where the content includes any translated material, BMJ does not warrant the accuracy and reliability of the translations (including but not limited to local regulations, clinical guidelines, terminology, drug names and drug dosages), and is not responsible for any error and/or omissions arising from translation and adaptation or otherwise.