Article Text

Abstract
Objectives Epigenomic alterations in cancer interact with the immune microenvironment to dictate tumour evolution and therapeutic response. We aimed to study the regulation of the tumour immune microenvironment through epigenetic alternate promoter use in gastric cancer and to expand our findings to other gastrointestinal tumours.
Design Alternate promoter burden (APB) was quantified using a novel bioinformatic algorithm (proActiv) to infer promoter activity from short-read RNA sequencing and samples categorised into APBhigh, APBint and APBlow. Single-cell RNA sequencing was performed to analyse the intratumour immune microenvironment. A humanised mouse cancer in vivo model was used to explore dynamic temporal interactions between tumour kinetics, alternate promoter usage and the human immune system. Multiple cohorts of gastrointestinal tumours treated with immunotherapy were assessed for correlation between APB and treatment outcomes.
Results APBhigh gastric cancer tumours expressed decreased levels of T-cell cytolytic activity and exhibited signatures of immune depletion. Single-cell RNAsequencing analysis confirmed distinct immunological populations and lower T-cell proportions in APBhigh tumours. Functional in vivo studies using ‘humanised mice’ harbouring an active human immune system revealed distinct temporal relationships between APB and tumour growth, with APBhigh tumours having almost no human T-cell infiltration. Analysis of immunotherapy-treated patients with GI cancer confirmed resistance of APBhigh tumours to immune checkpoint inhibition. APBhigh gastric cancer exhibited significantly poorer progression-free survival compared with APBlow (median 55 days vs 121 days, HR 0.40, 95% CI 0.18 to 0.93, p=0.032).
Conclusion These findings demonstrate an association between alternate promoter use and the tumour microenvironment, leading to immune evasion and immunotherapy resistance.
- gastric cancer
- hepatocellular carcinoma
- immunotherapy
Data availability statement
Data used in this manuscript includes previously published studies with genomic data files from public repositories: European Nucleotide Archive: PRJEB25780 and PRJEB34724 The Cancer Genome Atlas Research Network: dbGaP: phs000178.v10.p8 Data used in this manuscript includes previously published studies with genomic data files from public repositories:European Nucleotide Archive: PRJEB25780 and PRJEB34724The Cancer Genome Atlas Research Network: dbGaP: phs000178.v10.p8NanoString data file is provided as a Supplementary Table (attached) https://www.ebi.ac.uk/ena/data/view/PRJEB25780; https://www.ebi.ac.uk/ena/data/view/PRJEB34724https://www-ncbi-nlm-nih-gov.libproxy1.nus.edu.sg/projects/gap/cgi-bin/study.cgi?study_id=phs000178.v10.p8.
This is an open access article distributed in accordance with the Creative Commons Attribution Non Commercial (CC BY-NC 4.0) license, which permits others to distribute, remix, adapt, build upon this work non-commercially, and license their derivative works on different terms, provided the original work is properly cited, appropriate credit is given, any changes made indicated, and the use is non-commercial. See: http://creativecommons.org/licenses/by-nc/4.0/.
Statistics from Altmetric.com
Significance of this study
What is already known on this subject?
Immune escape is a key factor for tumourigenesis.
Epigenetic alterations in cancer interact with the immune microenvironment to control tumourigenesis and response to therapy.
Studies in gastric cancer have shown an association between epigenetic alternate promoters, immune-editing and immune checkpoint inhibitor (ICI) resistance.
What are the new findings?
Gastric tumours with higher epigenetic promoter alterations exhibited decreased levels of T-cell cytolytic markers and expressed signatures of immune depletion.
These findings were orthogonally validated using novel technologies and platforms such as single-cell RNA sequencing and ‘humanised mice’.
Multiple gastrointestinal tumour types with higher alternate promoter burden also correlated significantly with poorer survival with ICI therapy.
How might it impact on clinical practice in the foreseeable future?
Alternative promoter use burden may represent a negative predictive biomarker for immunotherapy applicable to multiple gastrointestinal tumour types.
Introduction
Tumour growth and metastases in the presence of robust host immunosurveillance is a hallmark of cancer. Immune-editing is a process harnessed by tumour cells to evade immune recognition using mechanisms such as modifications in antigen presentation, dysregulation of immune checkpoints and immune-resistant clonal selection.1–3 Previous studies have suggested that tumours may enhance immune-editing by co-opting epigenetic mechanisms such as DNA methylation, histone acetylation and chromatin modification to regulate T-cell reprogramming, neoantigen production and immune gene expression.4–7 Notably, as epigenetic changes are potentially reversible, these represent potential nodes for anticancer therapeutic targets.8
We have previously described a novel mechanism of immune-editing in gastric cancer (or stomach adenocarcinoma (STAD)) using alternate promoters.9 10 Promoters are cis-regulatory elements upstream of transcription start sites, and more than half of all human genes have multiple promoters.11 Promoter activity is epigenetically regulated and use of alternate promoters can produce distinct 5′ untranslated regions and first exons, enhancing mRNA and protein isoform diversity.12 Using epigenomic profiling, we demonstrated that a significant proportion of STADs can employ alternate promoters at highly expressed genes, generating 5′ truncated protein isoforms missing immunogenic N-terminal peptides. STADs with high levels of alternate promoter use were found to have an immunologically quiet phenotype and possible resistance to immune checkpoint inhibitor (ICI) therapy.9 10
In this study, we sought to study associations between alternate promoter use and the tumour immune microenvironment in gastric cancer, including temporal effects on tumour growth using a novel animal model. We expand our findings in gastric cancer to other gastrointestinal (GI) tumours by mining public datasets and using multiple immunotherapy-treated cohorts.
Methods
Alternate promoter burden (APB) algorithm
APB was computed with a formula incorporating proActiv, an algorithm that estimates promoter activity from short-read RNA sequencing (RNA-Seq) data by mapping and quantifying first intron junctions of the genome. proActiv has been previously described and is available as an R package (online supplemental methods).13 Samples were classified into groups: those in the top quartile of APB were classified as APBhigh; those in the lowest quartile were classified as APBlow; and the rest of the samples were classified as APBint (figure 1A). APB levels were normalised across batches/cohorts prior to categorising into groups.
Supplemental material

Development of RNA-Seq-based algorithm to measure alternate promoter use. (A) Epigenetic chromatin immunoprecipitation sequencing (ChIPSeq) study in gastric cancer identified specific gain-of-expression (‘gain promoters’) and loss-of-expression (‘loss promoters’) genomic regions which were associated with immune-editing in gastric cancer. In total, approximately 2000 alternate promoter genomic regions were identified. proActiv algorithm is employed to infer promoter activity from short-read bulk RNA-Seq data. proActiv infers promoter activity by quantifying first intron junctions of RNA-Seq transcripts. Genomic regions identified from ChIPSeq data are combined with proActiv to quantify APB. Samples within each cohort were classified into groups based on APB: APBhigh, APBint and APBlow. (B) Association of APB groups in STAD with established markers of T-cell cytolytic activity (CD8A, GZMA and PRF1). APBhigh group is denoted in red, APBint in yellow and APBlow in blue. APBhigh group shows lower expression of these three genes compared with APBint, which in turn shows a lower expression to the APBlow group (Wilcoxon test; ***p<0.001, **p<0.01, *p<0.05; n.s.). (C) Distribution of STAD TCGA subtypes by the APB group. STAD TCGA molecular subtypes: CIN, GS, EBV associated and MSI. (D) Association of APB groups in STAD with nine selected immune checkpoints. Similar to markers of T-cell activity, expression of these nine checkpoints is consistently lower in APBhigh (red) compared with APBint (yellow) and APBlow (blue). (Wilcoxon test; ***p<0.001, **p<0.01, *p<0.05; n.s.). APB, alternate promoter burden; CIN, chromosomal unstable; EBV, Epstein-Barr virus associated; GS, genome stable; MSI, microsatellite instability; n.s., not significant; STAD; stomach adenocarcinoma; TCGA, The Cancer Genome Atlas.
Single-cell RNA-Seq of gastric cancer
Sample cohort description
Patients diagnosed with gastric adenocarcinoma and undergoing surgical resection at the National University Hospital, Singapore, were enrolled after obtaining written informed consent.
Single-cell RNA sequencing (scRNA-Seq) library preparation
Enriched 5′ gene expression libraries were constructed by generating gel beads in emulsion from single cells dissociated from tumour samples. Barcoded 10×, full-length cDNA was amplified via PCR, generating sufficient material to construct multiple libraries from the same cells. Libraries were subsequently sequenced on an Illumina Hiseq sequencer (online supplemental methods).
Single-cell gene expression quantification and determination of the major cell types
Unique molecular identified count matrices were first generated for each sample by passing the raw data in the cell ranger software. The count matrix was later used to generate a Seurat object which was used for clustering analysis.14 15 Marker genes were compared for each cluster to literature-based markers of cell lineages to assign a cell lineage per cluster. Cell clusters were labelled based on curated and described cell markers.16
Humanised mouse model
All experiments and procedures were approved by the Institutional Animal Care and Use Committee (IACUC, IACUC# 191440) of A*STAR in accordance with guidelines of Agri-Food and Veterinary Authority and the National Advisory Committee for Laboratory Animal Research of Singapore.
Generation of humanised mice
One to three-day-old NOD-scid Il2rγnull (NSG) pups were sublethally irradiated at 1 Gy and engrafted with 1×10⁵ human CD34+ cord blood cells (HLA-A24:02, Stemcell Technologies) via intrahepatic injection. Mice with more than 10% human immune cell reconstitution (calculated based on the proportion of human CD45 relative to the sum of human and mouse CD45) were included in the study. In total, five cell lines of HLA-A24:02 subtype were selected for the experiment (two APBhigh (SNU1750 and GSU), one APBint (YCC21) and two APBlow (NCC 59 and SNU16) cell lines).
For each cell-line, five humanised mice and five NSG mice were injected with the tumour cells and observed for 1 month. Mice were sacrificed at the end of 1 month; necropsies was performed; and tumours were harvested for further analysis (online supplemental methods).
Immunotherapy-treated clinical cohorts
In a multicentre, industry-academic collaborative effort, a cohort of immunotherapy-treated GI cancer samples was collected to assess APB levels. A majority of the samples were from various ICI clinical trials conducted by the respective groups. The contributing site, tumour type, ICI treatment and type of transcriptomic analysis performed (RNA-Seq vs NanoString) are listed in online supplemental table S1. All patients were treated with ICIs in the metastatic, palliative intent setting.
Supplemental material
Pan-cancer The Cancer Genome Atlas (TCGA) analysis
Gene expression data and clinical data from the PanCanAtlas were downloaded from Firebrowse.17 Illumina HiSeq RNA-SeqV2 RSEM normalised gene values were used for correlations of CD8A, GZMA and PRF1 and other immune correlates. All tumour types within the database were included except for tumours of haematological or immune origin (online supplemental methods).
Statistical analysis
Qualitative data in proportions were compared used Fisher’s exact test. Two-sample t-test was used to compare parametric quantitative data. Wilcoxon rank-sum test was used to compare non-parametric quantitative data. Spearman’s correlation was used for non-parametric bivariate quantitative comparisons. Kaplan-Meier curves and log-rank test were used for survival analysis. HRs and 95% CIs were evaluated using the Cox proportional hazards regression model. All analyses were done using R V.4.0.5.
Results
RNA-Seq-based prediction of alternate promoter use enables pan-cancer analysis
H3K4me3 ChIP-Seq or Cap Analysis of Gene Expression tag sequencing are gold-standard techniques for detecting promoter activity.18 However, data using these methods are typically available only for small tumour cohorts, and not for large datasets or clinical trial populations. To overcome these limitations, we harnessed proActiv, a previously described bioinformatic algorithm to infer promoter activity from short-read RNA-Seq data.13 19 We employed proActiv to estimate tumour-associated promoter changes using a predefined set of alternate promoters corresponding to epigenomic regions gained or lost in primary STADs relative to matched normal gastric tissues, determined by previous H3K4me3 ChIP-seq.9 Dysregulated alternate promoters identified by proActiv were quantified, generating for each tumour a sample-specific ‘APB’ score (APB) (figure 1A).
First, we computed APB for 416 STAD samples from TCGA. The STAD samples were categorised as APBhigh: n=103 (25%), APBint: n=210 (50%) and APBlow: n=103 (25%). APBhigh tumours exhibited decreased expression of the T-cell cytolytic markers CD8A (CD8+ tumour-infiltrating lymphocytes (TILs)), GZMA (granzyme A) and PRF1 (perforin 1) (APBhigh vs APBlow, Wilcoxon test, p<0.001; figure 1B).20 As a negative control, correlations to CD8A, GZMA and PRF1 expression were not observed when APB was calculated using randomly selected promoter subsets of similar size (empirical p<0.01). These results are similar to previous observations in STAD, supporting the use of proActiv to infer promoter activity from RNA-Seq data.9 13
To investigate relationships between APB and the four TCGA STAD molecular subtypes: chromosomal unstable (CIN), genome stable (GS), Epstein-Barr virus associated (EBV) and microsatellite instability (MSI), we analysed 376 STADs where TCGA subtype classification was available. MSI and EBV subtypes were found to have few/no APBhigh tumours (4% and 0%, respectively), while CIN and GS subtypes had significantly higher proportions of APBhigh tumours compared with APBlow tumours (29% vs 17%, p<0.0001, and 38% vs 16%, p=0.012, respectively) (figure 1C). There were no significant differences between APB groups when categorised by Lauren’s histological subtype (ie, diffuse vs intestinal) (online supplemental figure S1A). The APB groups were also correlated with nine immune checkpoint genes of therapeutic relevance (PD-1, PD-L1, PD-L2, CTLA4, LAG3, TIM3, ICOS, BTLA and TIGIT). All immune checkpoint genes displayed lower expression in APBhigh tumours compared with APBlow (p≤0.01 for all nine genes) (figure 1D). After excluding MSI tumours, there was no difference in tumour mutation burden (TMB) between APBlow and APBhigh tumours (3.6 vs 3.0 muts/Mb, p=0.12) (online supplemental figure S1B).
Supplemental material
To study the effect of tumour–stroma composition, we correlated APB with tumour purity obtained from a consensus estimation method.21 We found only a weak positive correlation between tumour content and APB (Pearson r=0.09, p=0.062) (online supplemental figure S1C). These findings suggest that the estimation of alternate promoter use by the tumours is not merely driven by the fraction of cancer cells within a tumour sample. Next, we correlated the relative proportions of major immune cell types (from CIBERSORT) of the TCGA STAD samples.22 Consistent with previous analysis, APBlow tumours had higher T-cell abundance (CD4 (p=0.0068), CD8 (p=0.011) and T follicular helper cells (p=0.033)), and macrophage M1 abundance (p=0.039). In contrast, APBhigh had higher abundance of mast cells (p=0.0079) (online supplemental figure S1D–H), suggesting a possible role of innate immunity in APBhigh tumours. We also correlated APB with intratumour heterogeneity scores calculated by ABSOLUTE.22 APBhigh tumours appeared to have higher intratumour heterogeneity than the APBlow tumours (p=0.022) (online supplemental figure S1I).
scRNA-Seq confirms distinct immunological populations in APBhigh and APBlow tumours
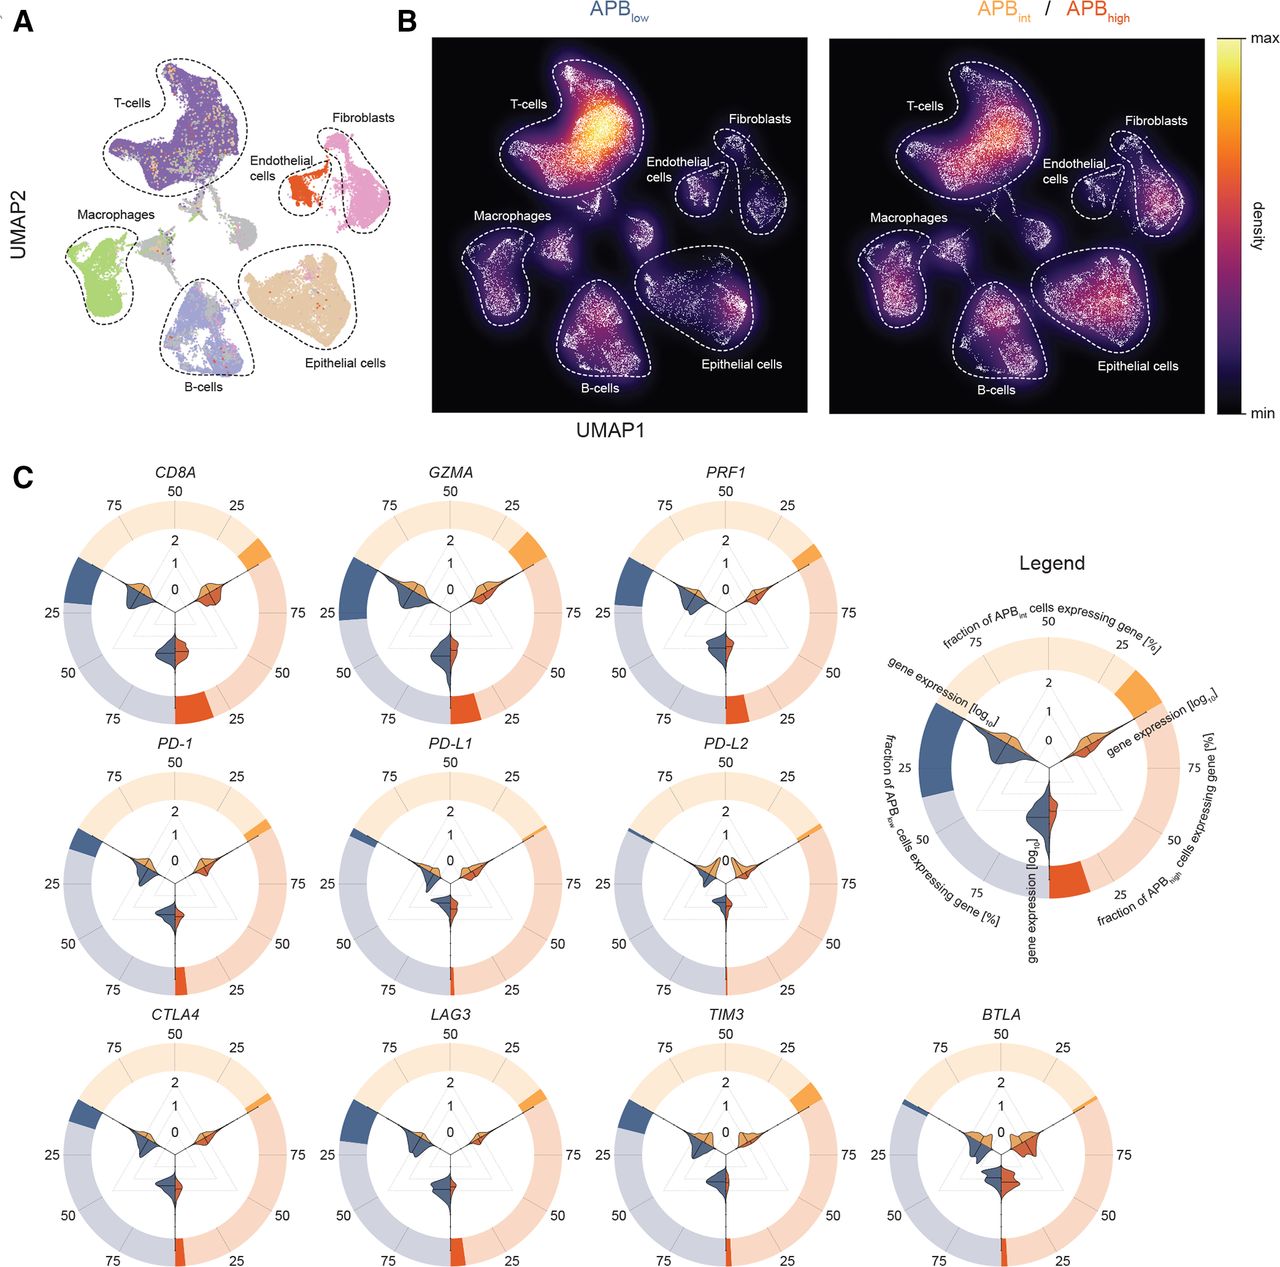
To further investigate if APBhigh tumours have distinct or reduced tumorous immune-cell infiltrates compared with APBlow tumours, we performed scRNA-Seq.We generated paired bulk RNA-Seq and scRNA-Seq data (55 071 cells) on 11 surgically resected primary STAD samples (APB can be derived only from bulk RNA-Seq as measurements of RNA at isoform-specific levels are below the limits of detection of current scRNA-Seq technology), classifying 3 samples as APBlow (19 920 cells), 5 as APBint (18 335 cells) and 3 as APBhigh (16 816 cells) (online supplemental table S2). To identify cellular populations, unsupervised cell clustering based on gene expression profiles was performed, allowing for dimensionality reduction to six major cell types: T cells, epithelial cells, B cells, macrophages, endothelial cells and fibroblasts (figure 2A).

Single-cell RNA-Seq of gastric cancer and association with APB with the tumour microenvironment. (A) UMap of 55 071 gastric cancer cells from 11 samples (3 APBhigh, 5 APBint, 3 APBlow) to visualise cell types and clusters. Unsupervised hierarchical clustering was performed to generate clusters, which were then mapped and labelled based on expression of known marker genes. Major cell types include epithelial cells (brown), T cells (deep purple), B cells (light purple), endothelial cells (red), fibroblasts (pink) and macrophages (green). (B) Density plot of UMap in (A) stratified by APBlow versus APBint/APBhigh highlighting the higher proportion of T cells in the APBlow tumours and epithelial cells in APBint/APBhigh tumours. (C) Circle–violin plots of expression of CD8A, GZMA and PRF1 and immune checkpoints by the APB group in scRNA-Seq. The outer circle demonstrates the proportion of cells within the APB group which express the gene. For example, ~25% of cells in APBlow tumours (blue) express CD8A, while less than 25% of cells in APBhigh (red) and APBint (yellow) tumours express this gene. The violin plots within depict the magnitude of expression by the APB group. Three comparisons are made: APBlow(blue) versus ABPint (yellow); APBint versus APBhigh(red) and APBlow versus APBhigh. From the violin plots, it is evident that the cells that do express the genes within each APB group are similar, yet, much fewer of these cells exist in APBint and APBhigh tumours compared with APBlow. These results suggest that while CD8A-positive cells are present in APBhigh and APBint tumours, much lower levels of GZMA and PRF1 are expressed by these cells. APB, alternate promoter use burden; scRNA-Seq, single-cell RNA sequencing.
Expressions of CD8A, GZMA, PRF1 and immune checkpoint genes were studied within the specific cellular populations. CD8A, GZMA and PRF1 were expressed almost exclusively within T cells (~40% to 55% of T cells) validating the expression of CD8A, GZMA and PRF1 in bulk RNA-Seq as appropriate surrogates for T-cell cytolytic activity (online supplemental figure 2A). Similarly, immune checkpoints traditionally described as expressed on T cells such as PD-1, LAG3, TIGIT, TIM3, CTLA4 and ICOS had significantly higher single-cell transcript expression in T cells (online supplemental figure S2A). We compared cellular proportions between the APB groups (online supplemental figure S2B). Overall, T-cell proportions were higher in APBlow tumours compared with APBint/APBhigh tumours (42% vs 30%, p<0.0001) (figure 2B). In contrast, epithelial cell proportions were lower in APBlow tumours (13% vs 21%, p<0.0001). Notably, there were no significant differences in B-cell composition between the groups (14% vs 14%, p=0.82) (online supplemental table S3). APBlow tumours had significantly higher expression of CD8A, GZMA and PRF1 within T cells compared with APBhigh tumours (Wilcoxon p<0.0001), supporting the bulk RNA-Seq analysis. Immune checkpoints also had significantly higher expression in APBlow tumours compared with APBhigh tumours (Wilcoxon p<0.0001) (figure 2C and online supplemental figure S2C), similar to bulk RNA-Seq data. Taken collectively, these results highlight distinct tumour immune microenvironments and regulation of immune checkpoints between tumours with high and low alternate promoter uses.
Interaction between alternate promoter use and the immune system in a humanised-mouse model
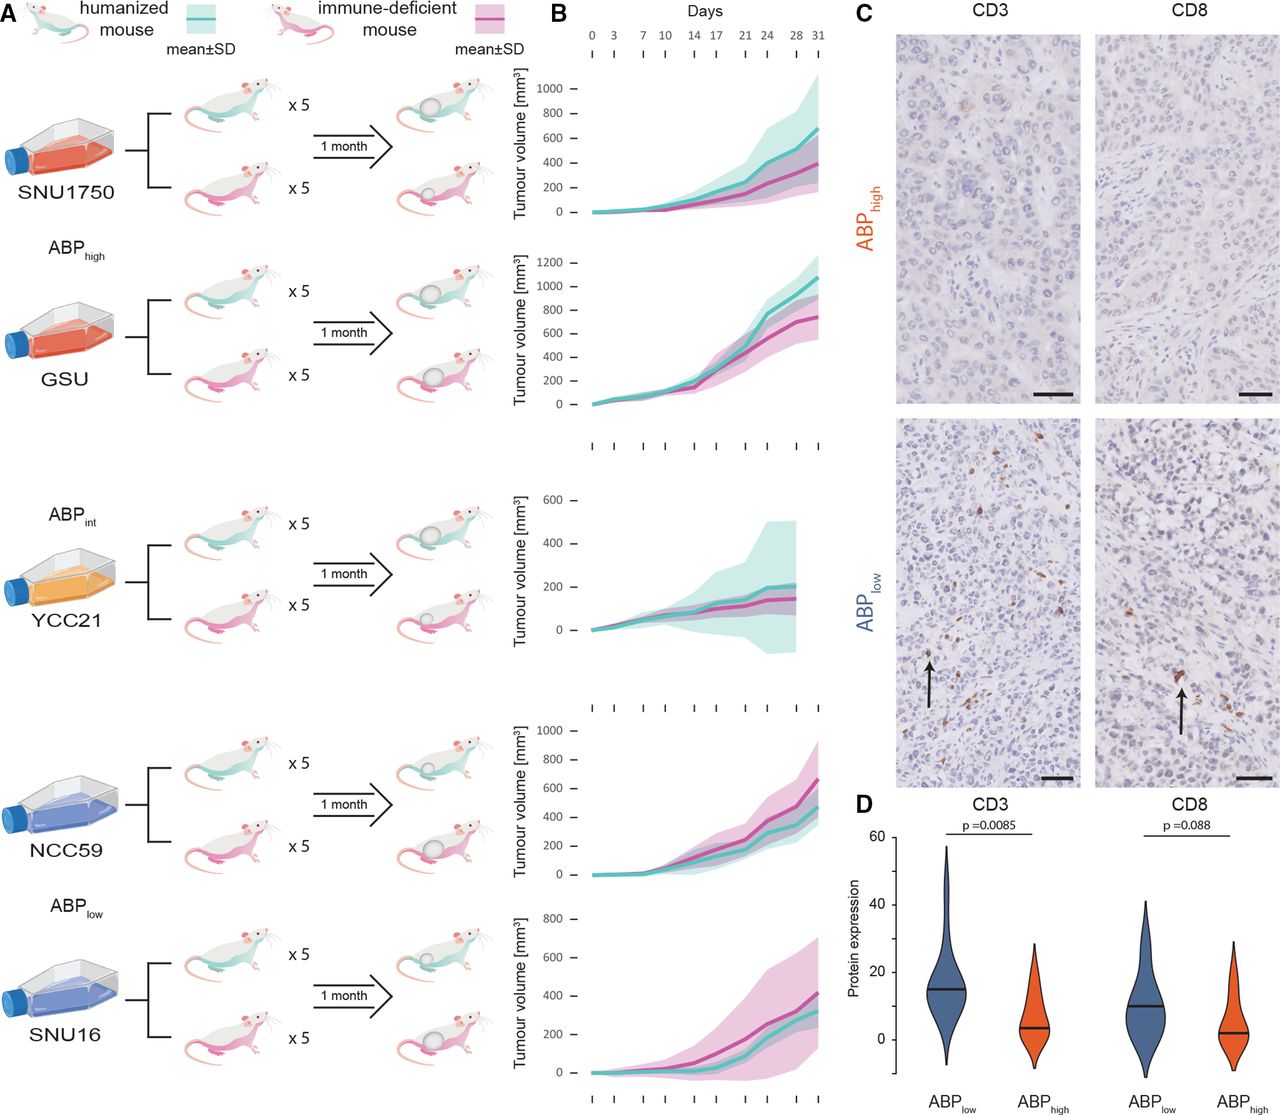
Analysis of primary tumours often represents only a single temporal snapshot of the tumour, obtained at the time of surgical resection or biopsy. To explore dynamic temporal interactions between tumour kinetics, alternate promoter usage and the human immune system, we used a humanised-mouse cancer in vivo model. NOD-scid Il2rγnull (NSG) immune-deficient mice pups were engrafted with HLA-A24:02 human umbilical cord blood CD34+ cells, and mice with postengraftment human immune-cell reconstitution (termed ‘humanised mice’) were selected for the study. Five HLA-A24:02 subtype STAD cell lines (two APBhigh, one APBint and two APBlow cell lines) were selected (online supplemental table S4). These cell lines were either commercially available or acquired from academic collaborators.23–25 For each STAD cell line, five humanised mice and five NSG immune-deficient mice were injected subcutaneously in the flank with tumour cells. The resulting tumours were analysed for growth rate, tumour size, mass, volume and histopathological analysis (figure 3A).

Humanised-mice model study of APB. (A) Study schema of humanised-mouse model experiment. Five cell lines were used (two APBhigh, one APBint and two APBlow cell lines each). For each cell line, five humanised mice and five immune-deficient NSG mice were injected subcutaneously in the flank with the tumour cells and observed for 1 month. Mice were sacrificed at the end of 1 month, necropsies performed and tumours harvested for analysis. (B) Tumour growth in humanised mice versus NSG mice by APB group. Cyan lines are humanised mice; magenta lines are NSG mice. APBhigh and APBint tumours have faster growth in humanised mice compared with NSG mice, while in APBlow tumours, humanised mice have slower growth compared with NSG mice. (C) Histology of tumours harvested from humanised mice with tumour growth. CD3 and CD8 immunohistochemistry staining imaging shows heavy TILs in SNU16 (APBlow) (black arrows) and no infiltration in SNU1750 (APBhigh). APBhigh tumours had significantly lower levels of CD3+ and CD8+ T-cell infiltration into the tumour. Black bar magnification 50 µm. (D) Expression of CD3 and CD8 by immunohistochemistry scoring in humanised-mouse tumours by the APB group. Immunohistochemical and H&E staining was performed on the FFPE tissue with antibodies targeting CD3 and CD8. The percentage of cells displaying unequivocal staining of any intensity for CD3 or CD8 were determined by a pathologist blinded to clinicopathological and survival information. TILs expressing CD3 or CD8 were identified within the intratumoral area defined as lymphocytes within cancer cell nests and in direct contact with tumour cells. Quantification of TILs was determined by the percentage of the intratumoral areas occupied by the respective TIL population. Violin plots highlight the expression of CD3 and CD8 within these cells by the APB group (APBhigh (red) and APBlow (blue)). APB, alternate promoter use burden; TIL, tumour-infiltrating lymphocyte.
Reflecting the importance of studying tumour growth kinetics within the context of an active immune system, tumour uptake and growth initiation were faster in NSG compared with humanised mice: 97% of NSG and 63% of humanised mice developed a tumour by day 7 (Fisher’s exact p=0.00056). Notably, APBhigh and APBint cell lines exhibited faster tumour growth rates compared with APBlow cell lines in humanised mice, consistent with APBhigh tumours exhibiting immune escape potential and demonstrating tumourigenesis in an active immune system. Specifically, in the humanised mice, APBhigh cell lines had 90% tumour development (vs 100% in immune-deficient mice); APBint had 100% tumour development (vs 100% in immune-deficient); and APBlow had 20% (vs 93% in NSG) tumour development by day 7 (APBhigh/APBint vs APBlow, Fisher’s exact p=0.039). Growth rates between NSG and humanised mice were compared for each cell line. For APBhigh and APBint cell lines, tumours in humanised mice appeared to grow faster than tumours in NSG mice, while the converse was observed for APBlow cell lines, with tumours in NSG mice growing faster than humanised mice (figure 3B). By the end of the experiment, APBlow tumours grown in humanised mice were smaller than those grown in NSG mice (median 375 mm3 vs 512 mm3, p=0.033). In contrast, for APBint and APBhigh cell lines, humanised-mice tumours trended towards being larger than those grown in NSG mice (median 418 mm3 vs 257 mm3, p=0.073).
At the end of 1 month, mice were sacrificed, and tumours were harvested and analysed by microscopy and immunohistochemistry. APBlow tumours showed significant human T-cell infiltration into tumours, while APBhigh tumours had almost no human T-cell infiltration (figure 3C). APBlow tumours had significantly higher CD3+ (broad T-cell marker) cellular infiltration compared with APBhigh tumours (15% vs 4%, p=0.0085), and a trend towards higher CD8+ (cytotoxic T-cell marker) cellular infiltration (10% vs 2%, p=0.088) (figure 3D). Next, we performed bulk RNA-Seq on the tumours harvested from the humanised mice at the end of the experiment, studying the expression of genes marking specific cellular subtypes. APBlow tumours exhibited higher levels of both adaptive immunity cells (CD8A and PRF1 (cytotoxic T cells)) and innate immunity cells (PLD4 (dendritic cells) and CD163 (macrophages)) (online supplemental figure S3A). In contrast, APBhigh tumours grown in humanised mice did not show these features and demonstrated higher levels of only dendritic cells and macrophages (PLD4 and CD163, associated with innate immunity) (online supplemental figure S3B). In addition to immune cell types, we also studied expression of immune checkpoints in the tumours grown in humanised mice. APBlow tumours expressed higher levels of LAG3, a marker of T-cell exhaustion, and TIM3 (online supplemental figure S3C,D). These findings from the humanised-mouse model indicate that APBhigh tumours are likely to have the ability to evade the immune system and have an immunologically quiet phenotype, supporting orthogonal findings in primary tumours at both the bulk and single-cell levels.
High alternate promoter use is associated with resistance to ICIs across multiple tumour types
Early evidence has suggested that APBhigh STADs may be resistant to ICI therapy.10 We sought to build on those findings and to validate the hypothesis that APBhigh tumours are resistant to ICIs due to their immunologically quiet phenotype. APB was calculated from RNA-Seq data of 53 gastric cancer samples treated with pembrolizumab, nivolumab or atezolizumab (monoclonal antibodies against PD-1/PD-L1). The median age was 57 years and 75% were male (online supplemental table S5). All patients in the cohort had metastatic gastric cancer and had received at least one prior line of systemic therapy before entering an ICI clinical trial. Of the 53 samples, 13 tumours were classified as APBhigh; 27 were classified as APBint; and 13 were classified as APBlow (figure 4A). APBhigh tumours had a significantly poorer progression-free survival (PFS) compared with APBint (median PFS 55 vs 87 days, HR 0.39, 95% CI 0.19 to 0.80, p=0.01) and APBlow tumours (median PFS 55 vs 121 days, HR 0.40, 95% CI 0.18 to 0.93, p=0.032) (figure 4B). TCGA subtyping and PD-L1 immunohistochemistry data were available for 44 (83%) and 40 (75%) samples, respectively (online supplemental methods, table S5). EBV and MSI subtype tumours had a significantly higher PFS compared with CIN or GS tumours (median PFS not reached vs 80 days, HR 0.088, 95% CI 0.02 to 0.38, p=0.0011). PD-L1 combined positive score (CPS) ≥10 samples also had improved survival compared with CPS <10 (median PFS 254 vs 80 days, HR 0.33, 95% CI 0.13 to 0.87, p=0.025). These data are consistent with previous findings.26 27 Of particular clinical interest is the identification of predictive biomarkers for immunotherapy in the PD-L1 CPS <10 and CIN/GS subgroups. We first studied APB in the PD-L1 CPS <10 subgroup (n=31) and found APBlow and APBint tumours to have a significantly higher PFS compared with APBhigh (median PFS 119 vs 84 vs 48 days, HR 0.22, 95% CI 0.08 to 0.62, p=0.0042) (online supplemental figure S4A). When the PD-L1 CPS <10 tumours were restricted to only the CIN/GS subtype (n=28), the results were similar (median PFS 109 (APBlow) vs 83 (APBint) vs 48 days (APBhigh), HR 0.27, 95% CI 0.097 to 0.74, p=0.012) (online supplemental figure S4B).
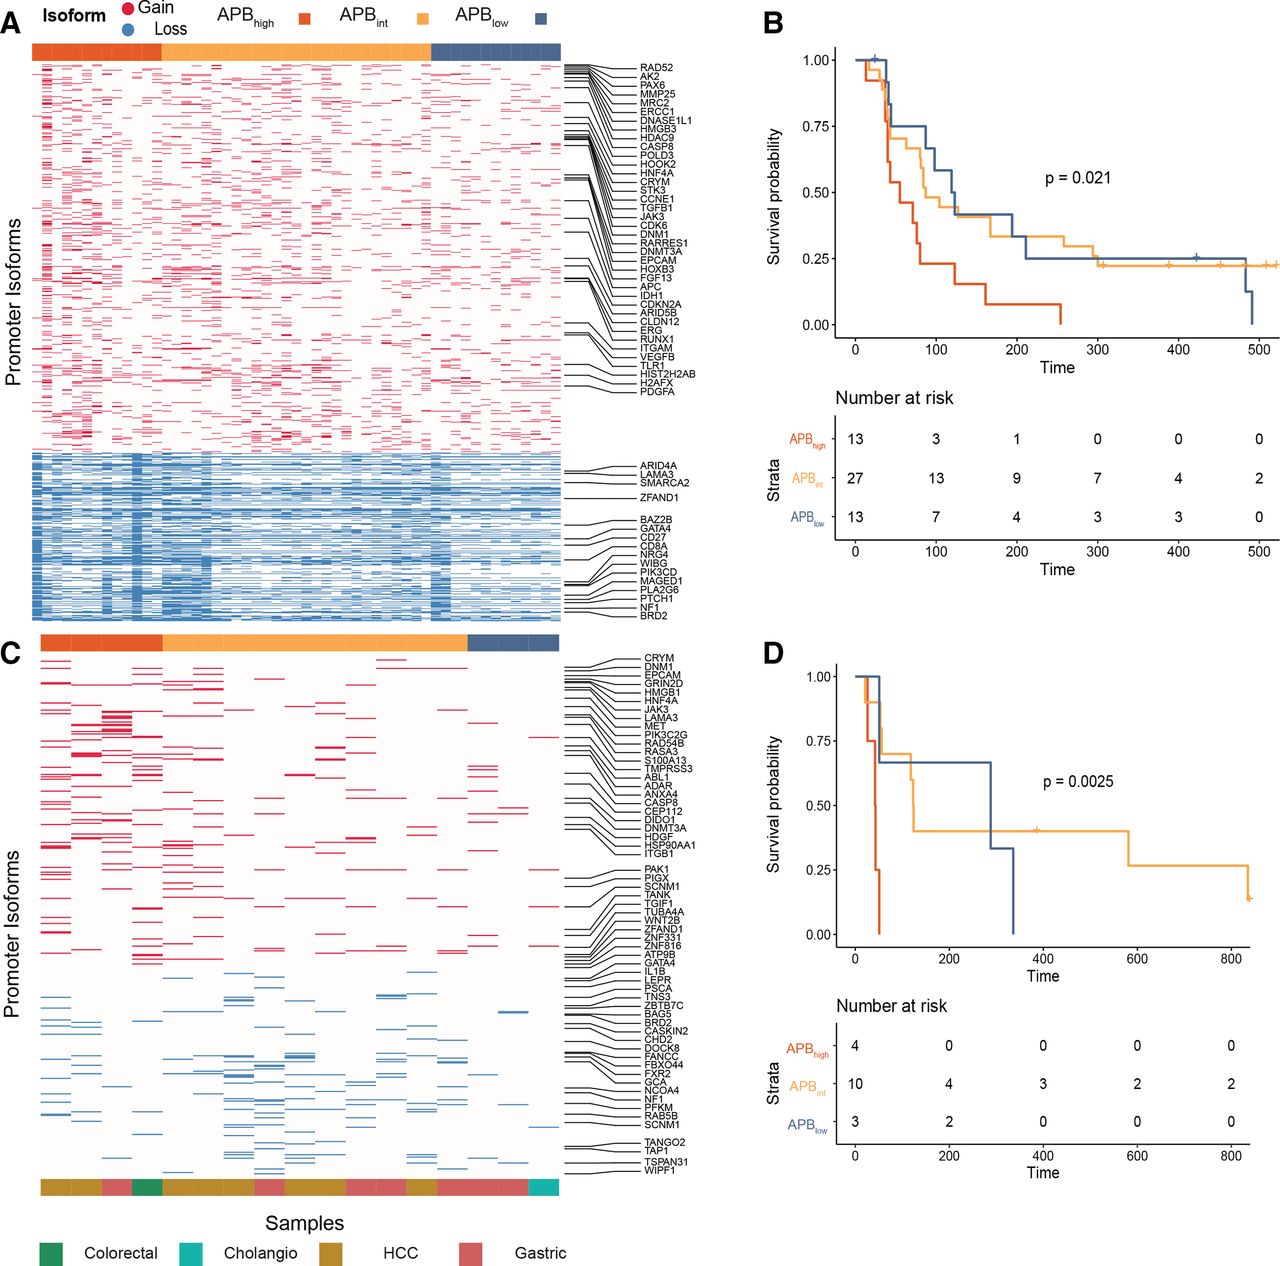
Resistance of APBhigh tumours to immune checkpoint inhibition. (A) Heatmap of alternate promoter use of gastric cancer ICI-treated samples. Fifty-three gastric cancer ICI-treated samples (nivolumab, pembrolizumab and atezolizumab) were used for this analysis. Gain alternative promoter (marked red in the heatmap) and loss alternative promoter (marked blue in the heatmap) use (in columns) per sample (in rows). (B) Gastric cancer ICI PFS by APB group (n=53). Kaplan-Meier curve of PFS comparing APBhigh (red) versus APBint (yellow) versus APBlow (blue). P value is according to two-sided log-rank test. (C) Heatmap of alternate promoter use measured by NanoString of ICI-treated non-squamous samples. In total, archival tissue of 17 non-squamous ICI-treated samples were used for NanoString analysis to calculate the APB. Gain alternative promoter (marked red in the heatmap) and loss alternative promoter (marked blue in the heatmap) use (in columns) per sample (in rows). (D) Survival of NanoString cohort of ICI-treated non-squamous samples (n=17). Kaplan-Meier curve of PFS comparing APBhigh (red) versus APBint (yellow) versus APBlow (blue). P value is according to two-sided log-rank test. APB, alternate promoter use burden; ICI, immune checkpoint inhibitor; PFS, progression-free survival.
To assess the specificity of APB in predicting responses to ICIs, we next studied the role of APB in predicting sensitivity to other types of systemic therapy. We analysed a separate cohort of 60 metastatic STADs treated with chemotherapy (first-line 5-fluorouracil and platinum-based chemotherapy, online supplemental table S1). There was no difference in PFS between the three APB groups (median PFS 158 (APBhigh) vs 129 (APBint) vs 154 days (APBlow), p=0.9) (online supplemental figure S4C). To extend this to another systemic therapy regimen, we then tested an independent cohort of patients with gastric cancer treated with a combination of chemotherapy and targeted therapy (paclitaxel and ramucirumab, n=47). We observed a similar lack of difference in PFS between the groups (median PFS 104 (APBhigh) vs 128 (APBint) vs 126 days (APBlow), p=0.8) (online supplemental figure S4D). These findings suggest that, within the limitations of the therapies tested, that the predictive nature of APB may be specific to ICI treatment.
For a large majority of clinical cohorts including those from clinical trials, only archival formalin fixed paraffin embedded (FFPE) tissue is available, which poses technical challenges, with respect to RNA extraction and characterisation using RNA-Seq.28 The NanoString platform has been validated to generate predictive gene-expression signatures from FFPE tissue that has been used in clinical practice.29 To explore additional cohorts, we thus designed a custom-made NanoString panel to infer APB in FFPE tissue, under the technical probe limitation of NanoString (800 probes). From 4519 promoters used to calculate the APB algorithm in RNA-Seq data, we identified the top-ranked promoters from the TCGA STAD analysis and designed alternate promoter probes for a NanoString panel. NanoString probes were designed to predominantly bind to the unique first exon junctions, allowing for identification and differentiation of alternate promoter transcripts. This approach is conceptually similar to the proActiv algorithm in identifying gain and loss promoter transcripts13 (online supplemental methods). We tested a heterogenous cohort of 35 ICI-treated GI tumours using this custom-designed NanoString panel. The cohort included tumours of squamous (anal and oesophageal) (n=18) and non-squamous (colorectal, gastric, cholangiocarcinoma (CHOL) and hepatocellular carcinoma (HCC)) (n=17) histology. Patients were treated with a range of ICIs including nivolumab, avelumab and durvalumab (monoclonal antibodies against PD-1/PD-L1). In the non-squamous cohort, APBhigh tumours had inferior survival compared with APBlow tumours (median PFS 43 vs 288 days, HR 0.10, 95% CI 0.01 to 0.78, p=0.028) (figure 4C,D). Similar results could not be replicated in the squamous cancer cohort (median PFS APBhigh 241 days vs APBint 142 days vs APBlow 216 days, p=0.99) (see the Discussion section). To further improve on APB measured through NanoString (online supplemental methods), we performed an analysis on archival FFPE tissue of 53 patients with gastric cancer treated with anti-PD-1 axis therapy (online supplemental table S1). APB was inferred using a similar formula and identified 13 APBhigh, 20 APBint and 20 APBlow samples. PFS of APBhigh patients was significantly lower compared with APBint and APBlow patients (48 vs 64 vs 175 days, HR (APBhigh vs APBlow) 0.25, 95% CI 0.11 to 0.57, p=0.001) (online supplemental figure S4E).
Having shown that APB could be potentially applied to other GI tumour types, we also studied RNA-Seq data of 66 HCC samples, of which 26 were treated with nivolumab and 40 were treated with pembrolizumab. Seventeen tumours were classified as APBhigh; 32 were classified as APBint; and 17 were classified as APBlow. APBlow tumours had a significantly better PFS compared with APBint/APBhigh tumours (median PFS 242 vs 90 vs 94 days, HR 0.51, 95% CI 0.27 to 0.99, p=0.046) (online supplemental figure S4F). Taken collectively, these findings suggest that our initial conclusions on gastric cancer could be expanded to GI tumours with high alternate promoter use, exhibiting a higher probability of primary resistance to immune checkpoint inhibition and suggesting a role for using APB as a predictive biomarker for immunotherapy.
High APB is associated with an immunologically quiet phenotype across multiple tumour types
Finally, to explore associations between APB and the immune tumour microenvironment in a wide set of tumour types, we quantified APB for 10 165 samples across 26 tumour types from the TCGA PanCanAtlas RNA-Seq database. Tumours were categorised into APBhigh, APBlow and APBint subgroups based on tumour type-specific quartiles (online supplemental figure S5A). Similar to STADs, the majority of tumour types exhibited a significant correlation between the APB groups and CD8A, GZMA and PRF1 expression. Specifically, of the 26 tumour types analysed, 16 (62%) had significant correlations with all three markers (figure 5A and online supplemental table S6). Only three tumour types had no correlation between APB and CD8A, GZMA or PRF1 (adrenocortical carcinoma (ACC), CHOL and uveal melanoma (UVM)). Notably, these latter three cohorts (ACC, CHOL and UVM) are all of relatively small sample sizes (n<100, median tumour-type dataset size=414). These results suggest that APB is associated with features of the immune microenvironment across multiple tumour types.

Pan-cancer APB association with immune correlates. (A) Association of APB groups in breast (BRCA), colorectal, head and neck (HNSC), kidney, squamous lung (LUSC) and melanoma (SKCM) with markers of T-cell cytolytic activity (CD8A, GZMA and PRF1). The APBhigh group is denoted in red, APBint in yellow and APBlow in blue. The APBhigh group shows lower expression of these three genes compared with APBint, which in turn shows a lower expression to the APBlow group (Wilcoxon test; ***p<0.001, **p<0.01, *p<0.05; n.s.). (B) Volcano plot of ~20 000 genes in the PanCanAtlas correlated with APBhigh and APBlow for six tumour types (BRCA, colorectal, HNSC, kidney, LUSC and SKCM). The x-axis is the log2FC of gene expression (RSEM) between APBhigh and APBlow. The y-axis is the −log10 adjusted p value results (Bonferroni correction). Genes that are at least >1.5× fold change and adjusted p<0.01 are coloured, while the rest are grey. Immune genes that are overexpressed APBhigh are dark red, while non-immune genes are pale red. Similarly, APBlow overexpressed immune genes are dark blue, while non-immune genes are pale blue. Nine selected immune checkpoints (PD1, PD-L1, PD-L2, LAG3, CTLA4, TIM3, ICOS, TIGIT and BTLA) are labelled. As a general trend, immune checkpoints appear to be overexpressed in APBlow tumours. APB, alternate promoter use burden; HNSC, head and neck squamous cell; log2FC, log2 fold change; LUSC, lung squamous; n.s., not significant; SKCM, melanoma.
To investigate additional immunological phenotypes associated with high APB, genome-wide expression differences between APBhigh and APBlow tumours were identified. From a total of ~20 000 genes compared, we selected the Immport subset—a database of ~4000 genes with immune-related functions and interactions.30 A larger number of Immport immune genes exhibited high expression in APBlow tumours relative to APBhigh tumours for several tumour-types (threshold: fold change >1.5, adjusted p value<0.01). For example, in breast cancer, Immport gene sets were significantly overexpressed in APBlow tumours (APBlow: 731 genes vs APBhigh: 339, p≤0.0001). Differential expressions of selected immune checkpoint genes (PD-1, PD-L1, PD-L2, CTLA4, LAG3, TIM3, ICOS, BTLA and TIGIT) were also studied between the APB groups. Similar to STAD, almost all immune checkpoints were overexpressed in APBlow tumours for a majority of tumour types (figure 5B). We also leveraged a pan-cancer TCGA study classifying tumours by immune signatures.22 APBlow tumours were found to have higher lymphocyte infiltration signature scores and interferon-γ response signatures (p<0.0001) (online supplemental figure S5B,C).
MSI status was available for 7919 samples, of which 176 tumours (2%) were found to be MSI-high. The prevalence of MSI-high in the APB groups was 3.3% APBlow, 2.5% APBint and 1.5% APBhigh (Fisher’s exact p=0.0016). Thus, similar to findings in STAD, there appears to be a trend for MSI-high tumours to be classified as APBlow (33% of all MSI-high tumours were APBlow compared with 15% being APBhigh), although it is worth noting that MSI-high tumours are found in all three APB groups. There was no correlation between APB and TMB (median APBlow 1.8 vs APBint 1.8 vs APBhigh 1.8 muts/Mb, p=0.64) (online supplemental figure S5D). Within MSI-H tumours, there was no difference in TMB between APBhigh and APBlow (p=0.13). Taken collectively, these results, based on gene expression analyses at the global, immune checkpoint and immune signature levels, suggest that APBhigh tumours are consistently associated with an immunologically ‘cold’ tumour phenotype.
Discussion
In this study, we sought to explore the role of alternate promoter use in cancer immunity and therapy response. Our results extend previous findings applying H3K4me3 histone profiling on primary STADs to infer promoter activity where tumour-associated promoter isoforms recurrently lost in STADs exhibited a significant enrichment in high-affinity major histocompatibility complex class I binding peptides.9 We proposed that this may reflect a novel tumour immune-editing mechanism where promoter alterations are used to evade the host immune system, thereby facilitating nascent tumour development.
Usage of alternate promoters at cancer-related genes such as NOTCH has been described to play a role in T-cell development and carcinogenesis, while in EBV-associated Natural Killer T-cell lymphoma, downregulation of immunogenic viral nuclear antigens through alternate promoter use has been proposed as a mechanism of immune escape.31 32 In our study, we found pervasive genome-wide usage of alternate promoters by tumours which was associated with evidence of immune-editing and evasion. It is worth noting that these associations were observed in multiple tumour types, despite using a set of promoters originally derived from STADs. It is possible that alternate promoter usage may be less related to specific tissue of origin and reflects a conserved pan-cancer response to host immunity. Correlation between alternate promoter use, TMB and MSI indicates that APB interacts with the tumour immune microenvironment through an independent mechanistic pathway, distinct from acquisition of DNA somatic mutations (represented by TMB and MSI status). Through correlative analysis of APB with tumour content and clonal heterogeneity, we also demonstrated that promoter alterations are driven through polyclonal mechanisms.
To assess the tumour microenvironment from bulk RNA-Seq data, we used expression of specific genes such as CD8A, GZMA and PRF1 as surrogates. Using single-cell RNA-Seq, which allows for identification and characterisation of different cellular subtypes within a heterogenous tumour microenvironment,33 we validated the use of these surrogate markers by confirming that the expressions of these genes are largely restricted only to immune cells of interest. Our scRNA-Seq also describes the expression of various immune checkpoints by cell type in STAD. These findings, along with others describing the immune contexture in STAD, form an important resource for the development of cellular therapies and novel checkpoint inhibitor combinations and strategies.34 Our scRNA-Seq dataset included samples from various TCGA subtypes including CIN, GS and MSI. A limitation of our study is that we could not include EBV gastric cancer, which is associated with high levels of T-cell infiltration and PD-L1 expression.35 EBV tumours tend to be more indolent, detected at earlier stages, and constitute the smallest subtype of gastric cancer in the TCGA (9%), with an even lower incidence in Asian cohorts (8%).36 Another interesting finding in our study was the higher levels of mast cells detected in the APBhigh STAD TCGA cohort samples. Mast cells are tissue-resident innate immune cells that have been associated with both activation and downregulation of adaptive and innate immune responses,37 and whose activity can be mediated by epigenetic regulators.38 Mast cells ameliorate effector T-cell function by inhibiting regulatory T cells through the OX40 axis.39 Higher mast cells in APBhigh tumours may reflect a compensatory upregulation of innate immunity due to the lower levels of T cells (adaptive immunity).40
For this study, we established an in vivo model to study the dynamic temporal interactions between alternate promoter use and the human immune system. While generating the model, we considered several factors—first, the model required a functional immune system, thereby prohibiting the use of conventional immunodeficient mice. Second, as the model had to allow testing of tumours with diverse molecular phenotypes; traditional syngeneic murine models where tumours are derived from the same genetic background as the host mouse were ruled out. The humanised mouse model bridges a significant gap from traditional human patient-derived xenograft models which are grown in immunodeficient mice, or in vitro cell-line/T-cell co-culture models for testing of tumour-immune interactions.41 Humanised-mouse models have been used to study HCC, lung cancer, sarcoma and breast cancer.41 42 Our study is the first to analyse STADs using humanised mice and employ experimental designs mirroring preceding studies, comparing tumour growth kinetics between humanised-mice and immune deficient mice. APBlow tumours appeared to grow later and slower in humanised mice compared with immune-deficient mice and to APBhigh tumours. Similar findings were seen in triple negative breast cancers, where tumours grew faster in immune-deficient mice compared with humanised mice.42 Increased presence of cytotoxic T cells within the tumours limiting growth in humanised mice was demonstrated in an HCC study, and treatment with pembrolizumab demonstrated a further increase of TILs.41 Notably, harvesting and analysing the tumours at the end of our experiment to evaluate the tumour immune microenvironment demonstrated the lack of TILs in APBhigh tumours, a finding consistent with the other experiments in our study. The humanised-mouse model developed in this study is an ideal platform to test therapeutic strategies such as these, which target the tumour−immune system interface. However, one of the limitations is the treatment of the model with immunotherapy and epigenetic agents will require rigorous optimisation and controlling as the platform has not been used in gastric cancer models previously. Other limitations of the mouse-model experiment include the subcutaneous flank injection of the tumours. Intragastric transplantation of tumours has been described in immune-deficient patient-derived organoid models and could potentially be incorporated in future humanised-mouse experiments with gastric cancer.43 44
Prognostic biomarkers guide on patient outcomes or survival regardless of therapy, while predictive biomarkers provide information on the effectiveness of a specified therapy.45 Currently, the most developed predictive biomarkers for ICI are PD-L1 expression measured by immunohistochemistry, MSI and TMB.46 47 These biomarkers are positive predictive biomarkers that identify tumours that are likely to respond to ICI. However, controversies surrounding these biomarkers have been raised and ICI responses in biomarker-negative populations have been observed.48 These observations highlight the complementary role of negative predictive biomarkers for ICIs that identify tumours resistant to therapy, similar to RAS mutations in colorectal cancer that predict resistance to anti-EGFR therapies.49 By analysing the predictive value of APB in chemotherapy and targeted therapy cohorts as well,50 51 we confirmed that within the limitations of the therapies tested, the predictive nature of APB may be specific to ICI treatment. Our findings may guide selection of patients with gastric cancer for immunotherapy treatment by categorising patients into three groups: first, the ‘likely responders’, which consist of MSI-H, EBV and PD-L1 CPS ≥10 subgroups. Second, the ‘unlikely responders’, consisting of APBhigh patients, with the remaining patients falling to the third category of ‘possible responders’. The remaining third group of patients tends to demonstrate moderate benefit from immunotherapy but with earlier resistance and modest PFS.
Sensitivity to immune checkpoint inhibition is driven through various factors including neoantigen formation, tumour mutational burden and PD-L1 expression.47 Our cohort of GI squamous cell cancers consisted of oesophageal and anal carcinoma, while our APB algorithm was derived from adenocarcinoma samples of gastric cancer origin. The TCGA comparison of squamous and adenocarcinoma histological subtypes of the oesophagus has also identified significant genomic and epigenetic differences.52 Squamous oesophageal cancer has also been shown to have a significantly higher proportion of responses to immune checkpoint inhibition compared with oesophageal adenocarcinoma, driven by higher PD-L1 expression.52 53 A similar high response rate of squamous anal carcinoma to pembrolizumab has also been demonstrated.54 These results were reflected in our cohort as well, with 72% of patients having disease control (stable disease or partial response) as best response to ICI in the squamous cohort, compared with 41% in the adenocarcinoma cohort. Thus, as our APB algorithm appears to best function as a negative predictive biomarker, identifying poor responders to ICI, the high sensitivity of squamous cancers to ICI and small numbers may be reasons for the NanoString panel failing to differentiate responders and non-responders in the squamous GI cancer cohort. The identification of a subgroup of tumours exhibiting primary resistance to immunotherapy that are associated with alternate promoters raises intriguing possibilities for biomarker-selected combination therapeutic strategies. Drugs targeting epigenetic pathways such as DNA methyltransferase and histone deacetylase have been shown to abrogate immune evasion through targeting mechanisms such as antigen processing and presentation, expression of chemokines and immune checkpoints, and host immune priming.55 Several trials are currently ongoing, looking at the role of combining epigenetic agents with ICI, aiming to convert immunologically ‘cold’ to ‘hot’ tumours that may be more sensitive to immunotherapy.55–57
In conclusion, our study describes alternate promoter usage as a conserved pan-cancer marker that is associated with an immune-depleted tumour microenvironment, and quantification of APB may serve as a novel negative predictive biomarker of immune checkpoint inhibition.
Data availability statement
Data used in this manuscript includes previously published studies with genomic data files from public repositories: European Nucleotide Archive: PRJEB25780 and PRJEB34724 The Cancer Genome Atlas Research Network: dbGaP: phs000178.v10.p8 Data used in this manuscript includes previously published studies with genomic data files from public repositories:European Nucleotide Archive: PRJEB25780 and PRJEB34724The Cancer Genome Atlas Research Network: dbGaP: phs000178.v10.p8NanoString data file is provided as a Supplementary Table (attached) https://www.ebi.ac.uk/ena/data/view/PRJEB25780; https://www.ebi.ac.uk/ena/data/view/PRJEB34724https://www-ncbi-nlm-nih-gov.libproxy1.nus.edu.sg/projects/gap/cgi-bin/study.cgi?study_id=phs000178.v10.p8.
Ethics statements
Patient consent for publication
Ethics approval
The study was approved by the local ethics board (DSRB reference number 2005/00440).
Acknowledgments
We thank the patients and their families for participating in our trials and magnanimously providing consent for the use of tissue to further the science.
References
Supplementary materials
Supplementary Data
This web only file has been produced by the BMJ Publishing Group from an electronic file supplied by the author(s) and has not been edited for content.
Supplementary Data
This web only file has been produced by the BMJ Publishing Group from an electronic file supplied by the author(s) and has not been edited for content.
Footnotes
RS and PT are joint senior authors.
K-KH, VK, KR, DD and ZH contributed equally.
Contributors Conceptualisation: RS, AQ, JG and PT; data curation: RS, KKH, DD, VK, KR, ZH, XO, ZFBAI, MX, AL-KT, DWMT, WZ, SPC, JQL, MDT, LM, EC, MF, MN, FP, JL, JY, CCYN, SYR, JS, KM, YN, WPY, QC and JG; formal analysis: RS, KKH, AQ, VK, ADJ, MDS, YAG, AJS, JG and PT; funding acquisition: JG and PT; methodology: RS, VK, MDS, QC, DD, AQ, JG and PT; project administration: RS and PT; resources and supervision: QC, JG and PT; visualisation: RS, AQ, KKH, RP and AF; writing of the original draft: RS; writing (review and editing): ZH, QC, JG and PT; approval of final version of manuscript: all authors.
Funding RS is supported by a National Medical Research Council (NMRC) Fellowship (NMRC/Fellowship/0059/2018 and MOH-000627), Singapore. FP is supported by a research grant from Associazione Italiana per la Ricerca sul Cancro (AIRC IG 2019 Id.23624). PT is supported by Duke-NUS Medical School and the Biomedical Research Council, Agency for Science, Technology and Research. Humanised mouse work was supported by National Research Foundation Singapore Fellowship (NRF-NRFF2017-03) to QC. This work was also supported by National Medical Research Council grants OF-LCG18May-0023, NR13NMR111OM, and NMRC/STaR/0026/2015.
Competing interests The subject matter in this manuscript was submitted as a technology disclosure to the institutional Technology Transfer Office for potential intellectual property protection. PT had stock and other ownership interests in HealthSeq, research funding from Kyowa Hakko Kirin and Thermo Fisher Scientific, and patents/other intellectual property through the Agency for Science and Technology Research, Singapore (all outside the submitted work). RS received honoraria from Bristol-Myers Squibb, Lilly, Roche, Taiho, Astra Zeneca, DKSH and MSD; had advisory activity with Bristol-Myers Squibb, Eisai, Merck, Bayer, Taiho, Novartis, MSD and AstraZeneca; received research funding from Paxman Coolers and MSD; received travel grants from AstraZeneca, Roche, Eisai and Taiho Pharmaceutical (all outside the submitted work). FP received honoraria for speakers’ bureau/advisory activity from Amgen, Merck-Serono, Roche, Lilly, Sanofi, Bayer and Servier, and received research funding from BMS (all outside the submitted work).
Provenance and peer review Not commissioned; externally peer reviewed.
Supplemental material This content has been supplied by the author(s). It has not been vetted by BMJ Publishing Group Limited (BMJ) and may not have been peer-reviewed. Any opinions or recommendations discussed are solely those of the author(s) and are not endorsed by BMJ. BMJ disclaims all liability and responsibility arising from any reliance placed on the content. Where the content includes any translated material, BMJ does not warrant the accuracy and reliability of the translations (including but not limited to local regulations, clinical guidelines, terminology, drug names and drug dosages), and is not responsible for any error and/or omissions arising from translation and adaptation or otherwise.