Article Text

Abstract
Objective To profile gut microbiome-associated metabolites in serum and investigate whether these metabolites could distinguish individuals with colorectal cancer (CRC) or adenoma from normal healthy individuals.
Design Integrated analysis of untargeted serum metabolomics by liquid chromatography-mass spectrometry and metagenome sequencing of paired faecal samples was applied to identify gut microbiome-associated metabolites with significantly altered abundance in patients with CRC and adenoma. The ability of these metabolites to discriminate between CRC and colorectal adenoma was tested by targeted metabolomic analysis. A model based on gut microbiome-associated metabolites was established and evaluated in an independent validation cohort.
Results In total, 885 serum metabolites were significantly altered in both CRC and adenoma, including eight gut microbiome-associated serum metabolites (GMSM panel) that were reproducibly detected by both targeted and untargeted metabolomics analysis and accurately discriminated CRC and adenoma from normal samples. A GMSM panel-based model to predict CRC and colorectal adenoma yielded an area under the curve (AUC) of 0.98 (95% CI 0.94 to 1.00) in the modelling cohort and an AUC of 0.92 (83.5% sensitivity, 84.9% specificity) in the validation cohort. The GMSM model was significantly superior to the clinical marker carcinoembryonic antigen among samples within the validation cohort (AUC 0.92 vs 0.72) and also showed promising diagnostic accuracy for adenomas (AUC=0.84) and early-stage CRC (AUC=0.93).
Conclusion Gut microbiome reprogramming in patients with CRC is associated with alterations of the serum metabolome, and GMSMs have potential applications for CRC and adenoma detection.
- colorectal adenomas
- colorectal cancer
Data availability statement
Readers can now access the original datasets of untargeted metabolomics at National Population Health Data Center and Population health Data Archive (https://www.ncmi.cn/phda/dataDetails.html?type=project_data&id=CSTR:17970.11.A001M.202105.612.V1.0).
This is an open access article distributed in accordance with the Creative Commons Attribution Non Commercial (CC BY-NC 4.0) license, which permits others to distribute, remix, adapt, build upon this work non-commercially, and license their derivative works on different terms, provided the original work is properly cited, appropriate credit is given, any changes made indicated, and the use is non-commercial. See: http://creativecommons.org/licenses/by-nc/4.0/.
Statistics from Altmetric.com
Significance of this study
What is already known on this subject?
The gut microbiota is closely related to the initiation and progression of human cancers, and metabolites produced by gut bacteria can enter the circulation and perform regulatory functions.
What are the new findings?
Gut microbiome reprogramming in patients with colorectal cancer (CRC) is associated with alterations of the serum metabolome, and changes in gut microbiome-associated serum metabolites (GMSM) can efficiently discriminate patients with CRC and adenoma from normal individuals.
We have developed a model based on GMSM that can distinguish patients with CRC and adenoma from healthy normal subjects more efficiently than carcinoembryonic antigen, the clinical marker.
How might it impact on clinical practice in the foreseeable future?
The GMSM panel provides a promising non-invasive approach for the detection of CRC adenoma.
Introduction
Colorectal cancer (CRC) has become a growing challenge worldwide, and its early diagnosis is recognised as an effective way to improve the survival rate for patients with CRC. Several approaches have been adopted to detect CRC, like non-invasive methods such as the faecal occult blood test (FOBT) and carcinoembryonic antigen (CEA) test, as well as invasive procedures such as colonoscopy.1–3 However, the large-scale use of these methods is limited due to the low accuracy of the non-invasive tests and the damage caused by the invasive test.1 4 5 Therefore, a non-invasive and accurate detection method for CRC is required.
The influence of the microbiome on human diseases such as cancer is attracting increasing attention. Among all tumours, gastrointestinal malignancies are profoundly affected by gut bacteria due to their spatial proximity, and their associations with the gut microbiome have been intensively investigated.6–8 The composition of the gut microbiota can be significantly altered in patients with adenoma or CRC, with increases in the Bacteroides, Parvimonas, Bilophila and Fusobacterium, and decreases in the Ruminococcus, Bifidobacterium and Streptococcus species.9–11 These altered microbiomes can modulate local immune responses and produce genotoxins such as colibactin and microbiome-specific metabolites such as secondary bile acids and short-chain fatty acids that can regulate tumour initiation and progression.8 12–16
Tumourigenesis is accompanied by global alterations of the metabolic state, affecting both tumour tissues and the surrounding microenvironment and macroenvironment.17 18 Compared with genomic and proteomic alterations, metabolic changes can be more directly observed for tumour cell states and are therefore a promising source of biomarkers for the detection of tumourigenesis.19 Various studies have shown that metabolites produced by gut bacteria can enter circulation and perform regulatory functions in distal organs.20–23 In recent years, serum metabolites that are closely correlated with CRC have been intensely investigated with the aim of developing diagnostic biomarkers.24–29 However, the effects of CRC-associated changes in the microbiota on blood metabolites and the clinical relevance of these alterations remain unclear.
In this study, we performed an integrated analysis of serum metabolomics and metagenome sequencing of paired faecal samples and identified a set of serum metabolites in patients with CRC and adenoma that exhibited a close association with the gut microbiota. Based on these metabolites, we developed a gut microbiome-associated serum metabolite (GMSM) panel that accurately discriminates patients with CRC and adenoma (collectively termed colorectal abnormal) from normal (healthy) individuals (figure 1A).

Overview of the serum metabolomic alterations in patients with colorectal cancer (CRC) and adenoma compared with the normal population. (A) Diagram showing an overview of the experimental design and analysis procedures. In the discovery phase, untargeted metabolomic profiling and metagenome sequencing was carried out in the discovery cohort, and the serum and faeces matched cohort, revealing the serum metabolite profiles of the metabolites that are associated with the gut microbiome and significantly altered in patients with adenoma and CRC, and targeted metabolic detection was carried out in the discovery cohort to select candidate metabolite biomarkers; based on the biomarker panel, the diagnostic model was established in the modelling cohort and the cut-off value was determined; at the validation phase, the cut-off value determined in the modelling cohort was directly transferred to an independent validation cohort to validate the performance of the diagnostic model, including its stage-specific performance and its comparison with the clinical CEA marker. (B) Diagram showing the composition of the cohorts involved in this study. For individuals in the discovery, modelling, and validation cohort, only serum samples were collected. Both faecal and serum samples from the same individual were collected in the serum and faeces-matched cohort. N:normal population (blue); A:adenoma (red); C: CRC patients (green). (C) Distribution of the R2 values of untargeted metabolomic features in the negative ion mode (left) and positive ion mode (right). The R2 value indicates the correlation between the expected N-pool/C-pool mixing ratio and the measured N-pool/C-pool mixing ratio for each metabolite. (D) The PCA plot showing the differences in the serum metabolomics states of samples from the normal population (N, blue), the population of patients with adenoma (A, red), and the population of patients with CRC (C, green) based on all significantly altered metabolites. (E) A Venn diagram showing the overlaps among the three altered metabolites pairs (A vs N, C vs N and a vs C). N:normal population; A:adenoma patients; C: CRC patients. (F) A heatmap showing the abundances of metabolites that showed significant alteration in patients with adenoma (A, red) and CRC (C, green) compared with the normal population (N, blue). (G) Based on metabolites that showed significant alteration in patients with adenoma and CRC compared with the normal individuals, the PCA plot shows clear discrimination between the normal individuals (N, blue), colorectal abnormal (A, red) and (C, green) patients. CEA, carcinoembryonic antigen; LC-MS, liquid chromatography-mass spectrometry; PCA, principal component analysis.
Materials and methods
Study cohorts and sample preparation
Our cross-sectional study was divided into four cohorts (figure 1B, online supplemental table S1). Please see online supplemental material methods for further details.
Supplemental material
Supplemental material
Metabolite extraction
For metabolite extraction in untargeted metabolomics detection, 60 µL of previously thawed serum was used. The method for metabolite extraction in targeted metabolomics detection was the same as those used for the untargeted metabolomics detection except for some modifications. Please see online supplemental material methods for further details.
Quality control samples and quality control matrix
An equal volume of serum derived from each individual in the normal population from the discovery cohort was pooled together as the N-pool sample. The method for the generation of the C-pool sample was the same as those used for the N-pool sample. A series of quality control (QC) matrices were generated by mixing different volumes of C-pool and N-pool samples. Please see online supplemental material methods for further details.
Untargeted metabolite profiling
Metabolites extracted from the discovery cohort and the serum and faeces matched cohort were analysed by the Q exactive mass spectrometer coupled with UltiMate3000 ultraperformance liquid chromatography (Thermo Fisher). Please see online supplemental material methods for further details.
Metabolomic data preprocessing
Peak extraction and alignment were performed using the Progenesis QI software. Please see online supplemental material methods for further details.
Metabolite annotation and inferring
Metabolite annotation was done as previously described with some modifications.30 Please refer to online supplemental material methods for further details.
Metagenome sequencing and taxonomic profiling
DNA extraction of the faecal samples was done by the QIAamp DNA Stool Mini Kit. Whole-genome shotgun metagenome sequencing was subsequently carried out and used for the taxonomy and function analysis of the gut microbiome.31 Please see online supplemental material methods for further details.
Targeted metabolite profiling
Without using pure standards, we optimised the pseudotargeted method, described by Zheng et al,32 to determine the relative level of all metabolites in the identified panel by using the same reference pool for normalising abundances of each individual. The ExionLC AC system was connected to a 6500 QTrap Mass Spectrometer (Sciex) run in separate ion modes (positive and negative). The mobile phase and the column used for reversed-phase liquid chromatography were the same as those used for the untargeted metabolite profiling. Please see online supplemental material methods for further details.
Air-flow assisted desorption electrospray ionisation mass spectrometry imaging analysis of the CRC and adjacent normal tissue
For mass spectrometry imaging (MSI), a total of nine pairs of human colorectal tissue samples, including advanced adenoma or CRC and the adjacent noncancerous tissues, were collected. These samples were freshly frozen with liquid nitrogen immediately after biopsy, transferred to cryogenic vials, and stored at −80°C. The details of this method are described by Sun et al. 33
Data analysis
Data preprocessing, statistical analysis and predictive model building were conducted using R programming (V.3.6.1).
Statistical analysis
Using analysis of variance with Tukey’s honestly significant difference (HSD) test, we selected metabolites with an adjusted p<0.005 as significantly altered. Please see online supplemental material methods for further details.
Estimation of the accuracy, precision and linearity of the semiquantitatively untargeted metabolomic profiling
The QC samples, including the C-pool and N-pool, as well as the mixed pool samples (NC10, NC20, NC30, NC40, NC50, NC75 and NC90), were built as described in the ‘QC samples and QC matrix’ section and were used to calculate the accuracy. Please see online supplemental material methods for further details.
Gut microbiome-serum metabolome correlation analysis
Pairwise correlation coefficients using Pearson’s correlation coefficients between the gut microbiome species and serum metabolites were carried out using the 33 abnormal colorectal patients in the serum and faeces matched cohort. The correlation coefficient and p value for each species–metabolite pair was calculated and considered significantly associated with the cut-off of p≤1E-3.
Selection of the metabolites for the CRC GMSM panel to detect CRC
To select the metabolite features for the CRC GMSM panel, we implemented the least absolute shrinkage and selection operator (LASSO) algorithm with 10-fold cross-validation for feature selection from the GMSM data, as reported previously.34 Please see online supplemental material methods for further details.
Results
Semiquantitative untargeted metabolomics profiling in the serum from the discovery cohort revealed significantly altered metabolites in patients with CRC and adenoma
Tumourigenesis is accompanied by global alterations of the metabolite state in local tissues and the circulation system.17 To investigate the relationship between the serum metabolome and colorectal adenoma or cancer, untargeted metabolomic profiling by metabolomic analysis was done in the discovery cohort (figure 1A). The discovery cohort was divided into three populations: Normal healthy population (N, n=31), patients with adenoma (A, n=12) and patients with CRC (C, n=49) (figure 1B). Low-abundance signals (mean abundance of <5000 in all the three populations) were filtered out first. Distributions of the R2 values of the linear regression model between the expected mixing ratio and measured mixing ratio for each metabolite detected, in either the negative and positive ion mode, are displayed in figure 1C, showing that more than 50% of the metabolites have R2 values larger than 0.9, indicating the accuracy of our metabolite detection, as well as the robust linearity of these metabolites within this concentration range. Additionally, we also profiled the coefficient of variances (CV%) for all metabolite features using pooled CRC samples (C-pool) as the QC and observed that the CVs for more than 90% of these features were less than 15% (online supplemental figure S1C), indicating the stability among different detection batches.
Supplemental material
Next, we explored metabolites that showed significantly altered abundances between the different pairs of the population (C vs N, A vs N and C vs A, adjusted p<0.005, fold change >1.2 or <0.8). The distribution of all the samples in a principal component analysis (PCA) plot based on all these altered metabolites (figure 1D) revealed similar patterns for the patients with adenoma and cancer, while the normal population could be clearly distinguished from these two populations. On further comparison of the significantly altered metabolites in the three pairs, the C versus N pair showed the most remarkable similarity with the A versus N pair, indicating that tumourigenesis had already induced significant serum metabolic changes at the adenoma stage (figure 1E). The metabolites that were significantly altered in both the C versus N pair and the A versus N pair (1426 metabolite features in total), termed ‘colorectal abnormal-associated metabolites,’ were used for further analysis since they exhibited both early and sustained alterations during tumour progression. Out of the 1426 metabolite features, 885 could be annotated (online supplemental table S2), and the relative abundances of these metabolites in the discovery cohort are displayed in figure 1F. Based on these metabolites, a clear division between abnormal colorectal patients (C and A) and the normal individuals could also be achieved (figure 1G).
Supplemental material
Investigation of gut microbiome-associated metabolites in serum that are significantly altered in abnormal colorectal patients
Alterations of the microbiome composition in abnormal colorectal patients contribute to the reprogramming of local metabolome profiles.9 10 However, whether these changes related to a colorectal abnormality in the gut microbiota could cause reprogramming of the serum metabolome remained unclear. To further investigate the association between the gut microbiome and colorectal abnormal-associated serum metabolites and to determine the potential contribution of these microbiome-associated metabolites to predict colorectal abnormality, we performed an integrated microbiome–metabolome analysis in the serum and faeces matched cohort by an associated analysis of the metagenomic profiling of the faecal samples with the metabolome of the matched serum samples (figure 2A). In total, data from 44 individuals in the serum and faeces-matched cohort passed the QC and was used for subsequent analysis. Taxonomic profiling of the metagenome data revealed 12 455 microbiome species. Among these species, we observed an elevation of the enterotoxigenic bacteria Bacteroides fragilis (ETBF), which has been proposed to be a keystone pathogen in CRC initiation (figure 2B, highlighted in red). Several other CRC-promoting species, including Fusobacterium nucleatum, Parvimonas micra and Campylobacter jejuni, were all significantly upregulated (figure 2B, highlighted in red), while probiotics such as Bifidobacterium longum were downregulated in the patients with CRC (figure 2B, highlighted in blue).8 35 The changes in the abundance of these CRC-related species were consistent with that of a previous report.10

Investigating the gut microbiome-associated serum metabolites significantly altered in abnormal colorectal patients by integrating faecal metagenome and serum metabolome analyses. (A) Diagram showing the procedure of integrated analysis of the faecal metagenome and serum metabolome in the serum and faeces matched cohort (11 normal individuals, 33 patients with adenoma and CRC). Untargeted metabolic detection of the serum samples and metagenome sequencing of the faecal samples were carried out in this cohort. Significantly altered microbiome species between the normal and colorectal abnormal populations were calculated based on their relative abundances. Pearson correlation coefficient analysis was carried out in the 33 abnormal colorectal patients, and the gut microbiome-associated serum metabolites profile was established. Additionally, we used MSI and the correlation results of the bile acids to further support our correlation analysis’s reliability. (B) Relative abundances of several CRC-associated gut microbiome species in the normal individuals and abnormal colorectal patients of the matched cohort (red indicates tumour-promoting species, blue indicates probiotics). (C) Distribution of the Pearson correlation coefficients between each serum metabolite and gut microbe species (cut-off: p<1E-3, FDR ≤18%). (D) Sankey diagram showing covariations between CRC-associated gut microbes and their correlated serum metabolites. Associations between metabolites and species that have been previously reported to be tumour-promoting in colorectal cancer are highlighted in red, while associations between metabolites and antitumoural species are highlighted in blue. Grey lines represent the associations of these metabolites with other bacterial species, which have no clear roles in CRC. The meaning of colour codes for these metabolites was as following: metabolites associated with CRC-promoting species (purple), with antitumoural species (green), with both antitumoural and tumour-promoting species (dark blue), which is consistent with the colour codes in figure 2E. (E) A heatmap showing the relative abundances of metabolites associated with CRC-promoting species (purple), with antitumoural species (green), or with both antitumoural and tumour-promoting species (dark blue) in the discovery cohort. Metabolites associated with tumour-promoting species were significantly enriched in the patients with adenoma and colorectal cancer, while metabolites associated with antitumoural species were higher in the normal individuals. All the individuals were ranked by an association index (column on the right of the heatmap) of their metabolites with the tumour-promoting species. Based on this value, the normal individuals (light blue) could be clearly distinguished from the abnormal colorectal patients (red). CRC, ryonic anti; FDR, false discovery rate; GMSM, gut microbiome-associated serum metabolites; MSI, mass spectrometry imaging.
Metabolites with a mean abundance of less than 5000 were filtered out. Gut microbiome species with a relative abundance higher than 0.1% in at least one individual were considered. Among the 12 455 species in total, 640 passed this filter. Subsequently, Pearson’s correlation coefficient analysis was carried out using these gut microbiome species and metabolites among the 33 patients with CRC. The cut-off value of significant correlation was set at a p<1E-3, and the false discovery rate at this point was 18% (figure 2C). Among the correlated species-metabolite pairs, 322 metabolite features were in the 885 colorectal abnormal correlated metabolites identified in the discovery cohort (detailed association scores were listed in online supplemental table 3). These metabolites exhibited a significant association with the gut microbiome, including bacterial species that are reported to be associated with CRC initiation and progression (online supplemental table 4a), such as CRC-promoting F. nucleatum, P. micra, Alistipes finegoldii and Odoribacter splanchnicus (online supplemental table 4a and figure 2D, highlighted in red), as well as probiotics such as B. longum and Parabacteroides distasonis (online supplemental table 4a and figure 2D, highlighted in blue).8 36–38 By assessing the potential contribution of microbiome-associated metabolites in predicting colorectal abnormality, we observed that 63 metabolites associated with these CRC-related microbiome species could explain 87% of the total variance (mean out-of-sample R2=0.87) between the normal and colorectal abnormal metabolomes in the discovery cohort, while the 885 colorectal abnormality correlated metabolites explained 93% of the total variance (mean out-of-sample R2=0.93). By plotting the relative abundances of these metabolites, we observed a significant enrichment of tumour-promoting bacterial species-associated metabolites in the abnormal colorectal patients. In contrast, probiotic-associated metabolites were enriched in the normal population, and a clear separation between the normal individuals and the abnormal colorectal patients could be achieved based on the metabolite distribution (figure 2E). These observations suggest that CRC-related microbiome species are closely associated with alternations in serum metabolites. In addition to the previously characterised CRC-related species, these metabolites also exhibited a close association with a huge number of other species with unknown associations with colorectal abnormality (figure 2D and online supplemental table 4a in grey). Some of these species also showed significantly altered abundances between the normal individuals and abnormal colorectal patients (summarised in online supplemental table 4b), such as Enterobacter hormaechei (C vs N fold change=6.23, p=0.021) and Peptostreptococcaceae bacterium (C vs N fold change=0.602, p=0.049), suggesting their potential roles during colonic cancer progression.
Supplemental material
Supplemental material
Supplemental material
To further support the association between the microbiome and serum metabolites defined in our dataset, we used secondary bile acids as examples since their metabolism is reportedly closely related to the gut microbiome and CRC progression.13 39 Conjugated bile acids secreted by the liver such as tauro-CA/glycol-CA are deconjugated by microbiomes harbouring bile salt hydrolase activity, while free unconjugated primary bile acid (CA) can be subsequently converted into deoxycholic acid (DCA) via the bile acid-inducible gene cluster encoded in certain bacterial species including Clostridiaceae and Eggerthella spp (online supplemental figure S2A).39 These bile acids might be reabsorbed in the intestine and enter the circulation system. To further directly evaluate the effects of the CRC-related gut microbiome on serum metabolism, we analysed the changes in the abundance of CA and secondary bile acids (DCA) in the abnormal colorectal patients versus the normal individuals. Serum concentrations of unconjugated CA and DCA were upregulated in the abnormal colorectal patients (online supplemental figure S2B, C). Further correlation analysis revealed the association of gut microbiome species with these bile acids, and for example, Fusobacterium pseudoperiodonticum was significantly positively correlated with free CA (online supplemental figure S2D), upper panel), while Bilophila wadsworthia, the growth of which has been reported to be stimulated by bile acids, was correlated with DCA (online supplemental figure 2, lower panel).40 These species were also over-represented in the CRC population (online supplemental figure S2E), which is consistent with findings of previous studies.10
Supplemental material
We also examined whether alterations of these gut microbiome-associated metabolites were present in the colorectal tissues. Ambient MSI was applied in nine pairs of freshly frozen tissues from colorectal adenoma or cancer biopsies and adjacent normal tissues to compare the relative amounts of metabolites. As shown in online supplemental figure S3, the abundance of the metabolite N,O-Bis-(trimethylsilyl)phenylalanine was significantly upregulated in the tumour/adenoma tissues compared with the adjacent normal tissues (online supplemental figure S3A); a similar alteration was also observed in the serum of abnormal colorectal patients (online supplemental figure S3B). Moreover, N,O-Bis-(trimethylsilyl)phenylalanine also exhibited a significant positive association with several species including Clostridiales bacterium VE202-01 (r=0.586, p=3.4E-4) and Erysipelatoclostridium ramosum (r=0.549, p=9.34E-4) in the 33 abnormal colorectal patients (online supplemental table S3), and the relative abundances of these species also showed an upregulation in abnormal colorectal patients (online supplemental figure S3C), suggesting that CRC-related microbiome reprogramming might positively regulate the biosynthesis of this metabolite, which could be reflected in the serum metabolome.
Supplemental material
Collectively, these results support that the CRC-associated gut microbiome could contribute to the alterations in specific serum metabolites.
A panel of GMSM could predict colorectal abnormality in the discovery cohort
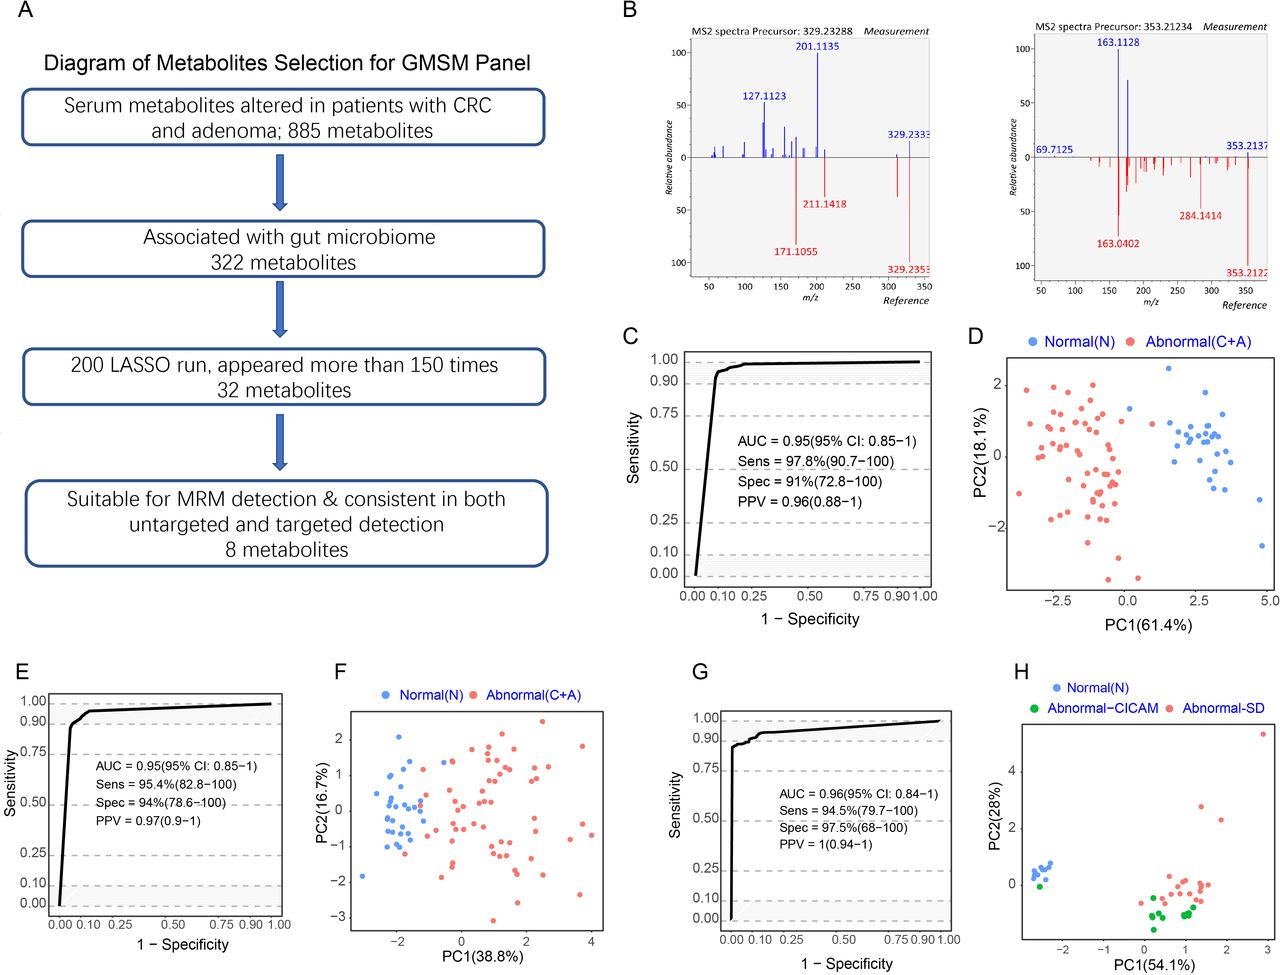
Based on the 322 GMSM described above, we used the LASSO algorithm to identify key metabolite biomarkers for detecting colorectal abnormality (figure 3A). After performing 200 LASSO runs, 32 metabolite features in total consistently appeared more than 75% of the time (online supplemental table 5). Among them, eight metabolites could be reliably identified, showing a consistent upregulation or downregulation trend in both untargeted and targeted metabolomic detection, indicating that these metabolites could be stably measured using different approaches (figure 3A,B, table 1).
Supplemental material
Metabolites of the GMSM panel and their serum abundances and variances (CV% in the C-pool) in untargeted and targeted metabolomic analysis

A panel of gut microbiome-associated serum metabolites could predict colorectal abnormality. (A) Diagram showing the process for metabolites selection involved in the GMSM panel. Among the 885 metabolites significantly altered in abnormal colorectal patients in the discovery cohort, 322 metabolites were associated with the gut microbiome. The LASSO algorithm was further used to select key metabolites, and 32 metabolites appeared more than 75% of the time among 200 LASSO runs. Their feasibility for targeted MRM analysis was evaluated, and targeted metabolic detection was carried out in the discovery cohort. Finally, 8 metabolites showed consistent variances in targeted and untargeted metabolomic analysis in the same cohort. These metabolites were selected as the GMSM panel for further model construction. (B) Mirror plots showing the experimental MS2 spectrums of the inferred metabolites and the MS2 spectrum of related metabolites derived from a public database. Left panel: (Z) −5,8,11-trihydroxyoctadec-9- enoic acid (X14.3_329.233mz neg); right panel: (E) −2-(4,8-dimethylnona-3,7-dien-1-yl) −5-hydroxy-2,7-dimethyl-2H-chromene-8-carbaldehyde (X27.8_353.212mz_neg). (C) ROC curveof the GMSM panel for the discrimination between the normal individuals and abnormal colorectal patients based on untargeted metabolomics detection in the discovery cohort. (D) PCA plot showing the discrimination between the normal and colorectal abnormal individuals by the GMSM panel based on untargeted metabolomics detection in the discovery cohort. € ROC curve of the CRC GMSM panel for the discrimination between the normal individuals and abnormal colorectal patients based on targeted metabolomics detection in the discovery cohort. (F) PCA plot showing the discrimination between the normal individuals and abnormal colorectal patients by the GMSM panel based on targeted metabolomics detection in the discovery cohort. (G) ROC curve of the CRC GMSM panel for the discrimination between the normal individuals and abnormal colorectal patients based on untargeted metabolomics detection in the serum and faeces matched cohort. (H) PCA plot showing the discrimination between the normal individuals and abnormal colorectal patients by the GMSM panel based on untargeted metabolomics detection in the serum and faeces matched cohort. The GMSM panel could also accurately discriminate the normal individuals (blue spots) and the abnormal colorectal patients from two independent sources (green spots indicate patients from CICAMS; red spots indicate patients from SD). CICAMS, Cancer Institute, Chinese Academy of Medical Sciences; CRC, colorectal cancer; GMSM, gut microbiome-associated serum metabolites; MRM, multiple reaction monitoring; PCA, principal component analysis; ROC, receiver operating characteristic.
Next, we evaluated the predictive accuracy of this metabolite panel in distinguishing the normal individuals and abnormal colorectal patients in the discovery cohort. Based on the relative abundances detected by untargeted metabolomic profiling, the normal individuals and abnormal colorectal patients in the discovery cohort could be accurately distinguished, reaching an area under the curve (AUC) of 0.95 (95% CI 0.85 to 1.00) (figure 3C).
Next, eight precursor and product ion pairs were identified from the annotated metabolites (details available in Online supplemental methods). They corresponded to those eight metabolites selected for the model in the untargeted metabolomic profiling described above (figure 3C). A model based on the eight ion-pair panels was trained within the same individual cohort described above to determine if these ion pairs can distinguish colorectal adenoma (CRA)/CRC from the normal individuals in the targeted metabolomic analysis. The results showed that the targeted metabolomic panel achieved an AUC of 0.95 (95% CI 0.85 to 1.00) (figure 3E), similar to that obtained in the untargeted metabolomic analysis. PCA plot showed a clear separation between the normal individuals and abnormal colorectal patients using untargeted and targeted metabolomic analysis (figure 3D,F).
Additionally, the eight metabolites also demonstrated significant accuracy in distinguishing adenomas/CRC from normal individuals in the serum and faeces matched cohort, with an AUC of 0.96 (95% CI 0.84 to 1.00) (figure 3G). The abnormal colorectal patients from two centres, Cancer Institute, Chinese Academy of Medical Sciences (green spots) and Shandong province (SD) (red spots), were clustered in the PCA plot and were unambiguously separated from the normal individuals (blue spots) (figure 3H). As a result, a panel consisting of eight GMSM was discovered, termed the GMSM panel, which has the potential to detect the colorectal abnormality.
A prediction model based on the GMSM panel showed promising results for the detection of patients with adenoma and CRC in the validation cohort
Based on the panel of metabolites identified in the discovery cohort, 192 individuals were recruited in the modelling cohort, including 72 normal individuals and 120 abnormal colorectal patients (online supplemental table S1), and the targeted multiple reaction monitoring method was used to measure the relative abundances of the 8 GMSM metabolites. A prediction model was generated using a logic regression method and reached an AUC of 0.98 (95% CI 0.94 to 1.00) in the modelling cohort (figure 4A). To achieve the highest accuracy, the cut-off of the biomarker score was set at 0.438 (figure 4B), leading to a sensitivity of 96.7% and specificity of 90.3% in the modelling cohort.

The prediction model based on the CRC GMSM panel showed a good diagnostic value for patients with adenoma, as well as for early-stage and late-stage CRC patients. (A) ROC curve of the prediction model based on the GMSM panel in the modelling cohort, with an AUC of 0.98 (95% CI 0.94 to 1), and the sensitivity and specificity were 94.2% and 92.5%, respectively. (B) The distribution of scores of the CRC and adenoma biomarker signature of the normal individuals and abnormal colorectal patients in the modelling cohort. To achieve high accuracy, the diagnostic cut-off of the CRC and adenoma biomarker signature score was set at 0.438. (C) ROC curve showing the discrimination accuracy of the CRC GMSM model in the validation cohort under the cut-off score of 0.438 (AUC=0.92, sensitivity 83.5%, specificity 84.9%). The position of the cut-off value on the ROC curve is labelled. (D) ROC curve showing discrimination accuracy of the CRC GMSM model for adenoma (AUC=0.84, sensitivity 63.2%, specificity 84.9%), stage I and II CRC (AUC=0.93, sensitivity 88.2%, specificity 84.9%) and stage III/IV CRC (AUC=0.91, sensitivity 84.2%, specificity 84.9%) in the validation cohort. Positions of the cut-off value on the ROC curves for different stages are labelled. AUC, area under the curve; CRC, colorectal cancer; GMSM, gut microbiome-associated serum metabolites.
Next, we evaluated the performance of the GMSM model in an independent validation cohort consisting of 103 abnormal colorectal patients and 53 normal individuals (online supplemental table S1). Our GMSM model reached an AUC of 0.92, with a sensitivity of 83.5% and specificity of 84.9% in this independent validation cohort (figure 4C). We also separately examined the stage-specific performance of this model for the adenoma to late-stage cancer of the abnormal colorectal patients in the validation cohort. Our model distinguished the patients with adenoma from the normal healthy individuals with an AUC of 0.84. For the early-stage/mid-stage (stage I/II) patients with CRC, the AUC was 0.93, while for the late-stage (stage III/ IV) patients with CRC, the AUC reached 0.91 (figure 4D). Using the previously established cut-off for the highest accuracy, the sensitivity for colorectal adenoma and the early/mid-stage CRC (stage I/II) achieved 63.2% and 88.2%, respectively, while the specificity for colorectal adenoma and the early/mid-stage CRC was 84.9%. Our data implicate the promising potential of the GMSM model for the early detection of CRC.
The GMSM model is superior to the clinical biomarker CEA and FOBT in the detection of colorectal abnormality
To compare the efficiencies of the clinically used marker CEA and our GMSM model to detect CRC and adenoma, we assessed their performances in the validation cohort, and the serum CEA levels of all the individuals in this validation cohort were recorded. Using CEA at the clinically used cut-off value of 5 U/mL to detect colorectal abnormality lead to an AUC of 0.72 with a sensitivity of 35.8% and specificity of 86.4%. In contrast, our GMSM model reached an AUC of 0.92 (sensitivity=83.5%, specificity=84.9%), which was much higher than that of CEA (figure 5A,B).

Comparing performances of the CRC GMSM model and the CEA biomarker. (A) ROC curve showing the discrimination accuracy of CEA (red line, AUC=0.72; sensitivity 35.8%, specificity 86.4% using clinical cut-off, labelled by the purple point) and the CRC GMSM model (blue line, AUC=0.92, sensitivity 83.5%, specificity 84.9% under the cut-off score of 0.438, labelled by the blue point) in the validation cohort. (B) Scatter plot for the graphical comparison of the GMSM model (red dashed line) and CEA (clinical cut-off, blue dashed line) accuracy in discriminating the normal individuals (green spots) and abnormal colorectal patients (red spots) in the validation cohort. With a similar level of specificity, the sensitivity of our GMSM model is greatly superior to that of the CEA marker. CEA, carcinoembryonic antigen; CRC, colorectal cancer; GMSM, gut microbiome-associated serum metabolites; ROC, receiver operating characteristic.
Additionally, we also compared our GMSM model with the FOBT/FIT analysis currently used for CRC screening. For this, we analysed the medical records of patients with CRC and found 89 patients who had undergone the FOBT/FIT test. Among these patients, 58 patients were positive for FOBT/FIT test, and 31 patients had a negative FOBT/FIT result, leading to a sensitivity of 65.2%, comparable with previous reports.41 42 These results indicate that our GMSM model is better than the FOBT/FIT test in detecting CRC.
Discussion
Metabolic profiling is emerging as an efficient approach for the detection of different tumours.25 43 44 In this study, we used metabolomic analysis to develop a CRC and adenoma detection model. Our model exhibited a higher accuracy than the clinically used biomarker CEA and a recently reported plasma biomarker panel that used a series of protein markers and cfDNA hotspot mutations.45 Our results suggest that our GMSM panel could be a promising approach for non-invasive CRC and adenoma detection.
Compared with previously reported serum-based metabolite panels, which only compared the serum metabolome between normal and CRC individuals, our GMSM panel consists of signature metabolites which should be outcomes of the CRC-related alterations of the gut microbiome. Mathematical modelling attributes 70%–90% of cancer risk to environmental factors,46 and the gut microbiome has been proposed as the main environmental factor in the large intestine. Recently emerging evidence has unveiled that the gut microbiome might induce tumourigenesis and CRC progression via different mechanisms.8 12 13 15 Although the exact reason underlying CRC initiation is unclear, for a single microorganism or community to be considered oncogenic, they must elicit carcinogenic effects, such as causing DNA damage. In our study, we observed an elevation in the ETBF in patients with CRC (ETBF, figure 2B, highlighted in red). Purified B. fragilis toxin upregulates SMO in HT29/c1 and T84 colonic epithelial cells, resulting in SMO-dependent generation of reactive oxygen species (ROS) and induction of DNA damage.47 Additionally, several products of bacterial metabolism have also been implicated in CRC, such as secondary bile acids. In our study, the serum concentrations of unconjugated CA and DCA were upregulated in abnormal colorectal patients (online supplemental figure S2B). Furthermore, correlation analysis revealed the association between a series of gut microbiome species with these bile acids (online supplemental figure S2D). Bile acids contribute to carcinogenesis in different regions of the intestinal tract through the generation of ROS and reactive nitrogen species, both of which cause DNA damage.48 Thus, by focusing on GMSM, we could acquire a tumour detection panel that is more specific to colon cancer. Our GMSM panel could achieve a sensitivity of 83.5% and specificity of 84.9% in the independent validation cohort, which is higher than the other serum panels.25 28
Additionally, for the detection of CRC, faecal sample-based researches have been widely studied. While our work underwent reviewing, an independent study based on 16S sequencing of faecal samples further reported that individuals with colorectal adenoma could be discriminated from normal individuals based on 11 microbial markers, with an AUC of 0.80.49 Attempts have been made to uncover stage-specific gut microbiome and metabolite features from colorectal adenoma and early/late CRC by combining metabolomic and metagenomic analysis directly from faecal samples.10 Furthermore, metabolites in blood have been reported to be associated with the gut microbiome in a variety of physiological or pathological conditions.22 23 34 Nevertheless, blood metabolites associated with the gut microbiome in patients with CRC had never been studied before. Although algorithms to uncover the association between the activities of specific strains in the gut microbiome and metabolites that reached an equilibrium in the blood remain under active development, Pearson correlation, Spearman correlation as well as the microbe–metabolite vectors (MMVEC) neural network or Bayesian probability-based modelling approaches have been widely applied in relevant studies.10 50–52 Various algorithms may reveal different aspects of complex interactions between the gut microbiome and metabolites due to differences in their statistical assumptions. Nevertheless, many approaches, including Spearman and the MMVEC, are able to uncover similar findings for gut microbiome-associated metabolites in inflammatory bowel disease cohorts.51 52 Hence, we used correlation analysis to unveil blood metabolites potentially associated with activities derived from and/or affected by the gut microbiome.
Our approach identified a series of metabolites associated with gut microbiome species, including such as F. nucleatum and B. longum, which have been experimentally shown to promote and suppress CRC progression, respectively. Two experiments were done to further assess the association between the gut microbiome and serum metabolites identified in this study. First, an examination of the associations between CA or DCA and the gut microbiome revealed that the concentrations of CA and DCA highly correlated with species that have bile acid catalytic activities (online supplemental figure S2D). Second, specific metabolites altered in both the serum and tumour tissues of the patients with CRC, such as the microbial metabolite N,O-Bis-(trimethylsilyl)phenylalanine, were increased in both serum and colorectal abnormal tissues. The positive association between these metabolites and bacteria species, including C. bacterium VE202-01 and E. ramosum, suggests potential tumourigenesis-associated microbiome reprogramming, which could be monitored by the serum levels of these metabolites. In agreement with our findings, Dr. Clevers’ group reported that pks+Escherichia coli induces a CRC mutational signature via colibactin in human intestinal organoids, which underlies potential mechanism mediated by gut-associated serum metabolites in tumourigenesis and progression of CRC.15 Thus, our findings support the theory that gut microbiome-associated metabolites in serum harbour promising potential in detecting CRC.
It should be noted that certain shortcomings exist in our study. A larger number of adenomas, particularly advanced adenomas and early-stage CRCs, are needed to confirm the implication that our approach can be applied to cancer early detection. Nonetheless, by integrating the analysis of faecal metagenome and serum metabolomes in normal and CRC populations, we discovered an association between colorectal abnormality and serum metabolic profiles. We established a metabolite-based prediction model with high accuracy for the detection of CRC.
Data availability statement
Readers can now access the original datasets of untargeted metabolomics at National Population Health Data Center and Population health Data Archive (https://www.ncmi.cn/phda/dataDetails.html?type=project_data&id=CSTR:17970.11.A001M.202105.612.V1.0).
Ethics statements
Patient consent for publication
Ethics approval
Ethical approval was obtained from the Independent Ethics Committee of National Cancer Center/Cancer Hospital, Chinese Academy of Medical Science, and Peking Union Medical College (approval no. 18-218/1796).
Acknowledgments
We would like to thank Dr. Jiuming He and Jin Zhang for assistance with the AMSI detection. We would also thank Dr. Li Lin, Caili Zhang and Qiufeng He for providing clinical support and sampling in AMSI.
References
Supplementary materials
Supplementary Data
This web only file has been produced by the BMJ Publishing Group from an electronic file supplied by the author(s) and has not been edited for content.
Supplementary Data
This web only file has been produced by the BMJ Publishing Group from an electronic file supplied by the author(s) and has not been edited for content.
Footnotes
FC and XD contributed equally.
Correction notice This article has been corrected since it published Online First. The data availability statement has been updated.
Contributors All authors contributed to this article through each of the following: (1) conception and design, analysis and interpretation of data; (2) drafting the article and revising it critically for important intellectual content; (3) giving final approval for the version to be published and (4) agreement to be accountable for all aspects of the work in ensuring that questions related to the accuracy or integrity of any part of the work are appropriately investigated and resolved.
Funding This study was supported by the CAMS Innovation Fund for Medical Sciences (CIFMS) (grant no. 2017-I2M-3-005 and No. 2019-I2M-2-002).
Competing interests X-DD is the cofounder of Precogify Pharmaceutical. All other authors declare no conflicts of interest or competing financial interests with respect to this manuscript.
Provenance and peer review Not commissioned; externally peer reviewed.
Supplemental material This content has been supplied by the author(s). It has not been vetted by BMJ Publishing Group Limited (BMJ) and may not have been peer-reviewed. Any opinions or recommendations discussed are solely those of the author(s) and are not endorsed by BMJ. BMJ disclaims all liability and responsibility arising from any reliance placed on the content. Where the content includes any translated material, BMJ does not warrant the accuracy and reliability of the translations (including but not limited to local regulations, clinical guidelines, terminology, drug names and drug dosages), and is not responsible for any error and/or omissions arising from translation and adaptation or otherwise.