Article Text

Abstract
Objective Circulating tumour DNA (ctDNA) sequencing is increasingly used in the clinical management of patients with colorectal cancer. However, the genomic heterogeneity in ctDNA during treatments and its impact on clinical outcomes remain largely unknown.
Design We conducted a prospective cohort study (NCT04228614) of 171 patients with unresectable metastatic colorectal cancer (mCRC) who underwent first-line treatment and prospectively collected blood samples with or without tumour samples from patients at baseline and sequentially until disease progression or last follow-up.
Results The RAS/BRAF alterations in paired baseline tissue and plasma samples from 63 patients displayed a favourable concordance (81.0%, 51/63). After a period of first-line treatment (median time between baseline and last liquid biopsy, 4.67 months), 42.6% (26/61) of RAS-mutant patients showed RAS clearance and 50.0% (5/10) of BRAF-mutant patients showed BRAF clearance, while 3.6% (3/84) and 0.7% (1/135) of patients showed new RAS or BRAF mutations in ctDNA. Patients with plasma RAS/BRAF clearance showed similar progression-free survival (PFS) and overall survival (OS) with patients who remained RAS/BRAF wild-type, while much better outcomes than those who remained RAS/BRAF mutant. Patients who gained new RAS/BRAF mutations showed similar prognosis as those who maintained RAS/BRAF mutations, and shorter PFS and OS than those who remained RAS/BRAF wild-type.
Conclusion This prospective, serial and large-scale ctDNA profiling study reveals the temporal heterogeneity of mCRC-related somatic variants, which should be given special attention in clinical practice, as evidenced by the finding that the shift in plasma RAS/BRAF mutational status can yield a drastic change in survival outcomes.
- colorectal carcinoma
- cancer genetics
- colorectal cancer genes
Data availability statement
Data are available upon reasonable request.
This is an open access article distributed in accordance with the Creative Commons Attribution Non Commercial (CC BY-NC 4.0) license, which permits others to distribute, remix, adapt, build upon this work non-commercially, and license their derivative works on different terms, provided the original work is properly cited, appropriate credit is given, any changes made indicated, and the use is non-commercial. See: http://creativecommons.org/licenses/by-nc/4.0/.
Statistics from Altmetric.com
Significance of this study
What is already known about this subject?
The treatment strategies of metastatic colorectal cancer (mCRC) develop as the molecular diagnostics improve, and the failure of first and later lines of therapy may be caused by the molecular heterogeneity within patients over time.
Plasma RAS mutation clearance in mCRC is increasingly used as a biomarker for selecting patients eligible for anti-EGFR rechallenge.
Further exploration of the temporal heterogeneity of mCRC-related somatic variants in circulating tumour DNA (ctDNA) is needed.
What are the new findings?
After a period of first-line treatment, plasma RAS and BRAF clearance rates are 42.6% and 50.0%, respectively, while RAS and BRAF acquisition rates are 3.6% and 0.7% in ctDNA.
The shift in plasma RAS or BRAF mutational status correlates with the drastic change in survival outcomes.
ERBB2 amplification, NTRK fusion and other actionable targets for clinical trials, including KRASG12C, BRAFnonV600E, PTEN, NF1, MTOR, MET, CDK12, CDKN2A, FGFR1/2/3, remain consistent over time in most patients.
How might it impact on clinical practice in the foreseeable future?
This prospective, serial and large-scale ctDNA profiling study reveals the genomic temporal dynamics and heterogeneity of mCRC and provides solid evidence and insights to support the use of ctDNA sequencing in capturing the dynamic somatic mutational spectrum and predicting the prognosis of patients with mCRC.
Introduction
Colorectal cancer (CRC) is the second leading cause of cancer-related death worldwide, and its incidence rates are increasing in many countries.1 2 Along with the progress of drug development, chemotherapy, targeted agents (ie, anti-epidermal growth factor receptor (EGFR) and anti-vascular endothelial growth factor (VEGF) therapy) and immune checkpoint inhibitors have largely reshaped the treatment of metastatic CRC (mCRC), which requires the precise stratification of patients according to their molecular features.3–5
In recent years, the rapid development of next-generation sequencing (NGS) technology has made it feasible for clinical application. The detection of actionable or prognostic somatic variants by NGS is important for guiding treatment decision-making for CRC.6 For instance, somatic RAS mutation is an indicator of primary resistance to anti-EGFR therapy and predicts poor survival outcomes.7 Somatic BRAFV600E mutation is also a poor prognostic factor and the approved indication for triplet combination therapy (BRAF inhibitor, MEK inhibitor and anti-EGFR monoclonal antibody).8 Although the treatment strategies of mCRC develop as the molecular diagnostics improve, the resistance to first and later lines of therapy are caused by the molecular heterogeneity within patients over time.9 10
The main obstacles to answering these questions are the unfeasibility of repeated tissue biopsy and the spatial and temporal heterogeneity of tumour tissue.11 12 Liquid biopsy allows the examination of circulating tumour DNA (ctDNA), which is released into the bloodstream due to the breakdown of tumour cells.13 After much research, liquid biopsy can now be applied in clinical practice.14 15 The US Food and Drug Administration recently approved Guardant360 CDx, an NGS liquid biopsy panel, as the first liquid biopsy NGS companion diagnostic test for metastatic non-small-cell lung cancer.16 This marks a new era for mutation testing using liquid biopsy.
Emerging studies have shown that ctDNA analysis has the potential to be applied in the whole-course management of patients with CRC, including early diagnosis, minimal residual disease assessment, actionable target detection and treatment response monitoring in metastatic settings.14 17 For instance, we recently reported that ctDNA methylation profiles could be used in CRC screening.18 Several groups have also provided evidence supporting that ctDNA could reflect the existence of minimal residual disease postoperatively.19–21 Moreover, the serial ctDNA testing may help monitor treatment efficacy, with the early change in ctDNA serving as a marker of clinical response.22 23 And ctDNA could track RAS clones to monitor drug resistance or the potential to receive anti-EGFR rechallenge.24 However, studies on the evolution of somatic mutations of CRC in ctDNA under systemic therapy and its clinical significance are still lacking.
We conducted a prospective and observational study by enrolling patients with systemic therapy-naïve mCRC and employing serial ctDNA testing to monitor the temporal heterogeneity of somatic variants during first-line treatment and to investigate the potential correlations with clinical outcomes.
Results
Patient characteristics at baseline
The study flow chart is presented in figure 1. In total, 171 patients with unresectable mCRC were enrolled. The clinical characteristics of the patients at baseline are listed in online supplemental table S1. Baseline RAS and BRAFV600E mutations were detected in ctDNA from 74 (43.3%) and 11 (6.4%) patients, respectively. For first-line treatment, 94 (55.0%) patients received chemotherapy plus bevacizumab, 51 (29.8%) patients received chemotherapy only, 25 (14.6%) patients received chemotherapy plus cetuximab and only 1 (0.6%) patient with confirmed high microsatellite instability status received immunotherapy. A strong correlation between the site of metastasis and baseline ctDNA levels was observed (online supplemental figure S1). The median maximum variant allele frequency (VAF) (maximum somatic allele frequency (MSAF)) was significantly higher in patients who had only liver (29.6%; IQR, 12.4%–48.1%) or lymph node (41.6%; IQR, 20.3%–56.1%) metastasis site, compared with those who had only lung (1.2%; IQR, 0%–4.7%) or non-liver-lung (1.1%; IQR, 0.7%–2.1%) metastasis site.
Supplemental material

Flowchart of study design and patient selection. ctDNA, circulating tumour DNA; mCRC, metastatic colorectal cancer; NED, no evidence of disease; WES, whole-exome sequencing.
Mutational concordance in paired baseline plasma and tissue
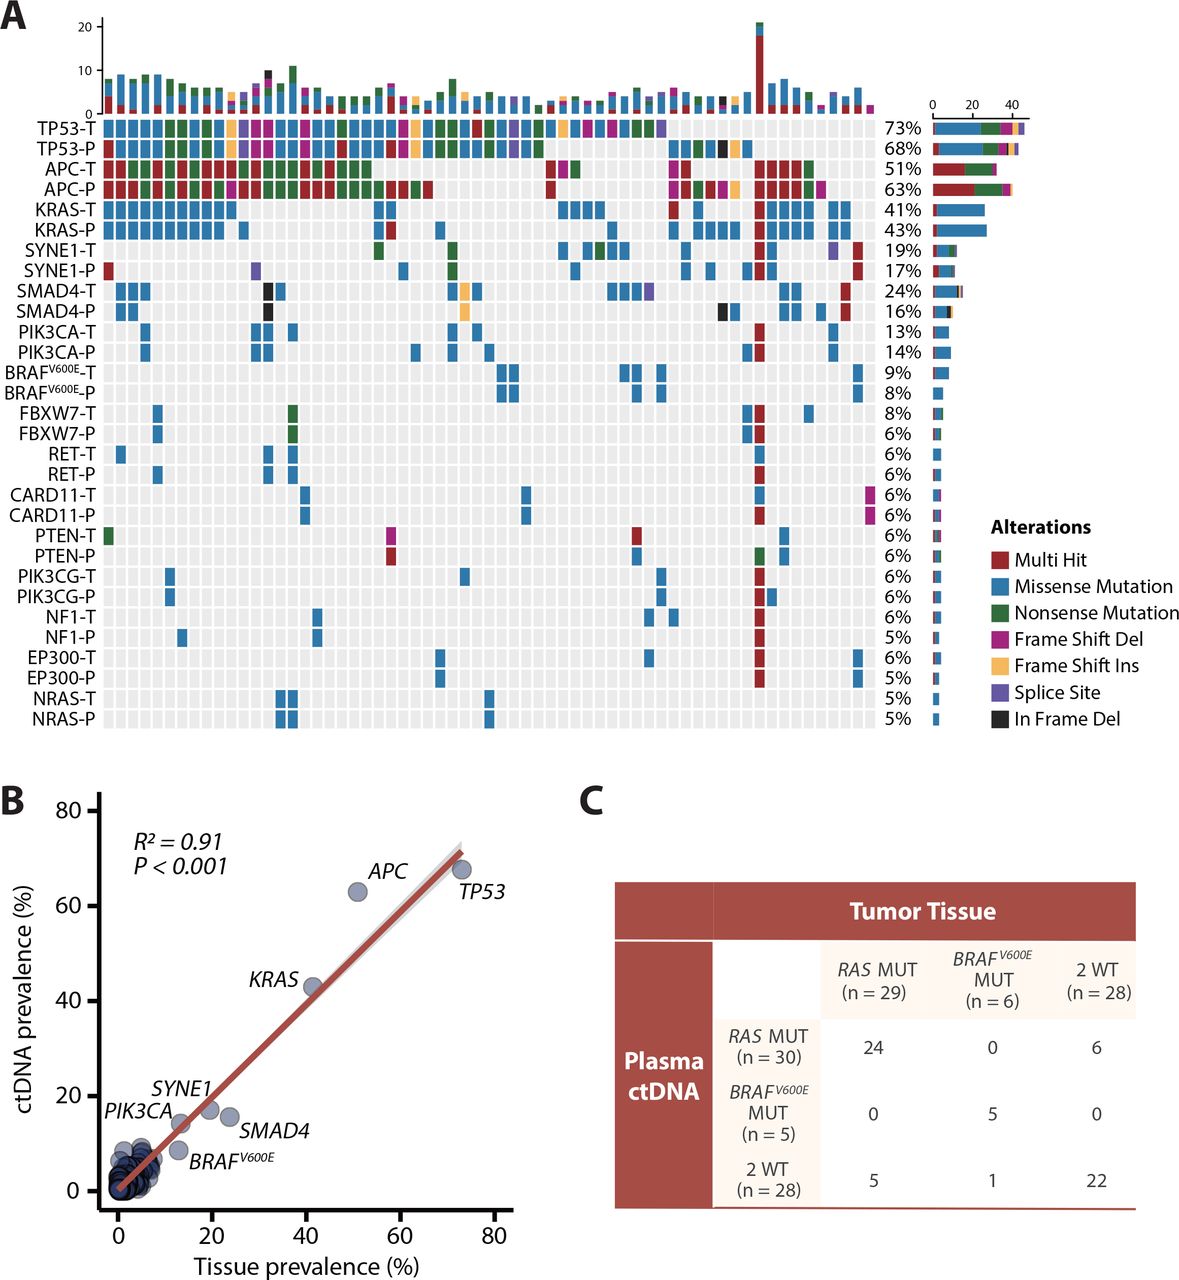
Among 63 patients with paired baseline plasma and tissue samples, we compared the consistency of somatic variants (nonsynonymous single-nucleotide variants (SNVs) and indels) between ctDNA samples (detected by NGS) and corresponding tissue samples (whole-exome sequencing, WES) (figure 2A; online supplemental table S2). Further analysis indicated that the prevalence of SNVs/indels among the 378 tumor-related genes (online supplemental table S3) included in the NGS panel of ctDNA was positively correlated with that observed in tumour tissues at baseline (R2=0.91; p<0.001; figure 2B). The RAS mutation rate was 46.0% in tumour tissue (n = 29) and 47.6% in ctDNA (n = 30), and the BRAFV600E mutation rate was 9.5% in tumour tissue (n = 6) and 7.9% in ctDNA (n = 5). Hence, the overall agreement of RAS/BRAFV600E status between plasma and tissue was 81.0% (51/63), with 17.5% (11/63) and 1.5% (1/63) disagreement in RAS and BRAFV600E status, respectively (figure 2C). Furthermore, among the patients with only liver metastasis, RAS concordance rate was 90.0% (18/20). And the RAS concordance rate was 79.1% (34/43) in the patients with extrahepatic lesions (online supplemental figure S2). These data displayed favourable gene-level concordance between tumour tissue samples and ctDNA samples but showed some discordance in RAS and BRAFV600E mutations.

Concordance analysis of baseline mutations in paired plasma and tumour tissue samples among 63 patients. (A) Genomic profiling of some high-frequency mutations between baseline tissue samples and plasma samples (nonsynonymous single-nucleotide variants and indels). The top bar represents the number of mutations a patient carried; the side bar represents the number of patients who carried a certain mutation. (B) Correlation analysis between mutation frequencies of 378 genes from the NGS panel in circulating tumour DNA (ctDNA) samples versus tissue samples (Spearman’s rank correlation). (C) Comparison of RAS and BRAFV600E mutations in tissue samples and plasma samples. MUT, mutant; P, plasma; T, tissue; WT, wild type.
Genomic evolution in plasma ctDNA under first-line treatment
To investigate genomic evolution under first-line treatment, we collected serial plasma samples and referred to the Oncology Knowledge Base (OncoKB), which offers evidence-based therapeutic implications of cancer alterations, and generated a picture of actionable targets in CRC (figure 3A). Among the cohort of 145 patients with sequential plasma samples before progressive disease (PD), the median time from baseline ctDNA collection to the last liquid biopsy sample collection before PD was 4.67 months (range, 1.40–14.50 months; figure 3B).

Genomic temporal heterogeneity in plasma circulating tumour DNA under first-line treatment among 145 patients. (A) Evidence-based actionable targets in colorectal cancer (CRC) referring to the Oncology Knowledge Base database. The outer ring represents the different levels of evidence for the actionable targets, and the inner part represents the different treatments according to the corresponding targets. (B) Time from baseline plasma sample collection to the last liquid biopsy before progressive disease (PD). (C) Genomic profiling of the most commonly mutated genes and actionable targets in CRC between baseline and post-chemotherapy (postCT) plasma samples. The top bar represents the number of mutations a patient carried; the side bar represents the number of patients who carried a certain mutation; and the bottom bar represents patient characteristics, including age, sex, smoking history, tumour location, metastatic site at baseline, best response and first-line chemotherapy regimen. (D) The clearance and acquisition rates of standard-of-care targets and top mutant genes after treatment. (E) The shift of actionable targets for clinical trials after treatment. amp, amplification; BL, baseline; CR, complete response; MSI, microsatellite instability; NE, not evaluable; PR, partial response; SD, stable disease; TMB, tumour mutation burden.
A comprehensive comparison of the top mutant genes and CRC-related actionable variants between baseline and last liquid biopsy before PD showed the overall decline in mutation frequencies in most genes after a period of treatment (figure 3C). For standard-of-care (SOC) targets, 42.6% (26/61) of patients with RAS mutations showed RAS mutation clearance and 5 of them (5/61, 8.2%) showed RAS clearance with detectable ctDNA. 50.0% (5/10) of patients with BRAF mutations showed BRAF mutation clearance, while 3.6% (3/84) and 0.7% (1/135) of patients showed new RAS or BRAF mutations, respectively (figure 3D). Of note, the alterations in RAS status during first-line treatment were fairly stable in our cohort (online supplemental figure S3), suggesting that the dynamic genetic change was a steady event for individual patients. In addition, one of three patients lost ERBB2 amplification after treatment, while none of the patients acquired new ERBB2 amplification. Unlike SOC targets, actionable variants for clinical trials, including KRASG12C, BRAFnonV600E, PTEN, NF1, MTOR, CDK12, CDKN2A, FGFR1/FGFR2/FGFR3 alterations, changed in 12.4% (18/145) of patients but remained consistent over time in most (127/145, 87.6%) patients (figure 3E). No NTRK fusions were detected at baseline or after treatment.
Clinical outcomes according to shift in plasma RAS and BRAFV600E
To further evaluate the importance of RAS and BRAF mutations in reflecting prognosis, we analysed the association between the dynamic changes in RAS and BRAF status shown in figure 3D and clinical outcomes.
Of note, in our cohort, ctDNA levels were positively correlated with tumour burden during first-line treatment (online supplemental figure S4A, B). Furthermore, the median ctDNA level was 14.0% (IQR, 2.0%–47.4%) at baseline, which was significantly higher than that of 0.5% (IQR, 0%–4.0%) at last biopsies before PD among 145 patients (p<0.001, online supplemental figure S4C), revealing a significant decline in ctDNA levels after a period of treatment. So, changes in ctDNA levels were adjusted when survival analyses were performed.
The median progression-free survival (mPFS) of patients with RAS or BRAF clearance were 12.8 months (95% CI 10.2 to not reached (NR)) and NR (95% CI 18.9 to NR), respectively, which were similar to the mPFS of 13.2 months (95% CI 10.8 to 16.4; p=0.980) and 11.5 months (95% CI 10.4 to 13.3; p=0.196) in patients who remained free of RAS or BRAF mutation but were significantly better than the mPFS of patients who remained RAS mutant (7.9 months; 95% CI 5.1 to 10.9; p=0.002) or BRAF mutant (6.4 months; 95% CI 3.2 to NR; p=0.002; figure 4A, table 1). Similarly, patients with RAS or BRAF clearance showed a similar median overall survival (mOS) versus patients who remained RAS wild-type (NR (95% CI 22.7 to NR) versus 31.4 (95% CI 26.0 to NR); p=0.906) or BRAF wild-type (NR (95% CI 20.8 to NR) versus 26.7 months (95% CI 22.7 to NR); p=0.869), whereas patients who maintained RAS or BRAF mutations had a shorter mOS of 14.5 months (95% CI 12.7 to NR; p=0.006) and 11.4 months (95% CI 5.6 to NR; p=0.022), respectively (figure 4B, table 1).

Kaplan-Meier estimates of progression-free survival (PFS) (A) and overall survival (OS) (B) in patients stratified according to different changes in plasma RAS status under first-line treatment Statistical significance was determined by Wald test of the multivariable Cox models. The change in the circulating tumour DNA (ctDNA) fraction of cfDNA, estimated by maximum somatic allele frequency, was included as a variable. mPFS, median progression-free survival; mOS, median overall survival; MUT, mutant; ref, reference; WT, wild-type.
Estimates of progression-free survival (PFS) and overall survival (OS) in patients with different changes in BRAFV600E under first-line treatment
In contrast, the mPFS in patients with new RAS or BRAF mutations was 6.1 months (95% CI 2.2 to NR) and 8.7 months (95% CI NR to NR), respectively, which were similar to the mPFS of patients who maintained RAS or BRAF mutations (7.9 months, p=0.350; 6.4 months, p=0.774) and were numerically shorter than the mPFS of patients who remained RAS or BRAF wild-type (13.2 months, p=0.014; 11.5 months, p=0.179; figure 4A, table 1). There were no differences in the mOS of patients with RAS or BRAF acquisition (15.0 months (95% CI 11.3 to NR); NR (95% CI NR to NR)) compared with those who remained RAS or BRAF mutations (14.5 months, p=0.262; 11.4 months, p=0.996). However, patients who acquired RAS mutations showed a shorter mOS than those who remained RAS wild-type (31.4 months, p=0.003; figure 4B).
Genomic evolution in plasma ctDNA after disease progression
Faced with second-line clinical decisions, we tracked the clinical variant dynamics of mCRC in 20 patients from whom plasma samples were obtained after PD (median time interval since baseline, 6.57 months; range, 1.07–12.20 months) following first-line therapies (figure 5A). For SOC targets, 44.4% (4/9) of patients with RAS mutations showed RAS clearance, and none of the patients showed BRAF clearance, while 27.3% (3/11) and 5.3% (1/19) of patients showed new RAS or BRAF mutations, respectively. ERBB2 remained wild-type in all 20 patients after PD (figure 5B). Moreover, for clinical-trial variants, only 1 patient obtained a new NF1 mutation, whereas 95.0% (19/20) of patients exhibited no changes over time (figure 5C).

Genomic temporal heterogeneity under a period of first-line regimen after progressive disease among 20 patients. (A) Genomic profiling of the top mutant genes and actionable targets in colorectal cancer between baseline and progressive disease plasma samples. The top bar represents the number of mutations a patient carried; the side bar represents the number of patients who carried a certain mutation; and the bottom bar represents patient characteristics, including age, sex, smoking history, tumour location, metastatic site at baseline, best response and first-line chemotherapy regimen. (B) The prevalence of clearance and acquisition of standard-of-care targets and the top mutant genes after progression. (C) The shift of actionable targets for clinical trials after progression. CR, complete response; PD, progressive disease; PR, partial response; SD, stable disease.
Meanwhile, ctDNA levels at best response (median MSAF, 0.1%; IQR, 0%–1.0%) during treatment were significantly lower than that at the baseline (median MSAF, 8.5%; IQR, 2.7%–55.9%; p<0.001) and the disease progression (median MSAF, 10.4%; IQR, 0.7%–27.9%; p=0.002). The ctDNA levels decreased in patients with partial response or stable disease and increased when PD was observed, allowing the use of ctDNA detection in response evaluation (online supplemental figure S5).
Furthermore, to identify potential mechanisms of resistance to EGFR antibody (EGFR-Ab) treatment, we analysed the genetic changes between baseline and PD plasma samples of six patients who received EGFR-Abs as a first-line regimen (online supplemental figure S6). Compared with baseline samples, PD samples from four patients exhibited the most peculiar genetic alterations in genes involved in the RTK-RAS pathway and PI3K pathway, including mutations of RAS, BRAF, ALK, HGF, NF1, and PIK3CG and amplification of MET. We also detected the acquisition of several genetic alterations that likely confer EGFR-Ab resistance, as described in recent studies,25–28 such as mutations of ATM, SMAD2 and CCNE1 amplification. GATA2, a necessary transcription factor for RAS-mutant non-small-cell lung cancer cells,29 was detected in one patient at PD. New mutations in SYNE1, IKZF1 and TERT amplification were observed in patients who showed resistance to EGFR-Abs. Collectively, these results indicate that the mechanisms of anti-EGFR drug resistance might be complex and probably cannot be explained by the presence of a single genetic alteration. A larger cohort of patients is needed to verify these potential mechanisms.
Discussion
In the current study, we observed good concordance of somatic mutations detected by tumour tissue samples and matched plasma ctDNA samples, showing the reliability ctDNA in the detection of somatic variants during systemic therapy for mCRC. Strickler et al showed that ctDNA profiling of CRC can be used to detect somatic mutations at frequencies comparable to those observed by tumour sample sequencing in other independent cohorts.15 In this study, we provide more solid evidence to show that ctDNA profiling can be used as an alternative to tissue profiling and can accurately capture the somatic mutational spectrum of primary tumours. These results indicate that for patients with mCRC, ctDNA profiling could be a reliable option to gain insight into the somatic mutational landscape to guide treatment decision-making. Furthermore, repeated tissue biopsy for genomic profiling is impractical. Thus, subsequent treatment decision-making must rely on archival tumour tissues, which are unable to reflect the dynamic evolution of the primary tumour and metastatic lesions.30–32 The good concordance of tumour tissue sequencing and ctDNA profiling also indicates that the latter is reliable and can be used in dynamic and real-time testing during the clinical course of disease, especially when the patients face treatment failure and require further treatment.
Based on serial ctDNA profiling, we thoroughly analysed the temporal heterogeneity of CRC-related somatic variants under first-line systemic therapy until PD, depicting the landscape of somatic variant shifts, and their association with treatment outcomes and implications for clinical practice. Notably, during first-line therapy, a significant shift in the somatic mutation status of recurrently mutated genes in CRC was observed, supporting that dynamic and real-time ctDNA profiling are needed to capture the real somatic mutational spectrum when making treatment decisions, which would benefit patients more than a static view of this spectrum.11 12
Recently, clearance of plasma RAS mutations in mCRC was used as a biomarker for selecting patients eligible for anti-EGFR rechallenge, and this change occurs at a highly variable rate ranging from 2% to 45%.33–37 However, RAS reversion in mCRC before disease progression has rarely been investigated. In this study, we paid close attention to the reversion of genetic mutation status in ctDNA before PD, and our data showed a relatively high rate of RAS clearance before PD (42.6%, 26/61). Notably, taking presence of ctDNA into consideration, 34.4% of patients had complete ctDNA clearance and only 8.2% of patients showed RAS clearance with detectable ctDNA. In addition, the stability of the shift of RAS mutational status during treatment was observed by serial ctDNA testing (online supplemental figure S3); the evidence supported the existence of positive or negative selection of RAS-mutated clones rather than technical errors. In this aspect, more data are warranted to reflect the effects of RAS clearance, along with complete ctDNA clearance or not, on the future therapeutic implication, such as anti-EGFR rechallenge.
The most interesting and clinically relevant finding was that the shift of somatic mutational status of plasma RAS or BRAF genes was accompanied by a drastic change in clinical outcomes, with improved efficacy and survival in patients whose phenotype shifted from RAS/BRAF-mutant to wild-type. These observations indicated that the initial somatic mutational status may not always be reliable in prognostic stratification and treatment decision-making. Instead, subsequent and real-time mutational status may have greater impacts on treatment efficacy and patient survival. Nevertheless, the change in ctDNA fraction in cell-free DNA (cfDNA) was taken into consideration by calculating the MSAF when we investigated the impact of a shift in RAS/BRAF status on prognosis, which further supported the strong correlations between plasma RAS/BRAF dynamics and clinical outcomes.
Likewise, we observed significant changes in the somatic mutational landscape at the time of treatment failure of first-line systemic therapy. This could partially explain the reason for treatment failure and provide us with more information to determine the subsequent treatments. For example, in six patients treated with anti-EGFR therapy, new somatic alterations emerged after the failure of anti-EGFR therapy. Most of these alterations were involved in RTK-RAS and PI3K pathway, which could be the potential resistance mechanisms to EGFR therapy. However, more detailed verifications of these alterations are expected to reveal the acquired resistance mechanisms to EGFR therapy. Besides, changes in clinical targets, especially RAS and BRAF, also have implications for decision-making regarding subsequent lines of treatment. These results emphasise the importance of dynamic monitoring using ctDNA profiling, especially at the time of treatment failure, for determining the best treatment options.
Several limitations should be acknowledged in this study. First, the ctDNA/tumour RAS discordance rate was 17.5% at baseline. The most plausible cause of this discordance is that somatic mutations were not detected in baseline plasma samples of a small proportion of patients (16.4%), which is in consist with previous studies.15 38 39 The median MSAF of the RAS-concordant subgroup was significantly higher than that of the RAS-discordant subgroup (27.3% vs 1.5%), which supported this speculation to some extent. Besides, the ctDNA/tumour discordance level was reported to differ by metastatic sites.40 In our cohort, RAS concordance rate was 90.0% among patients with only liver metastasis, while the rate of patients with extrahepatic lesions was down to 79.1%. To increase the sensitivity for mutation detection in the ctDNA, further technical improvement in mutation detection is needed. Second, as the somatic mutational rate of BRAF is rather low, the actual number of patients who present with a shift in somatic mutational status is also not sufficient for statistical testing. Thus, the prognostic impact of the shift in BRAF somatic mutational status still warrants further confirmation, as well as its predictive implication for BRAF inhibitors. Third, although the PFS data are mature in the study, an extended long-term follow-up is needed to confirm the OS findings.
In conclusion, this prospective, observational and large-scale ctDNA profiling study provided further and solid evidence to support the use of ctDNA sequencing in capturing the dynamic somatic mutational spectrum of mCRCs. More importantly, we revealed the temporal heterogeneity of mCRC-related somatic variants by serial ctDNA profiling, which should be given special attention in clinical practice, as evidenced by the finding that the shift in plasma somatic mutational status of the RAS or BRAF genes was accompanied by a drastic change in survival outcomes.
Materials and methods
Patients and samples collection
A prospective cohort study (ClinicalTrials.gov identifier: NCT04228614) was designed and implemented in the Sun Yat-sen University Cancer Center (Guangzhou, China). A total of 171 patients with unresectable mCRC under first-line treatment between April 2018 and January 2020 were enrolled. Patient blood samples with or without primary tumour samples were sequentially collected at baseline and every 6–8 weeks with response evaluation until PD or last follow-up. Clinical response and tumour burden were evaluated by the investigators according to the Response Evaluation Criteria in Solid Tumours, V.1.1. The inclusion criteria for the patients were as follows: (1) the patients were diagnosed with mCRC by histopathology or cytology by qualified pathologists from Sun Yat-sen University Cancer Center; (2) the patient who had not received first-line treatment before baseline sample collection; and (3) the patients who had qualified baseline and serial plasma samples (at least 20 ng DNA yielded) or patients who had only baseline plasma samples but had paired qualified primary tumour tissue (at least 50 ng DNA yielded). The patients who received curative resection or ablation of the metastatic lesions during the first-line treatment and achieved no evidence of disease were excluded from the final analysis. All patients consented to an institutional review board-approved protocol for prospective tumour genomic profiling. This study was approved by the Institutional Review Board of Sun Yat-sen University Cancer Center and complied with the ethical standards of the institutional and/or national research committee and with the Declaration of Helsinki.
Patient and public involvement
It was not appropriate or possible to involve patients or the public in the design, or conduct, or reporting, or dissemination plans of our research.
DNA extraction, library construction and targeted sequencing
The details of DNA extraction, library construction and targeted sequencing, including NGS of cfDNA and WES of tissue tumour DNA, were described in the online supplemental methods.
Raw data processing and alignment
Raw sequencing data were preprocessed by fastp V.0.18.0; preprocessing included adaptor trimming, removal of the reads in which the N base reached a certain percentage (default length of 5 bp) and reads that contained low-quality bases (default quality threshold value ≤20) above a certain portion (default 40%), and sliding window trimming.41 Clean reads were aligned to the hg19 genome (GRCh37) using Burrows-Wheeler Aligner V.0.7.15–r1140 with the default settings.42 GenCore V.0.12.0 was used to remove duplicate reads.43 Samtools V.0.1.19 was applied to generate pileup files for properly paired reads with mapping quality ≥60.44
Mutation calling, filtering and annotation
After removing duplicate reads, the mean coverage depth was 1000× for the whole blood control samples, 250× for tumour tissues and 2000× for cfDNA samples. For ctDNA-NGS, SNVs and short insertions/deletions (indels) were identified by VarScan2 V.2.3.8; the minimum read depth was 200, and the VAF threshold was set to 0.1%.45 Somatic variants (SNVs or indels) presenting at least five unique reads, with at least one on each strand, and with a mutant allelic frequency less than 0.5% in the paired normal sample (peripheral blood lymphocytes) were retained. Additionally, we excluded any SNVs by background polishing using cfDNA samples from healthy subjects (online supplemental methods). A manual visual inspection step was applied to further remove artefacts by GenomeBrowse (http://www.goldenhelix.com). For tissue WES, somatic variants identified by at least two out of the three callers (VarScan2,45 TNscope46 and Mutect247) were selected and then filtered with three criteria: (1) VAF ≥8%; (2) sequencing depth in the region ≥8; and (3) sequence reads in support of the variant call ≥2. All SNVs/indels were annotated using ANNOVAR (Annotate Variation, V.2018-04-16).48 CNVkit V.0.9.3 was used for copy number variation (CNV) detection of the ctDNA samples49; EXCAVATOR2 V.1.1.2 was used for CNV analysis,50 and GeneFuse V.0.6.1 was applied for structural variation detection.51
Selection of genomic alterations
Somatic variants (SNVs or indels) were included for the comparison of mutational concordance between tumour tissue and plasma ctDNA. To explore genomic evolution under treatment in CRC, gene alterations were filtered for oncogenic variants using the OncoKB, a comprehensive and curated database that offers detailed, evidence-based information about individual somatic mutations and structural alterations with potential clinical actionability that are present in patient tumours.52 Targets with level one or two evidence, including KRAS, NRAS and BRAFV600E mutations as well as NTRK fusion and ERBB2 amplification, were defined as SOC actionable variants. Targets with level four evidence, including KRASG12C, BRAFnonV600E (G464, G469A, G469R, G469V, K601, L597), PTEN, NF1, MTOR, CDK12, CDKN2A, and FGFR1/FGFR2/FGFR3 alterations as well as MET fusion, were adopted as variants for clinical trials (figure 3A). To investigate the potential resistance mechanisms of EGFR antibodies, all new genetic alterations were noted.
Statistical analysis
The analysis of concordance between plasma and primary tumour mutational status for each gene was based on overall percent agreement, sensitivity (positive percent agreement), and specificity (negative percent agreement). The MSAF was calculated for each case and used to provide an estimate of the ctDNA fraction in the blood.53 PFS was defined as the time from enrollment to disease progression, death, or the end of follow-up, whichever came first. OS time was measured from the date of diagnosis of stage IV disease until the date of death or last follow-up. For survival tests, PFS and OS were analysed using the Kaplan-Meier method. For comparison of PFS or OS between different groups, the log-rank test was used. A multivariable Cox proportional hazards model was established to adjust for the impact of changes in the ctDNA fraction of cfDNA. Correlations between variables were assessed using Spearman’s rank correlation coefficient. A two-tailed p<0.05 was considered to be statistically significant. Statistical analysis was performed with R (V.4.0.1).
Data availability statement
Data are available upon reasonable request.
Ethics statements
Patient consent for publication
Acknowledgments
We thank all patients and their families for participating in this study.
References
Supplementary materials
Supplementary Data
This web only file has been produced by the BMJ Publishing Group from an electronic file supplied by the author(s) and has not been edited for content.
Footnotes
FW, Y-SH, H-XW, Z-XW and YJ are joint first authors.
Contributors Conception and design: FW, R-HX. Development of methodology: Y-SH, H-XW, Z-XW, YJ, Y-XC, M-MH, S-fC, M-yX, QZ. Acquisition of data: Y-SH, H-XW, Z-XW, YJ, Y-XC, QZ, M-MH, H-YL, M-ZQ, D-sW, F-HW, Y-HL, FW, R-HX. Analysis and interpretation of data: Y-SH, H-XW, Y-XC, S-fC, M-yX, QZ, FW, R-HX. Writing, review, and/or revision of the manuscript: Y-SH, H-XW, Z-XW, FW, R-HX. Study supervision: FW, R-HX.
Funding The National Key R&D Program of China (2018YFC1313300, to R-HX); the National Natural Science Foundation of China (81930065, to R-HX); the International Cooperation and Exchanges National Natural Science Foundation of China (82061160373, to FW); the National Natural Science Foundation of China (General Program, 81872011, to FW); the Science and Technology Program of Guangdong (2019B020227002, to R-HX); the Science and Technology Program of Guangzhou (201904020046, 201803040019, 201704020228, to R-HX); the Sun Yat-sen University Clinical Research 5010 Program (2018014, to FW); the Young Physician Scientist Program of Sun Yat-sen University Cancer Center (16zxqk03, to FW); the Fundamental Research Funds of Sun Yat-sen University Cancer Center (20ykzd166, to YJ); the Precision Oncology Research Program of Guangdong (to YJ).
Competing interests None declared.
Provenance and peer review Not commissioned; externally peer reviewed.
Supplemental material This content has been supplied by the author(s). It has not been vetted by BMJ Publishing Group Limited (BMJ) and may not have been peer-reviewed. Any opinions or recommendations discussed are solely those of the author(s) and are not endorsed by BMJ. BMJ disclaims all liability and responsibility arising from any reliance placed on the content. Where the content includes any translated material, BMJ does not warrant the accuracy and reliability of the translations (including but not limited to local regulations, clinical guidelines, terminology, drug names and drug dosages), and is not responsible for any error and/or omissions arising from translation and adaptation or otherwise.