Article Text

Abstract
Objective Sodium+/ taurocholate cotransporting polypeptide (NTCP) is a membrane transporter affecting the enterohepatic circulation of bile acids (BAs). We aimed to evaluate NTCP’s roles in humans and animal models of liver fibrosis (LF).
Design Primary hepatic stellate cells (pHSCs) isolated from livers biopsies of patients with LF with different fibrosis grading were stained for NTCP. NTCP gene silencing, taurocholic acid (TCA), obeticholic acid (OCA), epigallocatechin gallate (EGCG) and HA-100 dihydrochloride (HA-100) were used as tools to modulate NTCP expression on human HSC line (LX2). BA trafficking/uptake were assessed extracellularly (LX2 culture medium) and intracellularly following treatment with/without NTCP neutralizing antibody. LF models of C57/BL6 mice of carbon tetrachloride (CCl4) and leptin-deficient (Ob/Ob) fed with high-fat diet (Ob/Ob HFD ) were evaluated for pHSCs-NTCP expressions, metabolic and LF profiles following intraperitoneal injections of NTCP neutralizing antibody.
Results pHSCs from F3/F4-scored patients of LF exhibit threefold increased NTCP expressions compared with F0-scored patients (p<0.0001). Sorted-activated HSCs (LX2αSMA+) showed high expressions of NTCP and high TCA uptake in vitro and triggered a further increase in their activations. This phenomenon was inhibited with NTCP small interfering RNA and the NTCP neutralizing antibody. Sorted LX2NTCP+ (high alpha smooth muscle actin (αSMA)/high NTCP) cells showed high phosphorylated pathways of AKT/mTOR and protein kinase C (PKC) accompanied with a decrease in farnesoid X receptor expression. Moreover, LX2NTCP+ cells treated with EGCG, OCA and PKC inhibitor HA-100 significantly decreased NTCP and αSMA. NTCP neutralizing antibody inhibited NTCP (less TCA uptake); it attenuated LF in both CCl4 and Ob/Ob HFD animal models with ameliorated metabolic profile.
Conclusion NTCP expression is linearly correlated with fibrosis severity. Modulated BA trafficking could be an important step in LF pathogenesis. Antagonising BA uptake may suggest a therapeutic strategy for preventing disease progression.
- bile acid
- cholestatic liver diseases
- fatty liver
- molecular mechanisms
- fibrosis
Data availability statement
Data are available upon reasonable request. All data relevant to the study are included in the article or uploaded as supplementary information and protocols.
This is an open access article distributed in accordance with the Creative Commons Attribution Non Commercial (CC BY-NC 4.0) license, which permits others to distribute, remix, adapt, build upon this work non-commercially, and license their derivative works on different terms, provided the original work is properly cited, appropriate credit is given, any changes made indicated, and the use is non-commercial. See: http://creativecommons.org/licenses/by-nc/4.0/.
Statistics from Altmetric.com
Significance of this study
What is already known on this subject?
Liver fibrosis (LF) is the main determinant of long-term outcome in chronic liver diseases.
Increased plasmatic and hepatic concentrations of bile acids (BAs) in patients with LF were suggested to be associated with disease progression and LF.
What are the new findings?
For the first time, sodium taurocholate cotransporting polypeptide (NTCP), a BA transporter was found on hepatic stellate cells (HSCs).
Our data indicate that HSC activation might be a secondary step resulting from BA uptake through NTCP.
NTCP blocking prevents the development of LF, providing further evidence for its use in the treatment of LF.
How might it impact on clinical practice in the foreseeable future?
Antagonising BA uptake may suggest a therapeutic strategy for preventing LF progression.
Introduction
Sodium+/taurocholate cotransporting polypeptide (NTCP) is a multipass transmembrane protein expressed almost exclusively on the sinusoidal membranes of hepatocytes.1 NTCP accounts for approximately 90% bile acid (BA) uptake and was the first cloned BA transporter.2 NTCP is also a critical receptor for viral entry of hepatitis B virus and its satellite virus hepatitis D virus.3 NTCP expression is controlled by BAs, hormones such as oestrogen and prolactin, drugs, toxins and proinflammatory cytokines.4 Moreover, NTCP undergoes post-translational regulation involving phosphorylation or dephosphorylation, thus mediating its localisation.5 Signalling pathways involving cyclic AMP, calcium, nitric oxide, phosphoinositide 3-kinase, protein kinase C (PKC) and protein phosphatases mediate this post-translational regulation.6 NTCP expression is diminished in cholestasis people and animal models of cholestasis induced by biliary obstruction, oestrogen or endotoxin.7
A key NTCP repressive mechanism involves activation of the farnesoid X receptor (FXR) through accumulation of BAs, thus inducing the small heterodimer partner (SHP), a repressor of hepatic nuclear factor 1 (HNF 1) and HNF4α, and also interfering with retinoid X receptor–retinoic acid receptor heterodimers in rats or the glucocorticoid receptor in humans, all of which are required for normal NTCP expression.8
NTCP regulation under physiological and pathological conditions in liver fibrosis (LF) has not been addressed in the literature. There are no studies investigating BAs uptake and transporters in hepatic stellate cells (HSCs). HSCs are resident mesenchymal cells that retain features of resident fibroblasts (embedded in normal stromal matrix) and pericytes (attached to endothelial cells of capillaries) and compose approximately one-third of the non-parenchymal cells and 15% of the total resident cells in the normal human liver.9 In fibrogenic liver, quiescent HSCs transdifferentiate into proliferative, migratory and contractile myofibroblasts, thus manifesting pro-fibrogenic transcriptional and secretory properties (so called ‘cell activation’), and they secrete extracellular matrix molecules that accumulate and form scar tissue in the space of Disse, thereby resulting in sinusoidal capillarisation characterised by a loss of endothelial fenestration.10 Given that patients with non-alcoholic steatohepatitis (NASH) have elevated levels of BAs in both liver tissue and plasma,11 we suggest a relationship between pathological levels of BAs and the development of NASH through LF mediated by NTCP.
Materials and methods
Patients
Seventy-four patients with LF with NASH aetiology according to liver biopsy were obtained in 2019–2021 at the Liver Unit, Hadassah Medical Centre, Israel. All patients were males over 18 years of age. LF was staged as follows: 0: none; 1: perisinusoidal or periportal; 2: perisinus and periportal; 3: bridging fibrosis and 4: cirrhosis. Patients were excluded if they had received steroid administration; recently used warfarin, metformin, thiaglitazones or insulin for more than 1 month or with a history of any use in the prior 2 months and daily alcohol intake >10 g/day. We also excluded cases with aetiology for other liver diseases including viral hepatitis, autoimmune disease, haemochromatosis, Wilson’s disease, alpha-1 antitrypsin disease, alcohol or any toxicity. The ethical committee provided approval, and written informed consent was obtained from participants.
Patient and public involvement
Patients or the public were not involved in the design, or conduct, or reporting, or dissemination plans of our research.
Primary hepatic stellate cell isolation from human liver biopsies
Liver biopsies were guided by ultrasonography using an 18 G disposable Tru-Cut needle (15 mm) from patients with LF with different fibrosis scores (n=30). The specimens were either fixed in 4% formalin and permeablised with triton X10 (0.01%) for histological staining or used for isolating primary hepatic stellate cells (pHSCs) through digesting the livers at 37°C for 40 min with 20 mL of Gey's balanced salt solution solution containing 0.1% (wt/vol) pronase, 0.1% (wt/vol) collagenase and 0.01% (wt/vol) deoxyribonuclease (DNase I) (all enzymes were purchased from Roche Diagnostics GmbH, Mannheim, Germany). The resulting suspension was filtered through a 150 mm steel mesh and centrifuged on 17.5% Nycodenz cushion (Sigma, St. Louis, USA) at 1400 g for 20 min at 25°C, which produced a HSC-enriched fraction in the upper whitish layer. Cells were washed by centrifugation (400 g, 25°C, 10 min) and cultured in Dulbecco’s modified Eagle’s medium (DMEM) supplemented with 10% (vol/vol) fetal calf serum (FCS), 100 µg/mL penicillin and 100 µg/mL streptomycin, for confluence. Purified pHSCs were performed through alpha smooth muscle actin (αSMA) staining by flow cytometry together with their assessment for viability with trypan blue. The mean viability of the pHSCs as measured by propidium iodide exclusion was 92.7%±2.1%, and the mean number of pHSCs isolated from 1 mg of liver tissue range between 3000 and 12 500 cells/mg. pHSCs were then cultured for 48 hours until reaching confluence.
Cell culture
LX2 (105 cells), a human HSC line, was cultured in DMEM supplemented with 1% (naive state) or 10% (activated state) FCS, 100 units/mL penicillin and 100 mg/mL streptomycin. Cells were grown under 5% CO2 at 37°C and confirmed to be negative for mycoplasma contamination with an EZ-PCR mycoplasma test kit (Biological Industries, 20-700-20). For the manipulation experiments, LX2 cells were treated with: taurocholic acid (TCA; Sigma, 86 339-5G) at the concentrations of 100 µM; obeticholic acid (OCA; Intercept) at the concentrations of 0, 0.05 and 1 µM; HA-100 dihydrochloride (HA-100; Abcam, ab145567) at the concentration of 7 µM; dimethyl sulfoxide (DMSO) at the concentrations of 1% and epigallocatechin gallate (EGCG; Sigma, Cat# 50 299-1 MG-F) at the concentrations of 0, 1 and 50 µM. All treatments were incubated with cells for 48 hours.
Fluorescence-activated cell sorting
LX2 (106 cells/mL) were stained with the following primary antibodies: mouse anti-human αSMA (R&D; IC1420P) and rabbit anti-human SLC10A1 (Novus; NBP1-60109). The cells were then stained with the following secondary antibodies: goat anti-rabbit-AF647 (Abcam; ab150079) and rabbit anti-mouse-FITC (Abcam; ab6724). Fluorescence-activated cell sorting (FACS) was used to sort LX2 cells according to αSMA expressions (LX2αSMA− vs LX2αSMA+) and NTCP expressions (LX2NTCP− vs LX2NTCP+) with an Aria III Sorter (BD FACSAria).
NTCP gene silencing (siRNA)
Sorted positive NTCP population (LX2NTCP+) was silenced with NTCP small interfering RNA (siRNA) kit (Santa Cruz, sc-92260) according to the manufacturer’s instructions.
TCA uptake assay
LX2NTCP+ subpopulations were seeded into 24-well plates and cultured under standard conditions until they reached 80% confluence. The cells were incubated at 37°C with uptake buffer containing 100 µM TCA supplemented with radiolabeled 0.25 μC [3H] TCA for 45 min. Subsequently, the cells were washed 4× with ice cold phosphate buffered saline (PBS) and lysed in 0.05% SDS. Accumulation of radiolabeled substrates was determined by scintillation counting. NTCP neutralizing antibody (10 µM; Novus; NBP1-60109) were incubated with the LX2NTCP+ cells for 2 hours prior to TCA insults.
Western blot analysis
Harvested LX2 protein extracts were prepared in homogenisation buffer (50 mmol/L Tris–HCl, pH 7.6, 0.25% Triton-X 100, 0.15 M NaCl, 10 mM CaCl2 and complete mini EDTA-free protease inhibitor cocktail (Roche Diagnostics)). Next, proteins (30 µg per lane) were resolved on a 10% (w/v) SDS-polyacrylamide gel (Novex, the Netherlands). For immunoblotting, proteins were transferred to a polyvinylidene difluoride membrane. Blots were incubated for 1 hour at room temperature in blocking buffer containing 5% skim milk; incubated overnight at 4°C with mouse anti-human αSMA, rabbit anti-human NTCP, rabbit anti-human MMP-9, mouse anti-human FXR, mouse anti-human p-AKT, mouse anti-human AKT, rat anti-human pmTOR, goat anti-human mTOR, mouse anti-human Col I, rabbit anti-human Col III, rabbit anti-human PKC and mouse anti-human pPKC (R&D System, diluted 1:1000); and subsequently incubated with peroxidase-conjugated goat anti-mouse, goat anti-rabbit, goat anti-rat or rat-anti-goat IgG (Compiegne, France, diluted 1:5000) for 1.5 hour at room temperature. Immunoreactivity was detected with an ECL kit (Amersham Pharmacia Biotech, Les Ulis, France).
Animal model
C57BL/6J male mice model of LF and leptin-deficient mice (Ob/Ob) at week 12 of age received care according to the Hebrew University ethical regulations and NIH guidelines. The institutional animal care ethical committee approved all animal protocols. The mice were housed in a barrier facility. The carbon tetrachloride (CCl4; Sigma, C-5331) fibrosis model was used by intraperitoneal injections of 0.5 µL pure CCl4/g body weight (one to nine dilution in mineral oil) bi-weekly for 8 weeks as an advanced chronic liver disease.12 13 Ob/Ob mice fed for 4 weeks with high-fat diet (HFD) (Ob/Ob HFD ) (Cat # TD.06414 (60% fat); (18.3% kcal protein, 21.4% kcal carbohydrate and 60.3% Kcal fat). At week 6 of the CCl4 mice model and at week 2 of the HFD, mice were intraperitoneally treated with polyclonal anti-mouse NTCP neutralizing antibody (Cat # 350832; US Biological, USA) at a concentration of 20 µg/mice twice a week for an additional of 2 weeks. All experiments were performed during day. In each animal group, n=10 were used. Sacrifice was performed 2 days after the final CCl4 injections; mice were weighed and anaesthetised intramuscularly with 0.1 mL of ketamine: xylazine: acepromazine (4:1:1) per 30 g body weight before cervical dislocation.
Serum biochemistry
Whole blood samples of mice were collected at the sacrificing day, centrifuged at 3500 rpm for 10 min at 4°C. Serum levels of alanine transaminase (ALT), aspartate transaminase (AST) and BAs concentrations were determined. Fasting blood sugar, cholesterol, triglycerides and glucose tolerance test were assessed following mice fasting for 16 hours. All tests were performed at the Central Laboratory, Hadassah Medical Center, Jerusalem.
RNA isolation, cDNA preparation and real-time PCR
Total cellular RNA was isolated from liver tissue with 2 mL TRI Reagent (Bio Lab; Cat# 90102331) per cm3 of tissue. The samples were homogenised for 5 min at room temperature. Chloroform at a volume of 0.2 mL (Bio Lab; Cat# 03080521) was added to each sample, incubated for 15 min at room temperature and centrifuged (1400 rpm) for 15 min at 4°C. For RNA precipitation, the supernatant in each sample was transferred to a new microcentrifuge tube, 0.5 mL of isopropanol (Bio Lab; Cat# 16260521) was added and incubated for 10 min at 25°C, and the tubes were centrifuged (12 000 rpm) for 10 min at 4°C. The supernatants were removed, and 1 mL of 75% ethanol was added to the pellet and centrifuged (7500 rpm) for 5 min. The pellets were air dried at room temperature for 15 min, 50 µL of diethylpyrocarbonate was added, and the samples were heated for 10 minutes at 55°C. Preparation of c-DNA was performed with a High Capacity cDNA Isolation Kit (R&D; Cat# 1406197). Real-time PCR was performed with TaqMan Fast Advanced Master Mix (Applied Biosystems; Cat# 4371130) for quantification of αSMA and SLC10A1 gene expression, which was normalised to the expression of the housekeeping gene GAPDH.
Histological assessments of mice livers
The posterior one-third of the liver was fixed in 4% formalin for 24 hours and then paraffin-embedded in an automated tissue processor. Sections (7 mm) were stained for H&E for evaluating steatosis, necroinflammatory regions and apoptotic bodies, 0.1% Sirius red F3B in saturated picric acid (Abcam, ab150681) as well as Masson’s trichrome stain for connective tissue (Abcam, ab150686).
Immunofluorescence staining
For deparaffinisation, paraffin-embedded sections were placed at 60°C for 15 min, incubated in xylene at room temperature for 15 min and then transferred sequentially into 100% EtOH, 95% EtOH, 70% EtOH and 50% EtOH for 4 min each at room temperature. Sections were rinsed in deionised water and stored in PBS. For antigen retrieval, we used a buffer (10 mM citrate, pH 6.2, 2 mM EDTA and 0.05% Tween 20) for anti-NTCP receptor and anti-αSMA detection. HSCs (LX2 and pHSCs) as well as liver animal tissue samples were outlined with 100 µL of KASBLOCK liquid blocker to minimise the volume of antibody solution needed for staining. Samples were incubated overnight at 4°C with rabbit anti-human NTCP, rabbit anti-mouse NTCP (diluted 1:30) and mouse anti-human /mouse/ratαSMA (diluted 1:170) (IQ Products, Groningen, Netherlands). Samples were washed with PBS, secondary antibodies conjugated with Cy-3 or with Cy-2 were applied for 1 hour at room temperature, and image capture was performed. Samples were viewed and imaged with a Zeiss LSM 710 confocal laser scanning system (Zeiss, Germany) attached to a Zeiss Axiovert 135M microscope, equipped with a Plan-Apochromat Zeiss 63X lens. An argon laser (488 nm excitation) was used to detect green fluorescence, and an Alexa Fluor laser (552 nm) was used to detect red fluorescence.
Statistical analysis
Statistical differences were analysed with two-tailed unpaired Student’s either t-test (for comparison between two groups) or one-way analysis of variance (with Newman-Keuls post-tests among multiple groups) in GraphPad Prism V.5.0 (GraphPad Software, La Jolla, California, USA). For the in vitro study, every experiment was repeated three times each with four replicates.
Results
NTCP expression on HSCs is linearly correlated with fibrosis progression in patients with LF
Human hepatocytes have been shown to express NTCP, whose expression is downregulated in patients with cholestasis.14 NTCP mediates hepatic and intestinal BA uptake.15 We confirmed (data not shown) the presence of NTCP in hepatocytes of liver biopsies obtained from patients with LF; however, no previous data are available on NTCP expression on HSCs in these patients. In fibrogenic liver, quiescent HSCs transdifferentiate into proliferative, migratory and contractile myofibroblasts, thereby manifesting pro-fibrogenic properties, such as accumulation of αSMA.10 Figure 1A–C shows NTCP expression on isolated pHSCs obtained from LF biopsies of patients with F0, F1/F2 and F3/F4 scores. These pHSCs were cultured and assessed for NTCP expressions following 48 hours (Cell confluence). Confocal microscopy shows representative images of pHSCs stained with NTCP of higher intensities/expressions in the F1/F2-scored (figure 1B) and F3/F4-scored (figure 1C) patients compared with F0-scored patients (figure 1A) in favour of the F3/F4-scored patients. We quantify NTCP on pHSCs through enumeration pHSCs expressing NTCP per field represented as pHSCsNTCP+/field. Figure 1D shows increased number of pHSCs with NTCP staining from the F3/F4-scored patients in consistent with increased NTCP intensities seen in figure 1C (p<0.0001). Western blot analysis of quantitated NTCP on pHSCs also confirmed elevated expressions in the F3/F4-scored patients compared with F0 and F1/F2 counterparts (figure 1E). To exclude effects of medium environment and cell confluence on modulating expressions of NTCP, isolated pHSCs were stained on the same day (time 0) prior to culturing. Data showed expressions of NTCP by confocal microscopy (online supplemental figure 1A) and were linearly correlated with 24 hours (online supplemental figure 1B) and 48 hours (online supplemental figure 1C) of culture incubations. The results were quantified in online supplemental figure 1D (number of pHSCsNTCP+/ field) and online supplemental figure 1H (pHSCsNTCP+ intensities). NTCP expressions also performed directly through staining of HSCs of liver biopsies sections. Online supplemental figure 1F–H shows representative liver biopsies from (F) F0, (G) F1/F2 and (H) F4 scores showed merged staining NTCP (green) and αSMA (red) reflected as yellow colours indicated linear colour intensities with severity of fibrosis scores. To better confirm the above phenomenon, we used a human HSC cell line (LX2) as an in vitro model for evaluating NTCP expressions in both the naive (cultured in 1% FCS) and activated (cultured in 10% FCS) state. Figure 1F,G shows confocal microscopy of LX2 stained with green (αSMA) and in red (NTCP). Figure 1G indicates high αSMA staining intensity of activated LX2 associated with high intensity of NTCP staining compared the naive counterparts having low NTCP expressions (figure 1F). Quantitation of stained NTCP fluorescence intensities was performed and showed twofold increase in activated LX2 compared with naive ones (p<0.001, figure 1H). Moreover, flow cytometry was used to assess NTCP expressions on LX2 as described in Materials and methods section. Figure 1I shows flow cytometry analysis of elevated expression of NTCP (375±16 mean fluorescence intensity (MFI)) on activated LX2 compared (268.5±15 MFI) with naive cells. To further correlate NTCP with LX2 activation, we sorted positive LX2 cells (αSMA positive cells) in an attempt to quantitate NTCP expressions and compare them with negative sorted cells. This was made through a gate (G1: LX2αSMA+; 58% αSMA) to include sorted LX2 from the high αSMA population and a gate (G2: LX2αSMA−; 42% αSMA) to include low αSMA population, as shown in figure 1J. These two populations were assessed for αSMA intensities for confirming activated state of LX2. Figure 1K shows representative histogram of αSMA MFI from the gated G1 (MFI=429.1) and G2 (MFI=21.7) populations. The sorted G1 population (high αSMA) exhibited increased NTCP and reduced MMP-9 than the G2 population (low αSMA) as indicated in the representative western blot analysis (figure 1L) and the quantitated averages of the proteins analysed (figure 1M). Our results reveal for the first time a correlation between NTCP expression and HSC activations, thus indicating the potential role of NTCP in fibrogenesis.
Supplemental material

Activated primary hepatic stellate cells (pHSCs) and LX2 exhibit high expression of NTCP. Confocal microscopy of NTCP expressions on pHSCs obtained from liver biopsies of patients with liver fibrosis with (A) F0 score, (B) F1/F2 score and (C) F3/F4 score. pHSCs are shown as follows: DAPI for nucleus staining (blue), Cy-3 conjugated NTCP (red). (D) pHSCs expressing NTCP were enumerated and presented as pHSCsNTCP+/field. (E) Quantitated western blot analysis of NTCP in pHSCs obtained from F0, F1/F2 and F3/F4 patients with liver fibrosis. (F) Confocal microscopy of NTCP expressions on LX2 cells incubated with 1% FCS; naive state and (G) 10% FCS; activated state. LX2 cells are shown as follows: DAPI for nucleus staining (blue), Cy-2 conjugated αSMA (green), Cy-3 conjugated NTCP (red). (H) Confocal microscopy quantitation of NTCP represented as colour intensities in the 1% and 10% FCS treatments. (I) Averages of flow cytometry analysis of NTCP and αSMA mean fluorescence intensity (MFI) for LX2 cells incubated with 1% or 10% FCS. (J) Representative flow cytometry diagram showing sorted LX2 subpopulation according to αSMA expression (LX2αSMA−: gate 1 (G1) and LX2αSMA+: gate 2 (G2)). The upper small diagram represents LX2 cells categorised by size (forward-scattered; FSC) and granularity (side-scattered; SSC). (K) Representative flow cytometry histogram of αSMA-MFI following LX2 subpopulation sorting displayed by αSMA expression (LX2αSMA−: gate 1 (G1) and LX2αSMA+: gate 2 (G2)). (L) Bands of western blots of NTCP and fibrosis markers (MMP-9 and αSMA) in sorted LX2αSMA subpopulation. (M) Averages of protein quantification of NTCP and fibrosis markers (MMP-9 and αSMA) in sorted LX2αSMA subpopulation. αSMA, alpha smooth muscle actin; FCS, fetal calf serum; NTCP, sodium taurocholate cotransporting polypeptide.
NTCP mediates BAs trafficking in LX2
To evaluate whether NTCP on HSCs might have the same role in hepatocytes in mediating BAs uptake, we treated LX2NTCP+ cells with buffer containing 100 µM TCA supplemented with radiolabeled 0.25 μC [3H] TCA (an NTCP physiological substrate; agonist) for 45 min. To modulate TCA uptake, we used NTCP neutralizing antibody in an attempt to block NTCP prior to TCA insults. TCA levels were later determined in the medium and in LX2NTCP+ lysates at 45 min intervals. Figure 2A shows that TCA concentrations of 100 µM in the medium were reduced to 43±1.2, 11.3±0.1 and 2.4±0.2 µM at 15, 30 and 45 min, respectively, when incubated with LX2NTCP+ (p values<0.01). In parallel, TCA intracellular concentrations in cell lysates showed a significant graduate elevation of 103±1.3 µM to 205±1.3 µM following 45 min of TCA incubations (p values<0.03; figure 2B). LX2NTCP+ pretreated with NTCP neutralizing antibody maintained TCA concentration in the medium as well as intracellularly with no significant changes observed indicating inhibited TCA uptake. Human primary hepatocytes (THLE-2 cell line) expressing NTCP16 were used as a positive control and Hep3B cells with no expression of NTCP17 were used as a negative control. No alterations in the concentrations of TCA in the medium or within Hep3B cells were observed after 45 min (data not shown), thus suggesting the importance of NTCP in TCA consumption/uptake. To further correlate BAs uptake in influencing LX2NTCP+ activation state, αSMA intensities were followed up during a time kinetics of 45 min. Figure 2C shows a graduate elevation in LX2NTCP+ activations reflected by increase in αSMA (p<0.05) along TCA uptake inside in the cells, while blocking NTCP maintained same αSMA intensities similar to TCA untreated cells. The above setting of experiment was repeated with additional fibrosis markers of Col I and Col III (collagen) using the western blot. Figure 2D shows western blots of elevated band expressions of Col I and Col III following 30 and 45 min of TCA (100 µM) insults. The generated bands were quantitated as displayed in figure 2E. BAs activate HSCs through TCA insults, however, chenodeoxycholic acid (CDCA) and tauroursodeoxycholic acid (TUDCA) also showed to cause HSCs activations although to a lesser extent compared with TCA (online supplemental figure 2A,B). CDCA and TUDCA did not modulate NTCP expressions (data not shown) and some other mechanisms could interfere with their effects on HSC activation that could be addressed in different experimental design. Our data indicate that HSC activation might be a secondary step resulting from BAs uptake through NTCP.
Supplemental material

TCA trafficking in HSCs. Sorted LX2NTCP+ cells were incubated with buffer containing 100 µM TCA supplemented with radiolabeled 0.25 μC [3H] TCA with or without NTCP blocker (neutralizing antibody) for 15, 30 or 45 min. Kinetics of TCA concentrations in (A) medium and (B) cell lysate made by scintillation counting. Kinetics of MFI of LX2NTCP+αSMA of 15 min time intervals following TCA insults with or without NTCP neutralizing antibody performed by (C) flow cytometry, (D) western blots of fibrosis markers (αSMA, Col I and Col III (following 30 and 45 min)) and (E) quantitated through protein:β-actin ratio. Results between groups were statistically significant (p<0.05). αSMA, alpha smooth muscle actin; MFI, mean fluorescence intensity; NTCP, sodium+/taurocholate cotransporting polypeptide; TCA, taurocholic acid.
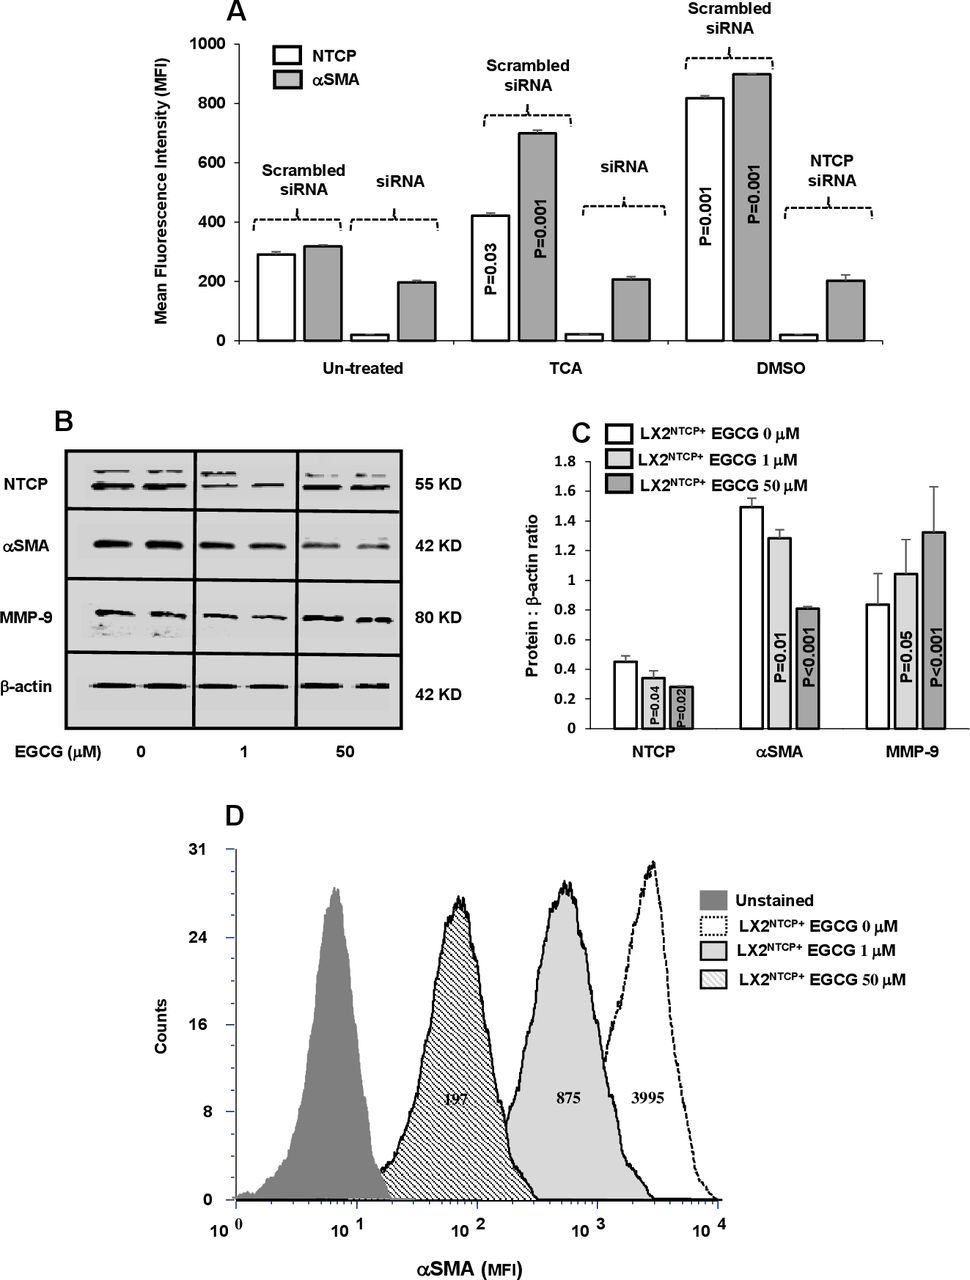
Blocking of NTCP expressions on LX2NTCP+ inhibited its activation following TCA insults
Functional properties of NTCP in inducing LX2 activation were studied through the use of selected siRNAs-NTCP knockdown following insults with TCA and DMSO (an NTCP non-physiological agonist). Sorted LX2NTCP+ in 1% FCS expressing low NTCP were incubated with abovementioned agonists as indicated in Materials and methods section. Figure 3A shows elevated NTCP observed following treatment with the agonists and consequently triggered HSC activation (αSMA MFI increased from 313±25 in untreated cells to 700±81 and 900±52 following insult with TCA and DMSO, respectively; p<0.05). siRNA-transfected LX2NTCP+ prevented agonist insults in inducing elevations in αSMA and highlighted potential role of NTCP modulatory effects in moderating HSC activations in an in vitro culture assay. Different experiments were conducted to clarify NTCP expressions in HSC activations; sorted LX2NTCP+ were first activated through culturing with 10% FCS (to further stimulate NTCP expressions) and were then treated with EGCG in an attempt to induce NTCP endocytosis.18 Online supplemental figure 3A shows a reduction in NTCP transmembrane expressions and were associated with elevated concentrations of EGCG (1 µM and 50 µM) as analysed by the flow cytometry. Confirmed modulatory effects of EGCG on NTCP expressions in LX2NTCP+ were also assessed by western blot analysis (figure 3B) and correlated with changes in fibrotic markers as summarised in figure 3B–D. Figure 3B shows representative bands of western blot of LX2NTCP+ following EGCG treatments with concentrations of 1 µM and 50 µM. Reduced NTCP expressions were inversely correlated with elevated EGCG concentrations. Moreover, pro-fibrogenic markers of αSMA and MMP-919 were improved (decreased αSMA and increased MMP-9) in a dose-dependent manner following the EGCG treatments as verified in figure 3C of western blot quantitation. Further verification on the effects of EGCG on LX2NTCP+αSMA intensities was also performed. Figure 3D displays histograms of LX2NTCP+ population untreated or treated with EGCG. Data indicated that EGCG with concentrations of 1 µM and 50 µM reduced LX2NTCP+activations to 4.5-fold and 20-fold, respectively (p<0.02) compared with untreated cells. Moreover, we related effects of EGCG to signalling pathways of AKT and mTOR as an index to HSCs activations.20 Assessing these pathways were performed through western blot analysis by choosing ECGC with the concentration of 50 µM. Online supplemental figure 3B,C showed less phosphorylated AKT and mTOR in the LX2NTCP+ cells following incubations with the EGCG. Our overall obtained results emphasise that LX2 deactivation is associated with reduced NTCP expression.
Supplemental material

In vitro inhibition of NTCP reduced αSMA in LX2NTCP+. (A) Inhibition of NTCP expression on LX2 were made by small interfering RNA (siRNA). TCA and DMSO were used as NTCP agonists with the scrambled and specific siRNA treatments. EGCG at the concentrations of 0, 1 and 50 µM were incubated with sorted LX2NTCP+. Bands of representative western blots of NTCP, αSMA and MMP-9 are presented in (B) and quantified in (C) and (D) representative flow cytometry analysis of αSMA intensities were analysed. For statistically significant differences, paired and unpaired Student’s t-test and analysis of variance were used. αSMA, alpha smooth muscle actin; DMSO, dimethyl sulfoxide; EGCG, epigallocatechin gallate; MFI, mean fluorescence intensity; MMP-9;matrix metallopeptidase 9; NTCP, sodium+/taurocholate cotransporting polypeptide; TCA, taurocholic acid.
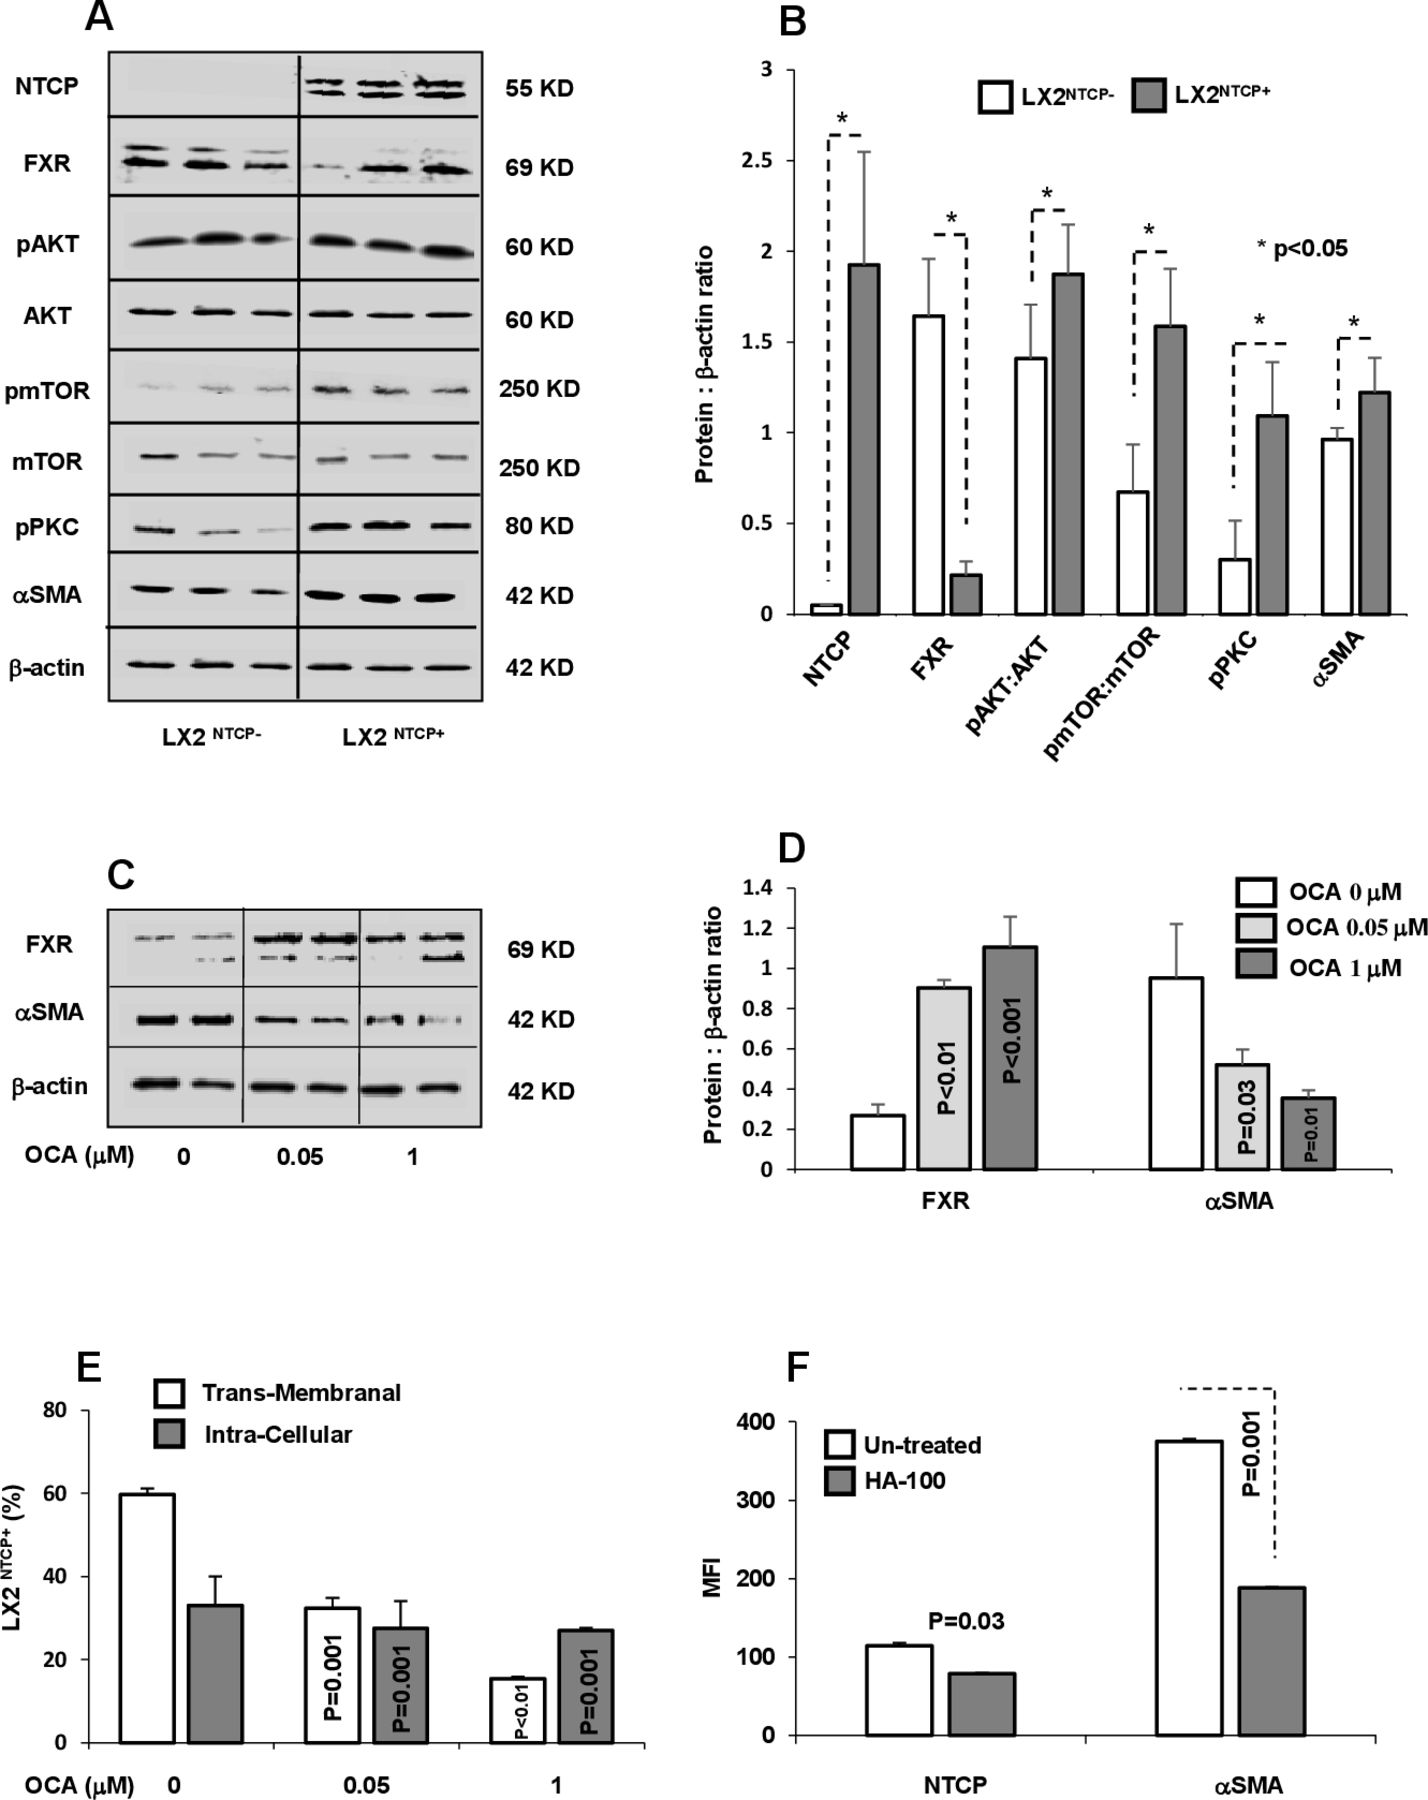
PKC phosphorylation and FXR regulate NTCP expression in activated HSCs
In light of the above results, and to explore whether NTCP overexpression might be associated with alterations in intracellular signalling pathways, we evaluated FXR (a regulator of NTCP expression) and PKC (NTCP localisation regulator) in LX2 sorted subpopulations with or without NTCP expression. Several members of the nuclear receptor superfamily of ligand-activated transcription factors, including FXR (NR1H4), regulate NTCP expression. FXR suppresses NTCP expression through induction of SHP.21 22 Sorted LX2NTCP+ showed downexpression of FXR compared with NTCP negative cells (LX2NTCP−; figure 4A). In addition, these sorted subpopulations showed significant increase in phosphorylated AKT (involved in cell survival and metabolism), mTOR (involved in insulin metabolism and physiology) and PKC (involved in translocation of NTCP to the membrane). Western blot analysis of cell signalling pathways was quantified and presented in figure 4B. In agreement with data generated in hepatocytes, we showed FXR and NTCP inversely associated. Moreover, PKC phosphorylation in the LX2NTCP+ population correlated with amplified AKT-mTOR signalling as well as αSMA, which may explain in part the elevated transmembrane NTCP expression in HSCs. We further supported our data through obtaining LX2NTCP+ cells with inhibited FXR expression and treated them with OCA, an FXR agonist, at concentrations of 0.05 and 1 µM, as described in the Materials and methods section. Figure 4C,D shows western blot analysis indicating an increase in FXR expression associated with decreased αSMA levels following treatment with OCA. These findings were accompanied by a decrease in both intracellular and transmembrane staining of NTCP represented as percentages of αSMA+/NTCP+ (figure 4E) as well as demonstrated through confocal microscopy (online supplemental figure 4A–C). Our results suggest that decreased transmembrane expression of NTCP might be attributable to a decrease in pPKC and may result in less NTCP translocation to the cell surface. Therefore, we treated the LX2 NTCP+ subpopulation expressing high pPKC with the PKC inhibitor HA-100 (known to inhibit NTCP translocation to the plasma basolateral membrane) and evaluated transmembrane expression of NTCP. Figure 4F shows that inhibition of PKC (data not shown) led to a decrease in NTCP, a result correlated with a significant decrease in αSMA, thus strongly suggesting that regulation of NTCP translocation by PKC may be an approach to understand the signalling pathway in future studies.
Supplemental material

NTCP regulation through FXR and pPKC. (A) Protein western blots and (B) quantitated bands of NTCP, FXR, pAKT, pmTOR, pPKC and αSMA from LX2NTCP+ sorted cells. OCA, an FXR agonist, was incubated with LX2NTCP+ at concentrations of 0.05 and 1 µM, as described in the Materials and methods section. (C) Bands of western blot of FXR and αSMA and their (D) quantitations were performed. (E) Flow cytometry analysis of transmembrane and intracellular expression of NTCP in αSMA positive LX2 (αSMA+/NTCP+) (calculated intracellular NTCP=Total NTCP expressions – transmembrane NTCP). (F) HA-100, a pPKC inhibitor, was incubated with LX2NTCP+ sorted cells at a concentration of 7 µM. Flow cytometry analysis was used to assess intensities of NTCP and αSMA. αSMA, alpha smooth muscle actin; FXR, farnesoid X receptor; MFI, mean fluorescence intensity; NTCP, sodium taurocholate cotransporting polypeptide; OCA, obeticholic acid; PKC, protein kinase C; TCA, taurocholic acid.
NTCP neutralizing antibody inhibited LF profile in CCl4 mice model
Others and we have previously shown that liver HSCs express pro-fibrogenic markers and contribute to LF in a CCl4-fibrosis mouse model F.10 However, NTCP’s role in fibrogenesis was not studied previously. The effect of NTCP neutralizing antibody in modifying effects of CCl4-induced fibrogenesis was investigated as described in Materials and methods section. Representative H&E, Sirius red and Masson’s trichrome staining of liver sections are presented in figure 5A. H&E staining from CCl4 livers showed swollen centrilobular hepatocytes and large necrotic areas of high infiltrating inflammatory cells with steatosis. NTCP neutralizing antibody treatment reversed these histological findings with a significant reduction in microvascular and macrovascular steatosis. Sirius red staining showed increased collagen deposition in perisinusoidal areas following CCl4 treatment ; while NTCP neutralizing antibody resulted in a remarkable reduction in the fibrous dense tissue of the stained area. Moreover, using the MTC staining, NTCP neutralizing antibody showed minimal accumulation of thick fibrotic tissue in the CCl4 mice compared with the CCl4 untreated mice. Using the confocal microscopy, we found that NTCP was highly expressed in liver sections of HSCs after the CCl4 injections (figure 5B). Liver biopsies following NTCP neutralizing antibody displayed less HSCs expressing NTCP; results that were quantitated by number of HSCs expressing NTCP/field are presented in figure 5C. These data were associated with a decrease in fibrotic profiles of αSMA (figure 5D) and Col I (figure 5E) both analysed by the RT-PCR assay from isolated pHSCs. Liver inflammatory profiles of serum ALT (figure 5F) and AST levels (figure 5G) showed amelioration following the NTCP neutralizing antibody.

NTCP neutralizing antibody inhibited LF in mice model of CCl4. LF was induced in C57/BL mice for 8 weeks and was compared with naive counterparts (n=10 in each group; experiment repeated three times). NTCP neutralizing antibody was intraperitoneally injected at week 6 of CCl4 for an additional 2 weeks as described in Materials and methods section. Representative sections of immunohistochemical liver staining with (A) H&E, Masson’s trichrome and Sirius red (original magnification 10×). (B) Immunofluorescent visualisation of HSCs on liver sections obtained from untreated and treated mice. HSCs are shown as follows: DAPI conjugated the nucleus (blue), Cy-2 conjugated αSMA (green), Cy-3 conjugated NTCP (red) that quantified in (C). Liver injury markers of (D) αSMA mRNA, (E) collagen mRNA, (F) serum ALT, (G) serum AST, (H) serum TCA and (I) pHSC TCA were assessed. ALT, alanine transaminase; αSMA, alpha smooth muscle actin; AST, aspartate transaminase; LF, liver fibrosis; NTCP, sodium taurocholate cotransporting polypeptide; pHSCs, primary hepatic stellate cells; TCA, taurocholic acid.
Meng et al 23 observed that CCl4-induced liver injury disrupts the BAs enterohepatic circulation and causes the accumulation of BAs in the liver. We therefore assessed effects of NTCP neutralizing antibody on modulating serum and liver HSC concentrations of total BAs as well as TCA. In humans, TCA and glycocholic acid (derivatives of cholic acid) and taurochenodeoxycholic acid and glycochenodeoxycholic acid (derivatives of chenodeoxycholic acid) are the major bile salts. They are roughly equal in concentration.24 Figure 5H shows the expected increase in serum TCA concentration in the CCl4 mice compared with their naive counterparts. The NTCP neutralizing antibody in the CCl4 mice further increases TCA concentrations in serum to twofold (p<0.001), indicating accumulation of TCA in serum. pHSCs obtained from CCl4 livers showed high intracellular concentrations of TCA (124 pM) compared with 53 pM in the naive (figure 5I; p=0.009). These results were in line with elevated transmembrane NTCP expressions (figure 5B) and, in part, explain deterioration in liver histology as shown in figure 5A. NTCP neutralizing antibody inhibited intracellular concentrations of TCA of pHSCs (figure 5I) to levels similar to naive mice and consequently explaining their accumulation in serum and as a result, attenuation of liver injury profiles. Similar patterns of results were obtained from the total BAs assessments in our mice groups and data were summarised in online supplemental figure 5A,B.
Supplemental material
Ob/Ob mice fed with HFD (Ob/ObHFD) showed a reduction in liver injury and metabolic profile following NTCP neutralizing antibody
Ob/Ob HFD exhibit several key NASH features including steatosis and hepatocellular ballooning and develop significant fibrosis.21 We adopted this model in order to confirm data obtained from the effects of NTCP neutralizing antibody on LF with an additional mice model. NTCP neutralizing antibody was intraperitoneally treated for 2 weeks as mentioned in Materials and methods section. Liver biopsies obtained from Ob/Ob HFD showed HSCs expressing high NTCP as indicated by confocal microscopy compared with wild-type (WT) littermates (figure 6A). NTCP neutralizing antibody showed no NTCP-expressing HSCs and data were summarised in figure 6B as number of HSCs expressing NTCP/field. To correlate whether inhibition in NTCP expression is correlated with histopathological outcome, mice livers were stained for H&E and Sirius red staining. While Ob/Ob HFD exhibit steatosis using the H&E stain, NTCP neutralizing antibody-treated mice showed no microscopic visualisation of steatosis and hepatocellular ballooning similar to livers of the WT mice (figure 6C). Moreover, Sirius red staining showed amelioration in LF following NTCP neutralizing antibody, showing no septa compared with Ob/Ob HFD treated with vehicle (figure 6D). Serum liver injury profile; ALT (figure 6E), AST (figure 6F) as well as liver αSMA expressions (figure 6G), all confirmed histology results in attenuation in liver injury parameters following NTCP neutralizing antibody treatment. To further characterise our mice model, we assessed for metabolic markers of lipid and glucose profile. Ob/Ob HFD showed high serum levels of cholesterol (figure 6H) and triglycerides (figure 6I). NTCP neutralizing antibody maintained comparable cholesterol and triglyceride serum levels as the WT untreated mice in Ob/Ob HFD . These results were associated with reductions in fasting blood sugar (figure 6J) and amelioration in glucose tolerance test (figure 6K). All together, the above data indicate that NTCP neutralizing antibody displays an antifibrotic effect and might be a promising and potential target in delaying and inhibiting fibrogenesis through blocking BAs trafficking into the liver.

NTCP neutralizing antibody ameliorates inflammatory, fibrotic and metabolic profile in leptin-deficient (Ob/Ob) mice fed with HFD(Ob/Ob HFD ). LF generated in Ob/Ob mice through HFD (n=10). NTCP neutralizing antibody was intraperitoneally injected twice a week as described in the Materials and methods section. (A) Immunofluorescent visualisation of HSCs on liver sections obtained from untreated and treated mice. HSC cells are shown as follows: DAPI conjugated the nucleus (blue), Cy-3 conjugated αSMA (red), Cy-2 conjugated NTCP (green). (B) NTCP-expressing HSCs were quantified by enumeration of HSCs expressing NTCP/field (HSCsNTCP+). Immunohistochemical liver staining with (C) H&E and (D) Sirius red (original magnification 10×). Liver injury markers of (E) serum ALT, (F) serum AST and (G) liver αSMA were assessed. Metabolic markers of (H) serum cholesterol, (I) serum triglyceride, (J) fasting blood sugar and (K) glucose tolerance test were assessed. ALT, alanine transaminase; αSMA, alpha smooth muscle actin; AST, aspartate transaminase; CHOL, cholestrol; FBS, fasted blood sugar; HFD, high-fat diet; HSCs, hepatic stellate cells; LF, liver fibrosis; NTCP, sodium taurocholate cotransporting polypeptide; TRG, triglycerides; WT, wild type.
Discussion
Our study is the first to describe the presence of NTCP on human liver HSCs obtained from patients with LF. NTCP expression is linearly correlated with fibrosis severity. We also revealed that NTCP mediates BAs uptake in HSCs, triggering their activations. Dysregulation of NTCP through their inhibitions initiated HSC deactivation in an in vitro and in vivo mice model. Targeting NTCP is essential in minimising BAs accumulation in liver and thereby attenuating LF in CCl4-induced mice model. Moreover, we also showed amelioration of lipid and metabolic profile in Ob/Ob HFD following the use of NTCP neutralizing antibody. In consistent with other studies, accumulation of BAs in serum showed no pathological effects on our LF model. Loglio et al 25 showed the use of myrcudex-B (MyrB; an NTCP-selective inhibitor) to elevate BAs in serum of patients with hepatitis delta virus (HDV)-related compensated cirrhosis following 48 weeks with no clinical symptoms typically attributed to cholestasis such pruritus or steatorrhoea. Moreover, MyrB was well tolerated; patients remained fully asymptomatic despite a significant increase of BAs. Blank et al 26 showed that MyrB in patients with LF increased plasma BAs exposure to 19.2-fold without signs of cholestasis. The rise in conjugated BAs was up to 124-fold (TCA). In a study by Vaz et al 27, they present the first patient with NTCP deficiency who was clinically characterised by mild hypotonia with elevated BAs up to 1500 µM with no clinical signs of cholestasis jaundice, pruritus or liver dysfunction.
In mice models, NTCP deficiency protects against obesity and hepatosteatosis in HFD mice and hepatoprotective effects in cholestasis mice.28 Donkers et al 29 showed that NTCP deficiency in mice increased postprandial plasma BAs, which led to a TGR5-independent reduction in body weight, less hepatic steatosis and lower serum cholesterol. Therefore, partial inhibition of hepatic clearance of BAs from portal and systemic blood can be used as a novel strategy to treat obesity and obesity-related hepatosteatosis. Yet, studies focusing on NTCP and BAs regulation under physiological and pathological conditions in LF in HSCs have not been addressed before. In the current study, we showed that NTCP on HSCs is important in uptake of BAs. Indeed, modulation of BAs transport through interfering with:
1. Sorting negative populations of HSCs with no NTCP expressions and study phenotypic and molecular changes compared with HSCs expressed NTCP counterparts.
2. NTCP gene silencing (siRNA) and downexpression (using EGCG).
3. Inhibition of NTCP expression through FXR agonist using OCA. FXR acts as a sensor of intracellular BAs levels and is involved in the coordinate regulation of BAs uptake, synthesis and expression.30 FXR has been suggested to affect NTCP expression through a complex mechanism involving SHP.31
4. Inhibition of NTCP translocation from intracellular to the transmembrane mediated through PKC using HA-100. NCTP undergoes post-translational regulation involving phosphorylation or dephosphorylation, thus mediating its localisation. This post-translational regulation is mediated via signalling pathways involving cyclic AMP, calcium, nitric oxide, phosphoinositide 3-kinase, PKC and protein phosphatases.6
5. NTCP neutralizing antibody.
LX2NTCP−-sorted cells display low αSMA, high FXR (dumped NTCP expressions) and low phosphorylated PKC (inhibited NTCP translocation), as quantified by western blotting. Moreover, these cells exhibited low phosphorylated AKT/mTOR, results that indicate a less activated and proliferated cells. In contrast, LX2NTCP+-sorted cells demonstrated a highly activated population as indicated through αSMA and thus strongly suggest NTCP role in HSCs activation and consequently in fibrogenesis. Our antifibrotic effects of EGCG data were in consistent with other studies. EGCG has antiangiogenic, antioxidant and antifibrotic properties that may have therapeutic potential for the treatment of cirrhosis induced by hepatitis C virus.32 Yu et al 33 showed that EGCG exerts antifibrotic effects in bile duct ligation rats and TGF-β1-stimulated LX-2 cells in vitro via inhibiting the PI3K/Akt/Smad pathway.
We have ample evidence showing attenuation of LF in LX2 cultures (figure 3) and animal models of CCl4 and Ob/Ob HFD as results of inhibition of NTCP through trapping of BAs in peripheral blood. Donkers et al presented NTCP as a novel pharmacological target to prolong BAs presence in blood and peripheral tissues and thereby counteract obesity and diet-induced fatty liver disease.28 Similar achievements were obtained by our laboratory team through attenuating steatosis of livers from Ob/Ob HFD following modulating expression of NTCP. Several mechanisms explained this phenomenon, in which activation of FXR induces Tgr5 gene expression and increases [Ca2+] and cAMP activity to stimulate glucagon-like peptide-1 secretion and improve hepatic glucose and lipid metabolism.34 In contrast to knowledge of the effects of BAs on hepatocytes, the lack of data on the effects of BAs on HSCs was surprising. Here, we uncovered new pathways associated with NTCP and BAs uptake in HSCs. Serum TCA concentration could be an additional marker if not more sensitive than serum AST/ALT activity for liver injury. Antagonising NTCP through inhibiting its expression and translocation in HSCs may serve as an important therapeutic strategy for preventing disease progression.
Data availability statement
Data are available upon reasonable request. All data relevant to the study are included in the article or uploaded as supplementary information and protocols.
Ethics statements
Patient consent for publication
Ethics approval
All human experiments were performed at the Hadassah Medical Centre according to the Declaration of Helsinki: HMO-0605-16. Ethical approval for mice experiments from the Hebrew University of Jerusalem: MD-18-15494-3 for the CCl4 mice model and MD-16-14574-3 for the leptin-deficient mice (Ob/Ob).
References
Supplementary materials
Supplementary Data
This web only file has been produced by the BMJ Publishing Group from an electronic file supplied by the author(s) and has not been edited for content.
Footnotes
AS and JA are joint first authors.
AS and JA contributed equally.
Contributors AS performed the experiments, figures and statistical analysis; JA designed the experiment approach, supervised the research and wrote the manuscript; YL revised the manuscript; RS drafted the manuscript, revised experimental analysis and provided resources.
Funding The authors have not declared a specific grant for this research from any funding agency in the public, commercial or not-for-profit sectors.
Competing interests None declared.
Provenance and peer review Not commissioned; externally peer reviewed.
Supplemental material This content has been supplied by the author(s). It has not been vetted by BMJ Publishing Group Limited (BMJ) and may not have been peer-reviewed. Any opinions or recommendations discussed are solely those of the author(s) and are not endorsed by BMJ. BMJ disclaims all liability and responsibility arising from any reliance placed on the content. Where the content includes any translated material, BMJ does not warrant the accuracy and reliability of the translations (including but not limited to local regulations, clinical guidelines, terminology, drug names and drug dosages), and is not responsible for any error and/or omissions arising from translation and adaptation or otherwise.