Article Text

Abstract
Objective Recent studies have provided insights into the gut microbiota in autism spectrum disorder (ASD); however, these studies were restricted owing to limited sampling at the unitary stage of childhood. Herein, we aimed to reveal developmental characteristics of gut microbiota in a large cohort of subjects with ASD combined with interindividual factors impacting gut microbiota.
Design A large cohort of 773 subjects with ASD (aged 16 months to 19 years), 429 neurotypical (NT) development subjects (aged 11 months to 15 years) were emolyed to determine the dynamics change of gut microbiota across different ages using 16S rRNA sequencing.
Result In subjects with ASD, we observed a distinct but progressive deviation in the development of gut microbiota characterised by persistently decreased alpha diversity, early unsustainable immature microbiota, altered aboudance of 20 operational taxonomic units (OTUs), decreased taxon detection rate and 325 deregulated microbial metabolic functions with age-dependent patterns. We further revealed microbial relationships that have changed extensively in ASD before 3 years of age, which were associated with the severity of behaviour, sleep and GI symptoms in the ASD group. This analysis demonstrated that a signature of the combination of 2 OTUs, Veillonella and Enterobacteriaceae, and 17 microbial metabolic functions efficiently discriminated ASD from NT subjects in both the discovery (area under the curve (AUC)=0.86), and validation 1 (AUC=0.78), 2 (AUC=0.82) and 3 (AUC=0.67) sets.
Conclusion Our large cohort combined with clinical symptom analysis highlights the key regulator of gut microbiota in the pathogenesis of ASD and emphasises the importance of monitoring and targeting the gut microbiome in future clinical applications of ASD.
- Gut microbiota
- Autism spectrum disorder
- Neurotypical
Data availability statement
Data are available on reasonable request. All data relevant to the study are included in the article or uploaded as supplementary information. All 16S rRNA raw data have been submitted to China National GeneBank DataBase, CNGBdb (accession number, CNP0001512).
This is an open access article distributed in accordance with the Creative Commons Attribution Non Commercial (CC BY-NC 4.0) license, which permits others to distribute, remix, adapt, build upon this work non-commercially, and license their derivative works on different terms, provided the original work is properly cited, appropriate credit is given, any changes made indicated, and the use is non-commercial. See: http://creativecommons.org/licenses/by-nc/4.0/.
Statistics from Altmetric.com
Significance of this study
What is already known on this subject?
Increasing evidences have provided insights into the gut microbiota in autism spectrum disorder (ASD); however, these studies were restricted owing to the small sample size or limited sampling at the unitary stage of childhood.
Dynamic characteristics of gut microbiome development in children with ASD associated with clinical symptoms remained unknown.
What are the new findings?
We first reported that children with ASD displayed a progressive deviation in development of gut microbiota when compared with that of the neurotypical group based on a large cohort of stool samples.
In subjects with ASD, deviated development in ASD was manifested as persistently decreased alpha diversity, early unsustainable and immature microbiota, difficulty or obstruction in the colonisation of common foundational bacterial groups in the early life stage and altered microbial relationships.
We concluded that several bacterial taxa, bacterial metabolic function and alteration of microbial relationship that were associated with the severity of behaviour, sleep and GI symptoms in children with ASD.
Microbiota-based disease diagnostic models showed admired efficiency across age and region.
How might it impact on clinical practice in the foreseeable future?
Our findings provide admired visible and interpretable microbiota-based disease diagnostic models for the prevention and treatment of ASD.
Introduction
Autism spectrum disorder (ASD) is a group of neurodevelopmental disorders characterised by repetitive behaviours and impairments in social communication and interaction.1 Since Leo Kanner first described early infantile autism clinically,2 the worldwide morbidity of ASD has increased, ranging between 0.75%3 and 1.85%,4 and continues growing. Accumulating evidences have revealed that both genetic (eg, rare inherited and de novo variants)5 and environmental factors (eg, perinatal events)6 are potential triggers of ASD.7 An encouraging hypothesis recently proposed that gut microbiota may be an important factor in a broad range of neurological and psychiatric disorders and diseases.8 Although recent studies have provided insights into the gut microbiota in ASD, most of these studies have been restricted owing to the small sample size or limited sampling at the unitary stage of childhood.9 10 Accordingly, whether there is a real difference in the gut microbiota between healthy individuals and those with ASD has been questioned.11
The symbiotic microbiota affects the host nervous system development through multiple forms across different host life stages, such as via the maternal gut-immune axis in the sterile fetal period12 13 or the gut microbiota-brain axis in the postpartum microbiota involved in host development.14 Recently, Roswall et al reported that gut microbiota of healthy children matured along similar trajectories at different speeds, and individual dynamics of gut microbiota may indicate sensitive points for gut microbiota development in early life.15 To further explore the gut microbiota profile in children with ASD, we used a large cohort of 1222 subjects to determine the dynamics change of gut microbiota across different age. We first identified the effects of multiple factors, including age, region, sex, clinical comorbidity, perinatal events and other factors on the gut microbiota of the present cohort. Then, using our multiregional large cohort and clinical metadata, we exmined the impact of both population-wide and interindividual factors on the gut microbiota and determined whether alterations in gut microbiota impact the pathophysiological state of autism.
Methods
Cohort description and study subjects
In toal, 1222 participants from 25 provinces of China (mainly from Hunan, Shandong, Zhejiang and Guangdong) including 773 participants with clinical definition as ASD (aged between 16 months and 19 years) and 429 neurotypical (NT) children (aged between 11 months and 15 years) and 20 unrelated healthy adults (aged 16–24 years) were recruited (online supplemental table S1, S2). Informed consent was obtained from all the guardians of the participants for the collection of stool samples and trial information. Table 1 lists a detailed demographic and age distribution for all samples in both ASD and NT groups. Other detailed information about two cohorts and validation cohort 1–310 16 are shown in online supplemental methods 1. The usage of antibiotics in the past 3 months before sampling was recorded in detail (online supplemental table S1). The detailed clinical evaluation standard is shown in the online supplemental table S3. The summaries of age, demographic, clinical and district characteristics are provided in online supplemental table S2 and S4.
Supplemental material
Supplemental material
Information regarding detailed demographic and age distribution for all samples in both ASD and NT group
16S rRNA gene sequencing
PCR amplification for V4 region of bacterial 16S rRNA gene was performed. Sample-specific paired-end 6 bp barcodes were incorporated into the TrueSeq adaptors for multiplex sequencing; 2×150 bp pair-end sequencing was performed using the Illlumina NovoSeq6000 platform at GUHE Info Technology (Hangzhou, China).
Bioinformatics and statistical analysis
The criteria for sequences filter are detailed in online supplemental methods 1. The resultant clean reads were blasted, dereplicated, clustered and chimaera detected using VSEARCH (V.2.4.4) against the SILVA138 database.17 Sequences with similarity ≥97% were assembled into operational taxonomic unit (OTU) using Quantitative Insights Into Microbial Ecology (QIIME2, V.2020.6) pipeline. Microbial functions were predicted by PICRUSt (Phylogenetic investigation of communities by reconstruction of unobserved states). The output file was further analysed using Statistical Analysis of Metagenomic Profiles (STAMP) software package V.2.1.3. Host multifactorial effects on gut microbiota was assessed by EnvFit based on NMDS with Bray-Curtis dissimilarity. MaAslin218 was used to determine multivariable associations via generalised linear regression between the relative abundance of microbial signatures and metadata.
Random forest analysis was performed to discriminate the samples from different groups using the R package ‘randomForest’ with 1000 trees and all default settings off.19 20 The generalisation error was estimated using 10-fold cross-validation. SHapley Additive exPlanations (SHAP) value was evaluated according to the unified framework proposed by Scott M. Lundberg and Su-In Lee21 to interpret the kind of host factor that affected the selected feature. The decision tree was visualised using treeheatr R package.22
Definition of the 30 age-discriminatory bacterial taxa
Age-discriminatory bacterial taxa list containing feature importance was obtained using the random forests machine learning algorithm proposed by Subramanian et al.23 The relative abundance of OTUs was then regressed against their physiological age using random forest regression (default parameters), and the most 30 taxa were extracted to map the developmental spectrum of gut microbiota in both ASD and NT.
Deep neural network for microbiota age quantification
Microbiota age was quantified using a neural network approach similar to that described by Galkin et al.24 All deep neural networks (DNNs) were implemented using the Python V.3.6 Keras library with Tensorflow backend. The detail process of mode constuction is described in online supplemental methods 1.
Taxa detection rate analysis
Taxa with at least 10 samples were piped into the detection rate analysis. The detection rate for each taxon is defined as:

The detection rate in the NT and ASD cohorts was calculated and compared using Fisher’s exact test.
Absolute microbial abundance change analysis
The absolute microbial abundance change was analysed following the previous method.25 False discovery rate (FDR) q value <0.05 were used to filter significantly changed taxa.
Microbial relationship alteration analysis
Alteration in the paired microbial relationship between the NT and ASD groups, and alteration of microbial relationship with increasing ASD score were derived using PM2RA (profile monitoring for microbial relationship alteration).26 The detailed analysis method is shown in online supplemental methods 1.
Results
General characteristics of the gut microbiota and clinical information of the cohort
To characterise the gut microbiota profile in ASD across age, we enrolled 773 subjects clinically diagnosed with ASD (aged 16 months to 19 years), 429 NT subjects (aged 11 months to 15 years) (figure 1A and B and online supplemental table S1-S4). The 20 adults were observational cohort, mainly for monitoring the development of both alpha diversity and gut microbiota age.
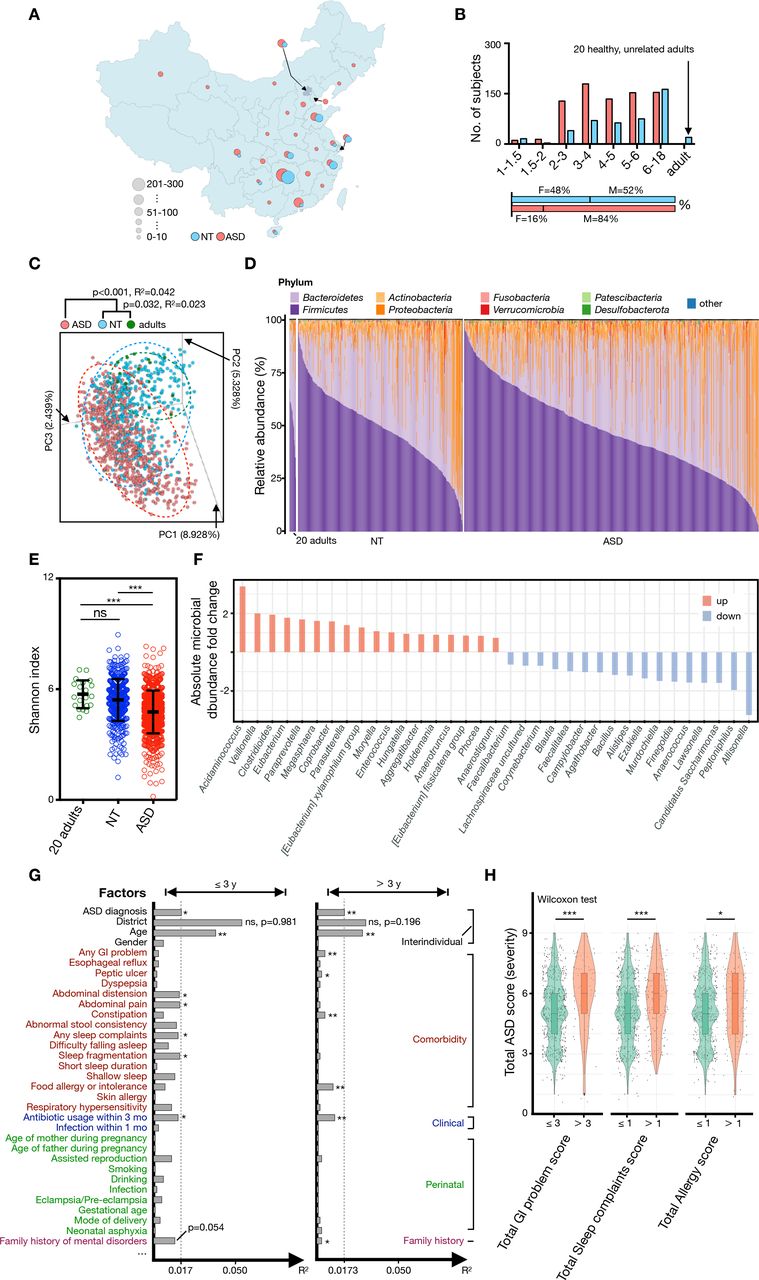
General characteristics of gut microbiota and clinical information of cohorts. (A) Geographical features of residence of the studied cohort. Subjects with ASD (n=773) were from 25 provinces of China, while NT subjects (n=449, 20 adults included) were from 14 provinces of China. (B) Histogram showing the summative distributions of grouped subjects according to age and gender. (C) Unweighted PCA at OTU level (for PC1, PC2 and PC3) showed that the gut microbial composition of subjects with ASD was separated from that of NT and healthy adults. The p values between each group were tested using mutational multivariate analysis of variance (Adonis). (D) Phylum-level distribution of gut microbiota in ASD, NT and healthy adults. (E) The Shannon diversity index of each group or age category. The mean values±SEM are plotted. One-way analysis of variance, ***p<0.0001. (F) Diverging bar chart of absolute microbial abundance changes by Analysis of Compositions of Microbiomes with Bias Correction (ANCOM-BC) between NT and ASD. (G) Horizontal bars indicate the impact (R2) of each host factor on gut microbiota variations. Subjects were subdivided into two groups (group 1: age ≤3 years or group 2: age >3 years), and the effect of each host factor was determined by EnvFit (vegan). Factors were roughly classified according to metadata categories, and the factors with significant effects are indicaed with an asterisk (FDR adjusted p value, *p<0.05 and **p<0.01). (H) The severity of ASD showed a significant correlation with severity of GI (Wilcoxon signed-rank, p=8.274e-06), sleep disorder (Wilcoxon signed-rank test, p=0.0001537) and allergy (Wilcoxon signed-rank test, p=0.03008). ASD, autism spectrum disorder; NT, neurotypical; ns, not significant; OTU, operational taxonomic unit; PC, principal component; PCA, principal component analysis.
Consistent with previous studies,9 10 16 although subjects with ASD were separated from NT and healthy adults (figure 1C), obvious variations in microbial composition were still detected among individuals in the same group (figure 1C and D). At the phylum level, Firmicutes, Bacteroidetes, Proteobacteria and Actinobacteria were dominant in the different groupings (figure 1D). The alpha diversity of gut microbiota in the ASD group showed a significant decrease when compared with those of the NT and adult groups (figure 1E and online supplemental table S5); 18 and 17 genera showed elevated or decreased absolute abundance in the ASD group relative to the NT group, respectively (figure 1F). The gut microbiome has been reported to be affected by multiple factors, such as age, region, food, gender, clinical comorbidity and perinatal factors.27 28 Thus, we further analysed the effects of these factors on the gut microbiota of the present cohort. A total of 12 host factors were detected to significantly affect the gut microbiota of children under 3 years of age (≤3 years) or/and more than 3 years of age (>3 years) (figure 1G and online supplemental table S6). Unsurprisingly, regional differences provided the greatest contribution (≤3 years, R2=0.0544; >3 years, R2=0.0295) of gut microbiota variations across all factors but with no significance difference (figure 1G). Consistent with a recent analysis of gut microbiota in children with ASD,29 age afforded the second highest variance in gut microbiota in ASD, although the effect decreased after 3 years of age (figure 1G). The reduced covariance of age from 0.0384 (≤3 years) to 0.0283 (>3 years) could be attributed to the development of the gut microbiota from a highly chaotic and changeable state to a relatively mature state, additionally, we noted that the clinical conditions of food allergy or intolerance of individual significantly affected gut microbiota only in subjects over 3 years of age (figure 1G). At this age bracket, their diet, usually transformed from a diet based on dairy products to concentrate on fewer food types and became diverse, can be largely affected by the food susceptibility. In the present cohort, the incidence rates of comorbidities were associated with ASD (online supplemental table S1 and S7) especially the GI problems, approximately sixfold higher in the ASD group (63.9%) than in the NT group (10.7%) (online supplemental table S7). Impressively, children with ASD who presents serious GI (scores >3), sleep (scores >1) and allergy problems (scores >1) showed more severe ASD symptoms (figure 1H). To investigate which bacteria are associated with GI problems in ASD, we further compared differential bacteria between ASD patients with/without GI problems. We identified that 12 genera showed significant differential relative abundance between ASD with/without GI problems, and the most common comorbidity, that is, GI problems presenting a significant positive association with the differential bacteria, such as Clostridia Vadin BB60 group, UBA1819 and Erysopelatoclostridium (online supplemental figure S1A). Moreover, a small number of differential genera were associated with social retardation, language retardation and total ASD score (online supplemental figure S1B). The analysis highlighted the interaction between gut microbiota and other host factors in the pathological process of ASD.
Supplemental material
Deviated development in diversity and microbial relationship of gut microbiota in ASD group
To explore the effect of age on gut microbiota, we further tracked the principal component spectrum with age and described two simultaneously evolving temporal organisations of gut microbiota with different origins (figure 2). Age-mediated changes in gut microbiota mainly contributed to the first axis of taxonomy-based principal components, and the diagnosis of ASD contributed to the second and third axes (figure 2A). Other tracking methods according to the significant gut microbiota affecting factors showed no potential rules (online supplemental figure S2A-R). The development of gut microbiota is the replacement of dominant bacteria,30 31 and the spatiotemporal dislocation of functional bacterial groups indicates immaturity.23 32 Using the random forests machine learning algorithm,23 we observed that the relative abundance of 27 taxa from among the top 30 age-discriminatory bacterial taxa, were relatively consistent in the ASD and NT groups (figure 2B). Unlike those in children with immature or stunted gut microbiota,23 33 only taxa Veillonella ratti (OTU 359954), Clostridium (OTU 3203801) and Enterobacter (OTU 2119418) were significantly disturbed in children with ASD (especially in subjects aged >3 years) (figure 2B and online supplemental figure S3A-C). It is noteworthy that subjects with a higher abundance of age-discriminatory taxa were more likely to be distributed close to the ends of axis PC1 (online supplemental figure S4A-C), which was consistent with the age-related subject distribution in PCA (figure 2A).

Deviated developmental spectrum of gut microbiota in children with ASD. (A) Three-dimensional diagram of unweighted PCA based on OTU-level Bray-Curtis dissimilarity. Plots of each sample were dyed gradients according to their physiological age. Arrows with gradient colours showed the developmental trends of the gut microbial community in ASD (red) and NT (blue) from young to old. (B) Heat map showed the mean relative abundance changes (10-based logarithm) of 30 age-discriminatory bacterial taxa across the physiological ages of subjects. (C) Predictions of microbiota age in both ASD, NT and adult subjects (above). Each circle represents an individual faecal sample, and the curves are a smoothed linear fit between the microbiota age and physiological age. The values of physiological age minus (−) predicted microbiota age of each group and the microbiota-for-age Z score (MAZ) of the subjects with ASD are shown in the Figure 2C chart below. Mean values±SEM are shown. (D) Shannon diversity index with age. (E) The taxon detection rate difference between NT and ASD remained constant with age. The detection rate curves of Bifidobacterium, Veillonella, Faecalibacterium, Lachnospira and Blautia are highlighted. Arrows indicated the time points of a specific bacteria with an abnormally fluctuating detection rate. ASD, autism spectrum disorder; MAZ, microbiota-for-age Z score; NT, neurotypical; OTU, operational taxonomic unit; PC, principal component; PCA, principal component analysis.

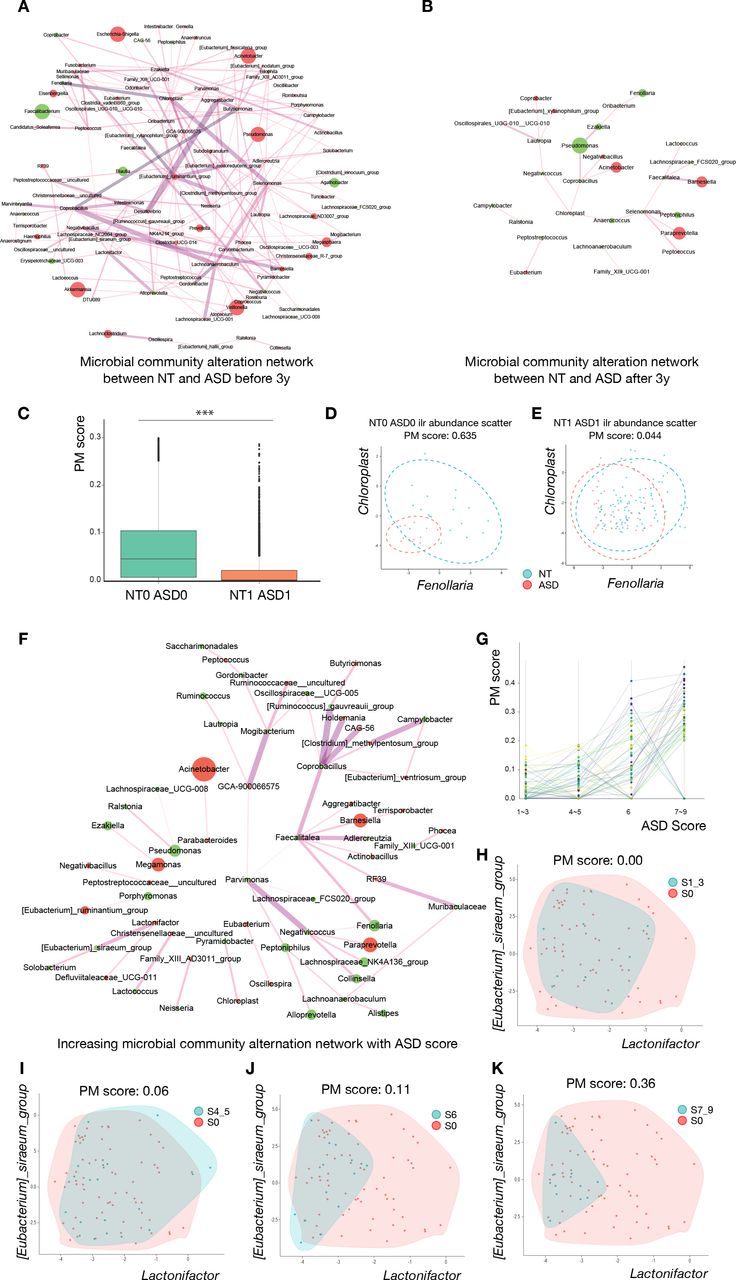
Deviated development in the microbial relationship in children with ASD. (A) Altered microbial community network between NT and ASD before 3 years of age. (B) Altered microbial community network between NT and ASD after 3 years of age. (C) Box plot of profile monitoring (PM) scores between NT and ASD at different ages. The PM score, that is, the microbial relationship alteration, is significantly reduced in NT subjects and children with ASD after 3 years of age when compared with that for children under 3 years of age (Wilcoxon signed-rank test, p<2.2e-16). (D, E) The isometric log-ratio transformed the abundance scatter plot of Fenollaria and Chloroplast before and after 3 years of age, respectively. The relationship beween these two taxa is significantly altered between NT and ASD groups under 3 years of age. This difference disappeared in NT subjects and children with ASD after 3 years of age. (F) Expanded alteration in the microbial community relationship with increasing ASD score. The edge width is proportional to the linear slope in the regression of the PM score to ASD symptom severity. (G) The identified PM score for 54 altered genera relationships is shown in figure 3F, which increased with ASD severity. (H–K) The isometric log-ratio transformed abundance scatter plot of (Ruminococcus)_gauvreauii_group and Coprobacillus in different ASD symptom severity groups. The microbial community alteration networks in A, B and F were derived using PM2RA. The edge width represented the interaction of the PM score. The node size represents the relative abundance change, as well as the label of the nodes specified taxonomic affiliation. The red node represents the increase of taxon abundance in ASD, and the green nodes represent the decrease. p<0.05 *, p<0.01 **, p<0.001 *** and p<0.0001 ****. ASD, autism spectrum disorder; NT, neurotypical.

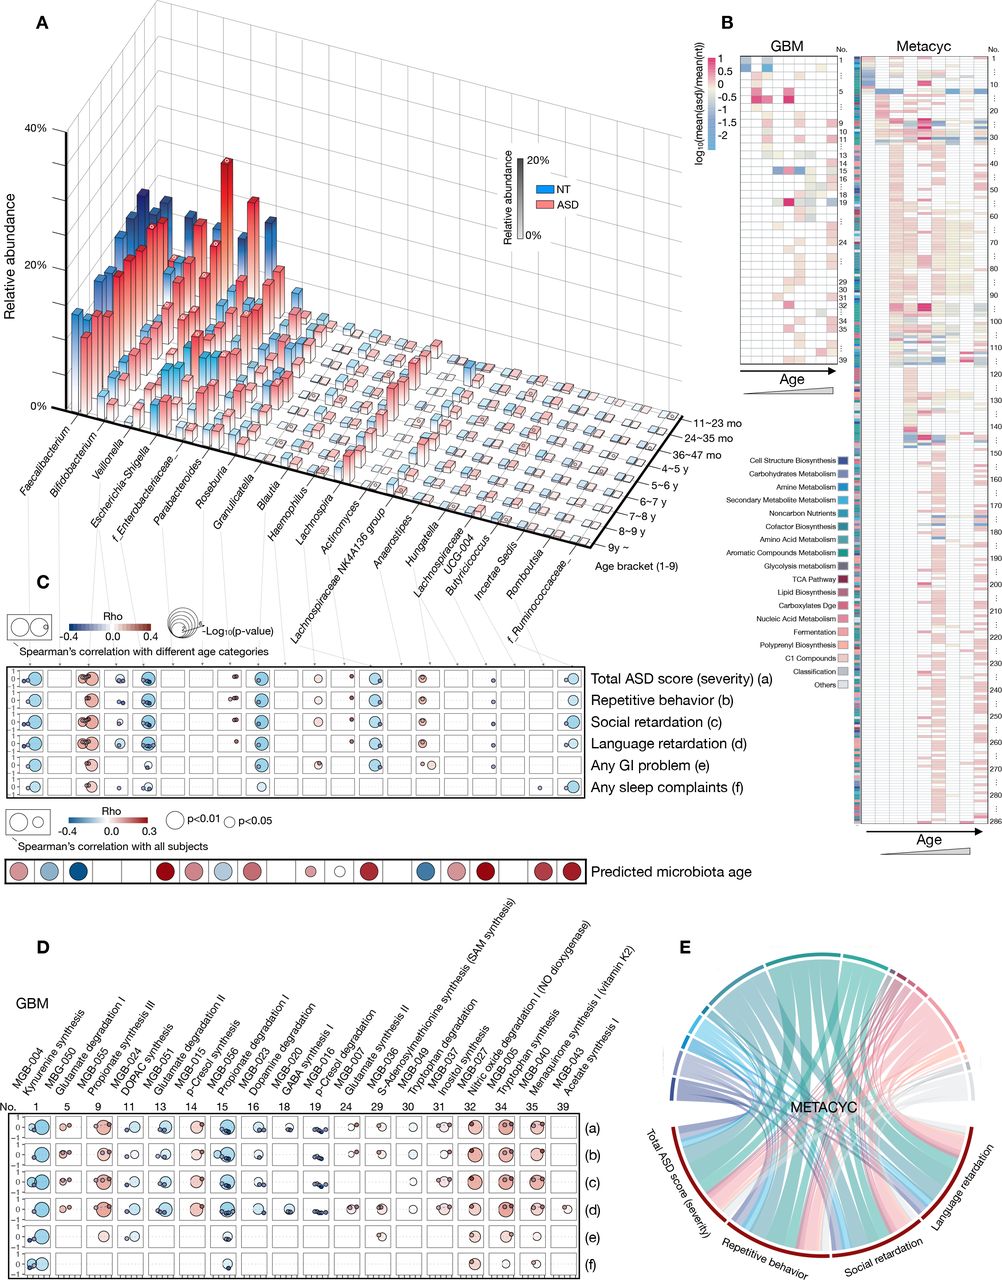
Age-specific taxonomic and microbial-metabolic signatures in the ASD group. (A) Column chart illustrating the average relative abundance of the 20 taxa with significant abundance changes across different age brackets between ASD and NT (20 adults included). Only columns with significant abundance changes at a specific age are circled on their top surface (based on the Kruskal-Wallis test, and p values were detailed in online supplemental table S13. (B) Heat map showing the significant changes in microbial metabolic functions across age. Functions annotated as GBM (left) or a member of the biocycle (METACYC, right) were exhibited (based on the Kruskal-Wallis test, and p values are shown in online supplemental table S14 and S15). (C–E) Relationship between microbial taxa/function and clinical phenotypes. Correlations with p<0.05 were visualised based on Spearman’s correlation coefficient. The circle size represents both the grouping schemes used to calculate the correlation and the degree of significance (only in the two bigger circles). From left to right, the two bigger circles represent the grouping schemes ≤3 years or >3 years, and the small circles represent the age brackets according to the age axis of figure 3A. Correlations between the significantly altered microbial genera and predicted microbiota age were obtained from all subjects (C). To show the relationships between GBM and phenotype more intuitively, functions with significant correlations between phenotypes (all four ASD-related phenotypes) among subjects aged ≤3 years or >3 years or ≥4 individual subdivided age brackets are visualised (D). Correlations between METACYC and phenotypes are shown as circles (E). The values of rho and the p value of each taxa/GMB/METACYC for each phenotype are shown in online supplemental table S16–S18. ASD, autism spectrum disorder; GBM, gut-brain modules; NT, neurotypical.
To further evaluate the relationship between gut microbiota and age, we conducted a DNN to quantify the physiological age based on the gut microbiota (see ‘Methods’ section). The predicted microbiota age linearly fitted the physiological age, with R2=0.04373 in the NT group and R2=0.08405 in the ASD group (figure 2C, top panel). According to the method developed by Subramanian et al,23 developmental disorders of gut microbiota were investigated in two dimensions: (1) deviations between the predicted microbiota age and their physiological age and (2) microbiota-for-age Z score (MAZ) of each subject with ASD. Regardless of whether the predicted microbiota age was compared among themselves or with NT (ASD cohort only and for MAZ calculation), only early unsustainable immaturity (18–20, 20–22, 22–24, 26–28 and 28–30 months) of gut microbiota in the subjects with ASD were found (figure 2C, bottom panel and online supplemental table S8). The validation cohort 1 showed similar encounter in the development of gut microbiota (24–35 and 36–47 months) (online supplemental figure S4D). Due to the inconsistent age distribution between the ASD and NT groups, especially the lack of samples at younger ages, validation cohort 2 did not show similar changes when compared with the current cohort and validation cohort 1 (online supplemental figure S4E).
Alpha diversity in the NT group increased rapidly from newborn to 2–3 years of age and entered a relatively stable stage (figure 2D), consistent with findings in a recent longitudinal birth cohort.15 However, the ASD group showed a mostly persistent decrease in bacterial alpha diversity (especially the Shannon diversity index) (figure 2D, online supplemental table S5). In line with the alpha diversity analysis across age, the genera detection rate with age was always lower in the ASD group than that in the NT group, and the detection rates of the NT group-enriched genus Blautia and Faecalibacterium fluctuated (figure 2E, online supplemental table S9 and S10). The genera detection rate in the ASD and NT groups after 3 years of age was associated with the rate before 3 years of age (online supplemental figure S5A). Accordingly, the difference in the genera detection rate between the NT and ASD groups remained constant along with age (figure 2E, online supplemental figure S5B) and online supplemental table S10). The histogram presenting changes in absolute microbial abundance changes indicated that the gut microbiome of subjects with ASD showed partial recovery after 3 years of age (online supplemental figure S5C, online supplemental table S11). The results suggested the challenges or hindrances in the colonisation of common foundational bacterial groups in subjects with ASD during early life stages.
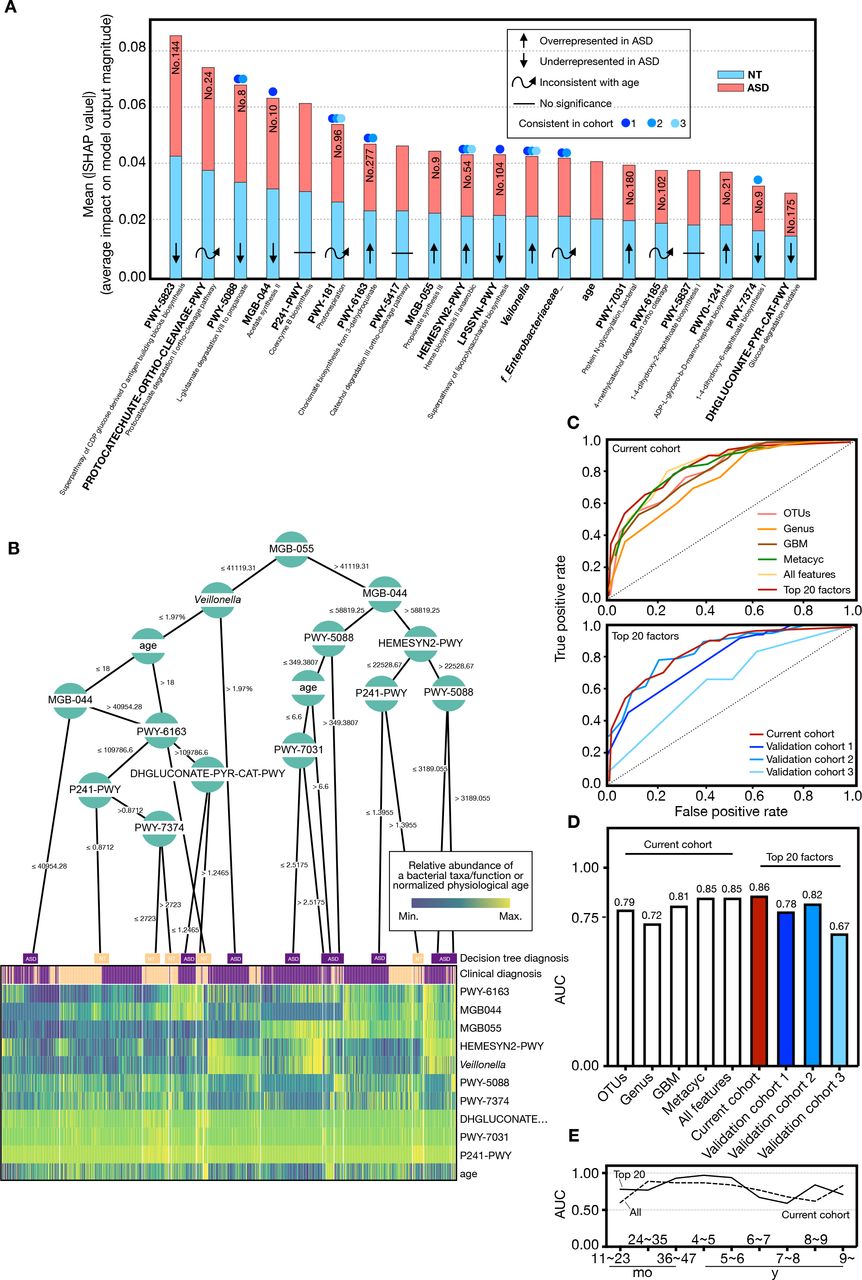
Diagnostic potential of gut microbiota in current and validation sets. (A) Microbial taxonomic and metabolic markers for detecting subjects with ASD were identified from random-forest classifiers based on the genus, GBM and METACYC. The x-axis represents the mean SHAP value (average impact on model output magnitude) of the features to the model prediction in each test (see ‘Methods’ section). The length of the column represents the total SHAP values of a specific marker by summing the SHAP value of ASD (red) and NT (blue). (B) A decision tree heat map for predicting whether a subject is diagnosed with ASD (purple) or NT (yellow). The heat map colours indicate the value of a sample relative to the rest of the group for each feature. (C) Performance of the classifiers using AUCs in both current (solid red line) and validation (solid blue line) sets. (D) AUC values in different prediction groups. (E) AUC values of all features and top 20 features in the current cohort across age brackets. AUC, area under the curve; ASD, autism spectrum disorder; GBM, gut-brain modules; NT, neurotypical; OTU, operational taxonomic unit.
Some studies have indicated that gut microbiota evolves towards an adult-like composition 2–3 years after birth.34 35 Revealing the relationship alteration (RA) of gut microbiota between groups of subjects provides additional ecological perspective.36 37 To reveal the microbial RA between two groups with age, using our newly developed analysis tooling called PM2RA,26 we quantified the RA between ASD and NT groups before and after 3 years of age, respectively. As shown in figure 3A, RAs between ASD and NT groups showed complex alterations before 3 years of age; however, after 3 years of age, RAs between the two groups were significantly reduced, and only a few RAs occurred (figure 3B). Moreover, the microbial co-occurrence network showed a similar alteration in the microbial network to that observed in the PM2RA method (online supplemental figure S6A-B). Consistent with these results, we observed that the PM score which quantified the total RAs between NT and ASD after 3 years of age was also significantly reduced when compared with that before 3 years of age (figure 3C, online supplemental table S12). For example, the RA of Chloroplast and Fenollaria between the NT subjects and subjects with ASD under 3 years of age was considerably higher than after 3 years of age (figure 3D and E). RAs between the NT group before and after 3 years of age were less complex than those between the ASD group before and after 3 years of age (online supplemental figure S6C-D), suggesting that the relationship between microbes in the ASD group were greatly altered with age. For example, the RA between Desulfovibrio and Ezakiella remained mostly unchanged in the NT group before and after 3 years of age (online supplemental figure S6E), however, the RA between the two microbes were considerably altered, and the PM score was substantially higher than that of NT (online supplemental figure S6F). Given that Veillonella showed different dynamic changes with age in ASD and NT (online supplemental figure S7A), we further compared the relationship between Veillonella and other microbes in ASD and NT groups. Consistent with the whole relationship change with age, correlations between Veillonella and other bacteria in the NT group showed a simpler microbial network with age (online supplemental figure S7B-C), however, ASD showed a substantially more complicated microbial network with age (online supplemental figure S7D-E), which implies that Veillonella partially contributed to microbiota immaturity in the ASD group and played an important role in the microbiota development.
To further identify the correlation of clinical symptoms of ASD with RA, we compared RA in ASD groups with different clinical symptoms, and observed that the alteration in the microbial relationship increased with the severity of ASD (figure 3F). Notably, the total PM score of 54 paired microbial relationships gradually increased with the aggravation of clinical ASD symptoms (figure 3G and online supplemental table S12). For example, the PM score for RA of (Eubacterium)_siraeum and Lactonifactor increased from 0.00 to 0. 36, along with an increase in the ASD score (figure 3H–K).
In summary, the above analysis suggested that ASD and NT groups were not synchronised in gut microbiota development. Furthermore, we noted that the development of gut microbiota in subjects with ASD deviated from NT development in terms of bacterial diversity, colonisation and microbial relationships.
Significant changes in microbial taxa and metabolic features across ages
Next, we deconstructed whether the signatures of gut microbiota between the two groups in an age-based dependent manner. In result, we observed that 20 microbial taxa showed significant different abundance across age between ASD and NT groups (figure 4). The total abundances of these 20 microbial taxa in different age brackets ranged beween 33.41% and 65.90% in the NT group and 35.69% and 62.41% in the ASD group, representing the main proportion of the gut microbiota (online supplemental table S13). The Enterobacteriaceae family, Bifidobacterium genus and Lachnospiraceae NK4A136 group fluctuated substantially across different age brackets (figure 4A). Although Veillonella only showed a non-statistical increase in abundance in age brackets 7 and 8 years (figure 4A), it was positively correlated with the severity of ASD in subjects with >4 years of age (figure 4C, online supplemental figure S8A). Impressively, the abundance changes of Veillonella between ASD and NT groups was significantly negatively associated with the clinical diagnosis and age (online supplemental figure S9A). In agreement with its reported neuroactive potential,38 Faecalibacterium was inversely correlated with ASD severity (mainly in subjects >3 years), while GI and sleep problems were significantly associated with age (online supplemental figure S9A). Unlike the previously reported loss of probiotics in children with ASD,39 the relative abundance of Bifidobacterium flattened before the age of 3 years between the two groups, significantly increasing in the ASD group at the age of 4–5 years (figure 4A and online supplemental table S13).
To further investigate the potential microbial metabolic function in ASD across age brackets, we compared the differential microbial function of ASD and NT groups. Accordingly, we found 325 microbial-metabolic functions, 39 functions annotated as gut-brain modules (GBM) and 286 functions as members of the biocycle (METACYC), with a significant shift across age (figure 4B). Compared with dynamic changes in taxa, variations in microbial functions exhibited more obvious age dependence (figure 4B). The influence of early childhood on gut microbial function was mainly attributed to the conversion of the diet structure from breast milk or formula milk to complementary food.40 Correspondingly, in the present cohort, the shift in cofactor biosynthesis and carbohydrate metabolic pathways were differentially enriched in the age brackets of 3–9 years (figure 4B and online supplemental table S14-S15). Furthermore, we revealed changes in the abundances of gut microbial taxa, such as Veillonella, Faecalibacterium and Blautia, as well as functions, such as MGB-004, MGB-027, PWY−7374, PWY−7254 and CODH−PWY, that were significantly related to the subjects’ GI and sleep problems (online supplemental table S16-S18).
Although with moderate complexities, correlation networks between microbial functions and phenotypes were more closely interconnected with the clinical manifestations of ASD (online supplemental figure S8B). For example, glutamate degradation I (MGB-050) was positively correlated with the severity of both clinical manifestations before 3 years of age (figure 4D and online supplemental table S17). In contrast, glutamate degradation II (MGB-051) was inversely related to ASD severity in subjects after 3 years of age. From a higher level of functional annotation, functions (METACYC) correlated with the severity of ASD, with significance mainly in amino acid metabolism, aromatic compound metabolism and cofactor biosynthesis (figure 4E). Additionally, changes in the aboudance of MGB-56, MGB-004, PWY-5188, PWY-5189 and X1CMET2-PWY-N10 between two groups showed a significant association with the clinical condition of ASD (online supplemental figure S9B and S9C). In brief, the analysis further suggested that gut microbes may involve in the pathological process of ASD via deregulation of various metabolic activities.
Gut microbiota as biomarkers for ASD and NT
To define ASD-associated microbes or metabolic pathway markers, we devised a random forest model to correlate ASD and NT with gut microbiota data at OTUs, genus, GBM and METACYC levels in the current and validation cohorts. A unified framework for interpreting predictions, namely, SHAP, was conducted (see ‘Method’ section). Given that the microbial ecosystem differed dramatically in subjects before and after 3 years of age, we first defined two sets of markers for children ≤3 years of age and >3 years of age, respectively (online supplemental figure S10A-D). The predictive accuracy in the group ≤ or >3 years of age is 0.83 and 0.86 AUC, respectively. To provide a prediction tool for clinical applicability in all children, we selected the 20 top features with the highest model-building importance value and lowest inner subcategory bias to re-establish the prediction model. All 20 features showed no intergroup specificity, and in part, changes in aboudance between the two groups remained consistent in the validation cohorts (figure 5A and online supplemental figure S11A-C). Each feature had an equal importance value to the ASD (red) or NT (blue), and the contribution of the subjects’ ages was at the middle level (figure 5A).
To create an interpretable decision model with greater practical clinical value, we visualised a typical decision tree (figure 5B) using treeheatr (see ‘Methods’ section). The metabolic pathway of propionate synthesis III (MGB-055, no. 9), which showed significantly increased abundance changes in the ASD cohort (age brackets 3, 6 and 9) (figure 4B and online supplemental table S14), was placed at the top of the tree and tagged with a cut-off value (accounted abundance, 41119.31) (figure 5B). Other features were also distributed on the tree’s leaf nodes and branched with specific cut-off values. The MGB-055 abundance value >41 119.31 distinguished more subjects with ASD at the left bottom of the tree, consistent with the finding in an animal study indicating that propionic acid may cause autism-like behaviours in mice.41 Almost all subjects with an abnormal abundance of MGB-055, MGB-044 and PWY-5088 which were annotated to metabolic activities of intestinal microbes were addressed to the ASD group (figure 5B).
As most microbial features were age-dependent, we incorporated individual physiological ages into the performance verification. At the OTU level, our model showed 56%–79% accuracy in the current and validation sets, respectively (figure 5C–5D, online supplemental figure S10E-J). The model based on genus level was slightly inferior, with 62%–72% accuracy. The accuracy of the GBM and METACYC models in distinguishing ASD from NT reached 81% (GBM model in the current set), 64%–82% (GBM model in validation sets), 85% (METACYC model in current set) and 62%–90% (METACYC model in the validation sets). We then mixed all features and evaluated their detection effectiveness. The accuracies of all features reached 85% and 82% in the current and validation set 2, respectively. Most METACYC features in the ‘top 20’ belonged to amino acid metabolism, aromatic compound metabolism and carbohydrate metabolism (online supplemental table S15 and S18). Unexpectedly, the accuracies of the top 20 features was slightly improved (86%) when compared with that of all features (85%) in the present current cohort and was maintained in the validation set 1 (78%), 2 (82%) and 3 (67%) (figure 5C and D). By deconstructing of the AUC from our random forest-based models across different age brackets, we found that the efficiency of both all-features and the top 20 features-based models fluctuated (figure 5E). Impressively, before 6 years of age, the diagnostic efficiency of our top 20 features was appreciable, especially in age brackets of 3–6 years (AUC 0.93–0.97) (figure 5E).
In short, the results indicated that the predictive model based on these identified biomarkers showed a admired discriminant ability to predict the ASD status.
Discussion
Based on our population-based multiregional gut microbiota results, we demonstrated that gut microbiota development significantly deviated and was unsustainably immature in children with ASD, considering microbial composition, function and relationship profiles compared with that in NT subjects. We further explored and confirmed the diagnostic potential of gut microbiota in large-scale human cohorts, suggesting that the gut microbiome can be considered a non-invasive method for the early warning of ASD. In addition to behaviour symptoms, comorbidities such as GI dysfunction, sleep disturbance and food allergies are frequently reported in children with ASD.42–44 Correspondingly, we illustrated that the abundances and functions of microbial taxa were significantly related to the mentioned comorbidities in subjects with ASD.
We identified significant changes in microbial relationships in individuals with ASD, especially before 3 years of age, and the degree of the altered relationship correlated with the severity of ASD, indicating that alteration in microbial relationships occurred in the early stages of microbiome development in children with ASD, which is consistent with the nodes when behavioural defects in children with ASD occur. Increasing evidence has suggested that the gut microbiota plays a key role in biological and physiological featues underlying neurodevelopment.45 The analysis further implicates that the establishment of early community relationships among microbes may potentially impact neurodevelopment in children.
Unlike growth faltering caused by severe paediatric pathological conditions, such as severe acute malnutrition23 32 and cystic fibrosis,46 only transient dysplasia of gut microbiota was observed in the children with ASD in the present cohort; however, detachments of early predominant bacteria, such as Veillonella, were delayed. Roswall et al have recently reported that Veillonella and Clostridium showed dynamic changes during the early developmental stage of healthy children similar to that observed in the present cohorts.15 However, both OTUs were significantly disturbed in children with ASD, suggesting that both OTUs play an important role in establishing of the gut microecological system at the early stage of life.
Most disrupted microbial functions in ASD belong to GBM, amino acid metabolism and aromatic compound metabolism. Previous studies have indicated that these functions are involved in individual nervous system development, neurotransmitter biosynthesis and neuronal response regulations.47 For instance, we observed that the bacterial pathways for tryptophan metabolism, including the production of neuroprotective kynurenic acid (kynurenine synthesis, MGB-004) and neurotoxic quinolinic acid (tryptophan synthesis, MGB-055), were significantly correlated with the severity of ASD. Similar correlations were also shown in propionate and dopamine metabolism, which is involved in the metabolic network of neurotransmitters. Our findings highlight that the gut microbiota may profoundly impact neural development by regulating neurotransmitter metabolism.
Most previous studies that constructed gut microbiota-based diagnostic models are typically described in a ‘parts list’, enumerating of component members and model’s efficiency,9 48 49 thus limiting the interpretation and practical application of gut microbiota features in human disease progression. In the current study, we visualised the decision-making process of our model and revealed the inner-group specificity of the factors in our model using treeheatr 22 and SHAP.21 Accordingly, the decision-making process was visualised by distributing each factor on a tree’s leaf nodes and branched with specific cut-off values. Moreover, our model indicates the specific cut-off values and their final judgement results of a factor, which can provide practically available indexes for an independent individual in clinical warning or treatment as well as for the scientific exploration of potential pathogenic factors.
In summary, the progressive deviation in the development of gut microbiota of subjects with ASD highlighted the influence of age on the composition of gut microbiota, which suggested that individuals with ASD should be compared with healthy controls at the same physiological age to exclude ‘age-discriminatory’ features for both clinical application and scientific research. As to the construction of animal model based on faecal microbiota transplantation, researchers should consider the conversion and matching of age between human faeces donor and recipient mice. In the future, by constructing longitudinal cohorts of children with ASD and NT, and integrating metagenomics and metabolomics analyses, we can precisely identify potential developmental windows during which the gut microbiota may be particularly sensitive to ASD development, and further provide critical clues to reveal how gut microbiota participates in the pathogenesis of autism by regulating metabolic pathways.
Data availability statement
Data are available on reasonable request. All data relevant to the study are included in the article or uploaded as supplementary information. All 16S rRNA raw data have been submitted to China National GeneBank DataBase, CNGBdb (accession number, CNP0001512).
Ethics statements
Patient consent for publication
Ethics approval
This study involves human participants and was approved by the Research Ethics Committee of Hunan Provincial Maternal and Child Health Care Hospital (no: 2019-S017) and Qilu Hospital of Shandong University (no: 2018-179). Participants gave informed consent to participate in the study before taking part.
Acknowledgments
We would like to thank Editage (www.editage.com) for English language editing and reviewers’ suggestions.
References
Supplementary materials
Supplementary Data
This web only file has been produced by the BMJ Publishing Group from an electronic file supplied by the author(s) and has not been edited for content.
Footnotes
ML, AC, CJ and KM contributed equally.
Contributors YW, XL, GJ, AC and ML conceived and devised the study. CJ, KM, ZZ, XP, ZL, JQ, QZ and XL performed data analysis and draw figures. XL, ZZ and CJ drafted the manuscript. ML, AC, YW, XX, SQ, HL, YL, LC and XQ conducted subject recruitment and collected clinical samples and data. YN, GJ, XS, ZH and YJ assisted with sample collection and data arrangement. XL, GJ, JL and YW supervised the study and revised the manuscript. All of authors interpret and confirm these data and manuscript.
Funding This work was supported by the scientific research programme of Hunan Health Commission (project no. 20200891) to YW. NSFC grant 81671983 and 81871628 to XL and Starting funding for the team of gut microbiota research in NJMU (XL).
Competing interests None declared.
Provenance and peer review Not commissioned; externally peer reviewed.
Supplemental material This content has been supplied by the author(s). It has not been vetted by BMJ Publishing Group Limited (BMJ) and may not have been peer-reviewed. Any opinions or recommendations discussed are solely those of the author(s) and are not endorsed by BMJ. BMJ disclaims all liability and responsibility arising from any reliance placed on the content. Where the content includes any translated material, BMJ does not warrant the accuracy and reliability of the translations (including but not limited to local regulations, clinical guidelines, terminology, drug names and drug dosages), and is not responsible for any error and/or omissions arising from translation and adaptation or otherwise.