Article Text

Abstract
Objective Chronic pancreatitis (CP) is a potentially fatal disease of the exocrine pancreas, with no specific or effective approved therapies. Due to difficulty in accessing pancreas tissues, little is known about local immune responses or pathogenesis in human CP. We sought to characterise pancreatic immune responses using tissues derived from patients with different aetiologies of CP and non-CP organ donors in order to identify key signalling molecules associated with human CP.
Design We performed single-cell level cellular indexing of transcriptomes and epitopes by sequencing and T-cell receptor (TCR) sequencing of pancreatic immune cells isolated from organ donors, hereditary and idiopathic patients with CP who underwent total pancreatectomy. We validated gene expression data by performing flow cytometry and functional assays in a second patient with CP cohort.
Results Deep single-cell sequencing revealed distinct immune characteristics and significantly enriched CCR6+ CD4+ T cells in hereditary compared with idiopathic CP. In hereditary CP, a reduction in T-cell clonality was observed due to the increased CD4+ T (Th) cells that replaced tissue-resident CD8+ T cells. Shared TCR clonotype analysis among T-cell lineages also unveiled unique interactions between CCR6+ Th and Th1 subsets, and TCR clustering analysis showed unique common antigen binding motifs in hereditary CP. In addition, we observed a significant upregulation of the CCR6 ligand (CCL20) expression among monocytes in hereditary CP as compared with those in idiopathic CP. The functional significance of CCR6 expression in CD4+ T cells was confirmed by flow cytometry and chemotaxis assay.
Conclusion Single-cell sequencing with pancreatic immune cells in human CP highlights pancreas-specific immune crosstalk through the CCR6-CCL20 axis, a signalling pathway that might be leveraged as a potential future target in human hereditary CP.
- pancreatitis
- immunology
- T-cell receptor
- chronic pancreatitis
- RNA expression
Data availability statement
Data are available upon reasonable request. All data relevant to the study are included in the article or uploaded as supplementary information. All raw and processed sequencing data have been deposited with Gene Expression Omnibus database, GSE165045. Code used for data analysis is available at https://github.com/yangysheep2018/CITE-seq-TCR_paper. All other processed data are available in the main text or the supplementary materials.
This is an open access article distributed in accordance with the Creative Commons Attribution Non Commercial (CC BY-NC 4.0) license, which permits others to distribute, remix, adapt, build upon this work non-commercially, and license their derivative works on different terms, provided the original work is properly cited, appropriate credit is given, any changes made indicated, and the use is non-commercial. See: http://creativecommons.org/licenses/by-nc/4.0/.
Statistics from Altmetric.com
Significance of this study
What is already known on this subject?
Chronic pancreatitis (CP) is considered an irreversible fibroinflammatory pancreatic disease and remains a major source of morbidity among gastrointestinal diseases with no active approved therapy.
Inflammation is a known hallmark of and contributor to CP pathogenesis. However, little is known about local immune responses at the pancreas in human CP, especially in how they may differ across aetiologies.
What are the new findings?
Single-cell RNA sequencing of pancreatic immune cells from patients with CP and organ donors revealed distinct immune transcriptomic features in CP versus non-diseased controls and in hereditary versus idiopathic CP.
Single-cell T-cell receptor (TCR) sequencing unveiled pancreas-specific clonal expansion in CD8+ T cells and CD4+ T cells-driven unique TCR repertoire changes in hereditary CP.
We found that the CCR6-CCL20 axis was significantly upregulated in hereditary CP compared with controls or idiopathic CP, suggesting a potential future target for human hereditary CP.
How might it impact on clinical practice in the foreseeable future?
The results of this study improve our understanding of CP heterogeneity and identify distinct immune responses in different types of human CP, providing novel conceptual directions for potential therapeutical strategies for treating hereditary and idiopathic CP.
The CCR6-CCL20 axis found in hereditary CP is a novel and potentially targetable signalling pathways for the treatment of hereditary CP.
Introduction
Chronic pancreatitis (CP) is a progressive fibro-inflammatory disease of the exocrine pancreas and is a major source of morbidity, yet it has remained an untreatable disease to date.1 2 CP is characterised by morphological changes in the pancreas including acinar cell atrophy, distorted pancreatic ducts, inflammation and fibrosis.3 4 Primary risk factors in adult CP include alcohol and smoking, whereas genetic variants and idiopathic factors are significant contributors to CP at all ages.1 5–8 Over the past two decades, many animal models have been used to understand disease pathogenic mechanisms in CP.9 10 However, questions remain regarding the translational accuracy of preclinical studies. For instance, most pancreatitis animal studies are dependent on disease-inducing agents that may not mimic the human CP condition.11 Therefore, research with human pancreas tissues is critical to understanding human disease-specific pathogenic mechanisms in CP.
Inflammation is a hallmark of CP,4 12 and immune cells have emerged as key contributors to CP and its progression.13 14 For example, anti-inflammatory (M2) macrophages have been observed in different types of CP experimental models15 16 and contribute to CP fibrogenesis through their crosstalk with pancreatic stellate cells (PSCs).17 A growing number of studies have demonstrated the critical role of immune cells at the different stages of disease progression in CP providing potential therapeutic targets for the disease.18–20 However, immune characteristics remain poorly understood in human CP due to the limited access to human pancreatic tissues, and the contribution of disease aetiologies to disease heterogeneity remains unexplored.
In collaboration with an institution that performs high volume of total pancreatectomy islet autotransplantation in patients with CP, our pilot study using flow cytometric analysis and bulk T-cell receptor (TCR) sequencing revealed distinct immune responses between hereditary and idiopathic CP, implicating different immunopathogenic mechanisms underlying these two different subtypes of CP.21 However, this initial study was limited in its depth where a detailed assessment of the differences in immune cell composition and T-cell responses between hereditary and idiopathic CP was not explored. Identifying the unique immune signals and molecules unique to each subtype of CP advances our understanding of immunopathogenic mechanisms underlying this disease. Here, we performed cellular indexing of transcriptomes and epitopes by sequencing (CITE-seq) (combined single-cell antibody-derived tag and RNA sequencing)22 and single-cell TCR sequencing (scTCR-seq) of immune cells isolated from human pancreas tissues in patients with CP and organ donors to gain an in-depth understanding of immune responses associated with the disease. This unbiased systemic analysis of immune signatures included an assessment of protein expression, transcriptomes and TCR repertoire analyses of pancreatic immune cells, revealing aetiology-specific immune cell signatures and interactions. These data provide insights into novel immune signalling pathways and offer potential future therapeutic target(s) for human CP.
Results
Human pancreatic immune cell transcriptional atlas reveals unique disease-specific signatures in CP
Exocrine pancreatic tissues collected from the first cohort of organ donors (n=3) and CP (hereditary, n=5 and idiopathic n=4) patients who underwent total pancreatectomy (table 1, online supplemental tables 1, 2 and online supplemental figure S1A, B) were used to isolate immune cells by the immune cell enrichment method and fluorescence-activated cell sorting.21 Next, sorted live CD45+ pancreatic immune cells were further stained with 13 different surface protein antibodies for CITE-seq. The stained cells went through a droplet-based gel-bead barcoding system (10× genomics),23 which enables the construction of independent maps of immunophenotypes of surface protein expression, transcriptomes (5’ single-cell RNA sequencing (scRNA-seq) and the TCR repertoire (scTCR-seq) simultaneously in the same cells (figure 1A and online supplemental table 3). After quality control (online supplemental figure S1C) and removing doublets, we retained a total of 28 547 single cells and performed clustering analyses with the gene expression data. This revealed 17 different cell populations that were visualised by uniform manifold approximation and projection (UMAP) embeddings (figure 1B and online supplemental data 1). Cell populations were annotated based on specific gene expression patterns, which were inferred from classifications of various human single immune cell RNA-seq studies (figure 1C and online supplemental figure S2A).24–26 The major classes of pancreatic immune cells that we identified from controls and CP samples were T cells, myeloid cells, B cells and mast cells (figure 1B and online supplemental figure S2B). Noticeably, cells did not topologically cluster by experimental batch or individual sample, but rather cells from each group (control, hereditary or idiopathic CP) grouped together in a distinctive manner, highlighting the impact of disease and its aetiology on the immune transcriptome (figure 1D and online supplemental figure S2C).
Supplemental material
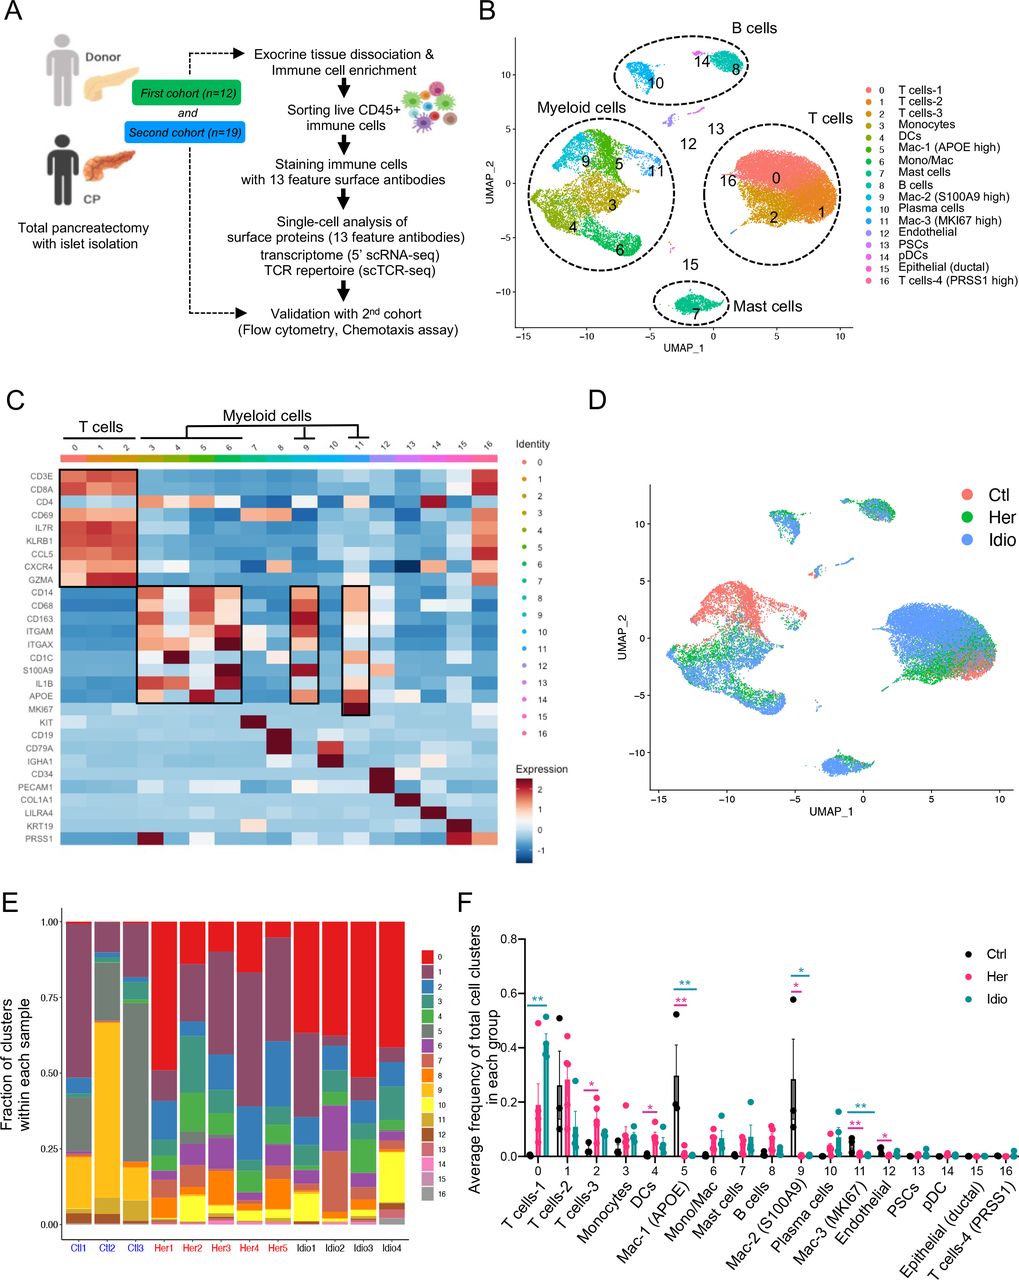
Human pancreatic immune cell transcriptional atlas. (A) Experimental design for single-cell sequencing (cellular indexing of transcriptomes and epitopes by sequencing and TCR-seq) of pancreatic immune cells from patients with CP and non-diseased control donors. (B) UMAP plot of all 28 547 pancreatic immune cells from patients with CP (five hereditary and four idiopathic CP) and three control donors presenting 17 clusters (MAC, macrophages; Mono/Mac, monocytes and macrophages; pDCs, plasmacytoid dendritic cells). (C) Heatmap of signature gene expression Z scores across cells. (D) UMAP plot of pancreatic immune cells including 4169 cells from control donors, 11 786 cells from hereditary CP and 12 592 cells from idiopathic patients with CP coloured based on the group (Ctl, control; Her, hereditary CP; Idio, idiopathic CP). (E) Cell cluster frequency shown as a fraction of clusters from total cells in each patient or donor. (F) The frequency of 17 immune clusters defined by scRNA-seq clustering analysis shown as an average proportion of each cluster within each group. One-way analysis of variance Kruskal-Wallis test (*p<0.05, **p<0.01, ***p<0.001). The comparison of each pair was differentiated by colour: between Ctl and Her, Pink; between Ctl and Idio, Teal; between Her and Idio, Black. CP, chronic pancreatitis; scRNA-seq, single-cell RNA sequencing; scTCR-seq, single-cell TCR sequencing; TCR, T-cell receptor; UMAP, uniform manifold approximation and projection.
Statistical comparisons of demographic and characteristics between control and CP samples, a cohort for single-cell sequencing analysis
We further analysed the frequency and composition of immune cell populations within each group or individual subject by the identified immune cell clusters. We found the major immune cells comprising control pancreas tissues were myeloid cells, while T cells comprised a higher proportion of pancreatic immune cells from CP tissues (figure 1E and online supplemental figure S3A, B). Among T cells and myeloid cells, distinct cell clusters were enriched in each group. Macrophages, including clusters 5, 9 and 11, were enriched in controls, and distinct T-cell clusters were expanded in the CP groups; cluster 2 was the main T-cell cluster enriched in hereditary CP while cluster 0 was predominant in idiopathic CP (figure 1F and online supplemental figure S3C, D). We also confirmed surface protein marker expression patterns in pancreatic immune cells such as CD3, CD8, CD11B and HLA-DR, by visualising their expressions in a UMAP created by the transcriptome data from all immune cell clusters (online supplemental figure S4A, B).
Next, we examined disease-specific gene signatures by identifying differentially expressed genes (DEGs) in CP versus control samples (online supplemental figure S5A, B). Among the top 20 upregulated genes in CP compared with controls we found HSP90AA1, FTH1, TNFAIP3, NFKBIA, NR4A1, CD69 and CCL20. Furthermore, we performed gene set enrichment analysis (GSEA) of DEGs in CP versus controls, and the results highlighted strong signatures for inflammatory responses, including apoptosis, hypoxia, interleukin (IL)2-STAT5, interferon-gamma and tumour necrosis factor (TNF)-α signalling (online supplemental figure S5C, D). Overall, single-cell transcriptome data analysis of pancreatic immune cells from control and CP tissues indicated disease-specific immune responses in the local pathogenic tissue area and distinct immune transcriptomic and protein expression signatures between hereditary and idiopathic CP groups.
Distinct transcriptomic characteristics of pancreatic T cells between hereditary and idiopathic CP
One of the major immune cell populations present in the pancreas of control and CP subjects were T cells. In order to scrutinise T-cell transcriptomes at a higher resolution, we analysed T-cell populations (clusters 0, 1 and 2 of total cell clusters, figure 1B) separately. We complied gene expression data from 15 913 cells for T-cell clustering analyses and identified 13 different T-cell clusters with populations annotated by specific marker gene expression (figure 2A and B and online supplemental figure S6A). A UMAP of T-cell populations revealed a marked separation of cell clusters into three groups: control, hereditary CP and idiopathic CP (figure 2C). Control cells comprised predominantly GZMA+ cytotoxic CD8+ T cells, while distinct CD4+ or CD8+ T-cell subpopulations constituted CP T cells (figure 2D and E and online supplemental figure S6B, C). Hereditary CP cells mainly consisted of CD4+ helper T-cell (Th) subpopulations, including CCR6+, TNF+ (Th1), regulatory T (Treg) cells and HLA-DA+ CD8+ T cells. However, FTH1+ CD4+ and BAG3+ CD8+ T cells were the predominant T cells in idiopathic CP samples (online supplemental figure S6D, E).

Distinct pancreatic T-cell transcriptional signatures in hereditary CP versus idiopathic CP. (A) UMAP plot of 15 913 pancreatic T cells across controls and CP displaying 13 clusters. (B) Heatmap of signature gene expression z scores across cells. (C) UMAP plot of pancreatic T cells including 1012 cells from control donors, 7271 cells from hereditary CP and 7630 cells from idiopathic patients with CP coloured based on the group (Ctl, control; Her, hereditary CP; Idio, idiopathic CP). (D) Cell cluster frequency shown as a fraction of 13 T-cell subclusters in each patient or donor. (E) The frequency of 13 T-cell subclusters defined by single-cell RNA sequencing clustering analysis shown as an average proportion of each cluster within each group. One-way analysis of variance Kruskal-Wallis test (*p<0.05, **p<0.01, ***p<0.001). The comparison of each pair was differentiated by colour; between Ctl and Her, Pink; between Ctl and Idio, Teal; between Her and Idio, Black. (F) Differentially expressed genes in between hereditary CP and idiopathic CP. Each dot represents a gene, with significantly upregulated top 20 genes and downregulated top 20 genes in hereditary CP versus idiopathic CP coloured blue and yellow, respectively. (G) Functional enrichment analysis of significant hallmark gene sets in total T cells from hereditary CP versus idiopathic CP. CP, chronic pancreatitis; NES, normalised enrichment score; UMAP, uniform manifold approximation and projection.
Furthermore, in an analysis including total T cells, we identified DEGs and performed GSEA of upregulated genes in CP versus controls (online supplemental figure S7A-C). We also identified DEGs in hereditary CP versus idiopathic CP within total T cells (figure 2F and G), CD4+ T cells or CD8+ T cells (online supplemental figure S7D, E). Some of the genes noted to be upregulated in hereditary compared with idiopathic CP included chemotactic receptors and ligands, such as CCR6, CXCR4, GPR183 and CCL20, suggesting their involvement in CD4+ T-cell recruitment in hereditary CP.
CD8+ T-cell dependent unique TCR repertoire changes in CP
Next, we examined the TCR repertoire of the same T cells from which we extracted transcriptome data in control and CP samples. Paired transcripts that are distally encoded but coexpressed in single cells, TCR α (TRA) and TCR β (TRB), were sequenced and filtered through a programmed filtering system (cell ranger, 10× genomics). After barcode correction and trimming, V(D)J genes in the complementary determining region 3 (CDR3) of the TCR transcripts were annotated. We identified a total of 12 856 unique paired αβ TCR sequences and 5180 T cells with paired TRA and TRB CDR3 sequences from the T-cell repertoire of 12 control and CP samples. In control T cells, 15.6%±6.0% unique clonotypes were shared by two or more cells, which was significantly higher than that of hereditary CP T cells (4.03%±1.6%) (figure 3A). Corresponding to this result, the Gini coefficient (an index of clonality) of control T cells was also significantly higher compared with the hereditary CP group, indicating lower clonal expansion in hereditary CP T cells (figure 3B). Next, we assigned TCR sequences to cells with cluster identities, as shown in figure 2A. Gini coefficients of the different T-cell clusters revealed CD8+ T cell-skewed clonal expansion in control and CP groups (figure 3C). When we split T cells into CD8+ T cells and all other T cells, the Gini-coefficient of CD8+ T cells was significantly higher than that of the remaining T cells (figure 3D). This result was further confirmed by comparing UMAPs of CD8A gene expression and clonally expanded cell populations (figure 3E). Finally, we observed that Gini coefficients of samples in control and CP groups had a positive correlation with CD8+ T-cell frequency, while Gini-coefficients in an analysis of all samples had a negative correlation with CD4+ T-cell frequency (figure 3F). These data suggest that a significantly higher frequency of CD4+ T cells contributes to the lower Gini coefficient and clonal expansion in hereditary CP compared with controls.

Single-cell RNA sequencing/TCR-sequencing unveils CD8+ T cell subset dependent unique TCR repertoire changes in CP. (A) Bar graph shows the percentage of unique paired TCR α and TCR β sequences that are shared by one cell (blue), by two cells (green) or three or more cells (orange) in each donor or patient with CP. (B) Gini coefficients of control and CP group across all pancreatic T-cell populations. For each group, a box and whisker plot is shown with the median and all values from minimum to maximum. One-way analysis of variance with Tukey’s multiple comparison test, *p<0.05. (C) Heatmap showing Gini coefficients of pancreatic T-cell clusters in each donor or patient. (D) Gini coefficients of pancreatic CD8+ T cells and other T cells in control and CP groups. (E) UMAP plot of CD8A gene expression in control or CP groups (top). TCR clonality on the expression-driven UMAP overlay showing the distribution of clonal and unexpanded cell populations in cell clusters in control and CP groups (bottom). Q0, unexpanded; Q1, cells encompassing the top 20% of the most expanded clones in the group; Q2–4, cells representing the middle three quantiles; Q5, cells encompassing the bottom 20% of the most expanded clones. (F) Correlation analysis of Gini coefficients for pancreatic T cells and the frequency of CD8+ T cells (top) or CD4+ T cells (bottom) in control donors and patients with CP. CP, chronic pancreatitis; Ctl, control; Her, hereditary; Idio, idiopathic; TCR, T-cell receptor; UMAP, uniform manifold approximation and projection.
These scRNA/TCR-seq results revealed that the degree of T-cell clonal expansion or diversity in CP was mainly altered by the frequency of cytotoxic CD8+ T cells and infiltration of pathogenic CD4+ T cells. In hereditary CP, infiltrating CD4+ T cells likely dilute the effect of tissue-resident cytotoxic CD8+ T cells on TCR clonal expansion observed in control pancreatic tissues. This may provide key insights into the CD4+ T cell-mediated pathogenic response, especially in the case of hereditary CP.
Unique interactions among T-cell lineages and shared antigen-binding motifs in CP
In order to understand the connection between and origin of the T-cell clusters, we examined the unique clonotypes (matched single-cellTCR-αβ profiling) and their overlap between different clusters by analysing clonotypes either across all groups (figure 4A) or within each group (online supplemental figure S8A-C). Although a higher Gini coefficient and expanded clones were observed in control versus CP samples, no single clonotype was shared between different clusters in controls. Major clonotype overlaps were found in both hereditary and idiopathic CP (online supplemental figure S8A-C). The greatest clonotype overlaps were found between CD8+ cytotoxic T-cell clusters (Tc-1 and Tc-3), which had 40 shared clonotypes that were largely driven by the idiopathic CP group. In fact, 63 unique shared clonotypes were found among CD8+ cytotoxic T-cell clusters in idiopathic CP (figure 4A and online supplemental figure S8C). The next highest clonotype overlaps were found between CCR6+ CD4+ T cells and Th1 cells, with 23 shared clonotypes, and these overlaps mainly occurred in hereditary CP (figure 4A and online supplemental figure S8B). These shared TCR clonotypes elucidated unique interactions among the different T-cell subtypes and clonal dynamics of each CP group. Specifically, the large number of shared clonotypes between CCR6+ CD4+ T cells and Th1 cells in hereditary CP samples suggested that these two Th-cell subsets may have a shared origin. Interestingly, our analysis demonstrated overlaps between CD4+ and CD8+ T-cell clusters, which may require further analyses regarding the length of CDR3 sequences in overlapped clonotypes, as shorter CDR3 sequences are less likely to recognise a particular major histocompatibility complex (MHC) class.27
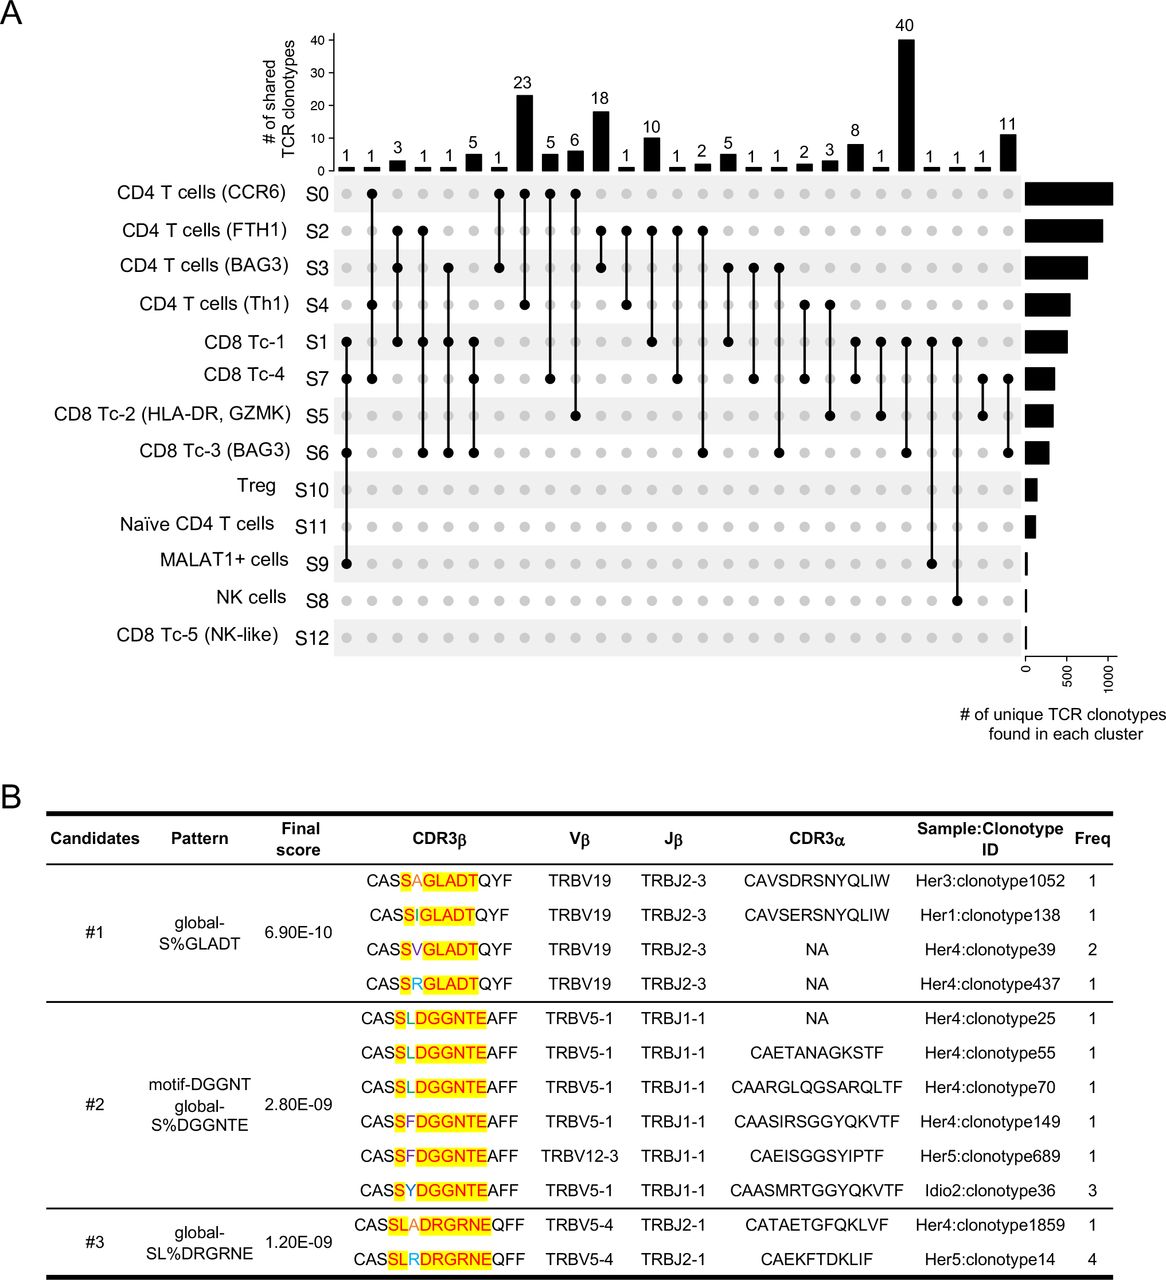
Single-cell RNA sequencing/TCR-sequencing uncovers unique interactions among T-cell lineages and shared antigen binding motifs in CP. (A) Upset plots displaying TCR clonotypes shared among T-cell clusters from T cells across control and CP groups. Each shared clonotype was indicated by black dots with a connected black line. The horizontal bar graph indicates the total number of shared TCR clonotypes for cluster intersections, and the vertical bar graph indicates the number of unique clonotypes found in a single cluster. (B) Representative TCR specificity groups and potential antigen binding motifs by GLIPH2 cluster analysis of TCR CDR3β sequences from pancreatic T cells across control, hereditary and idiopathic CP. Candidates were selected from the clusters with a final score of less than 10−8 and shared by at least two different individuals. CP, chronic pancreatitis; TCR, T-cell receptor.
To examine whether pancreatic TCRs found in controls and CP samples recognise the same antigens, we performed grouping of lymphocyte interactions by paratope hotspots 2) GLIPH2 analysis, which clusters TCRs that recognise the same epitope by screening shared antigen-binding motifs on the TCR CDR3β amino acid sequences.28 A number of motifs shared by at least two individuals from all three groups (control and two CP groups) were selected based on final scoring, and among those, three clusters were shown as they also possess a certain level of similarity in their paired CDR3α sequences (figure 4B). The results showed that selected clusters were mainly shared by individuals from the hereditary and idiopathic CP groups, and not with controls. Remarkably, most of the TCRs from the three candidate clusters with unique common motifs were mainly shared by individuals from the hereditary CP group, which indicates that T cells in hereditary CP are more likely to react against common antigens or epitopes. Consistent with scRNA-seq results of T cells, this scRNA/TCR-seq data also support the idea that there are distinct immune responses between hereditary and idiopathic CP, specifically in the T-cell antigen reactions.
Distinct transcriptional alteration of human pancreatic myeloid cells in CP
Myeloid cells have been known to play significant roles in CP and interact with non-immune cells, such as PSCs.17 Myeloid cells were another key component of the pancreatic immune subsets we found in the pancreata of control and CP subjects (figure 1B). When we further analysed myeloid clusters separately (clusters 3, 4, 5, 6, 9 and 11 in figure 1B), 11 different myeloid subclusters were identified that included monocytes, macrophages and dendritic cells (DC) (figure 5A). Remarkably, cells belonging to each group (control, hereditary CP or idiopathic CP) gathered together and were topologically separated from each other with minimal overlap when visualised by UMAP (figure 5B). Myeloid cell clusters were manually annotated by their distinct cell marker gene expression (figure 5C and online supplemental figure S9A). Importantly, the frequency of CD68+ and CD163+ macrophages and S100A8+ monocytes (clusters 3 and 8) were significantly higher in controls compared with patients with CP (figure 5D and E and online supplemental figure S9B, C). In CP samples, distinct monocyte and DC populations contributed to the myeloid compartment of hereditary or idiopathic CP immune cells. The most notable finding was a significantly higher frequency of CCL20+ monocytes in hereditary CP compared with control or idiopathic CP samples. Furthermore, DEG analysis in patients with CP versus controls revealed various inflammatory and chemoattractant molecules, such as IL1B, CXCL2, CXCL3, CXCL8 and CCL4, that were significantly upregulated and inflammatory signalling pathways in CP myeloid cells that were enriched (online supplemental figure S9D, E). DEG analysis of total myeloid cells or separated myeloid clusters, such as DCs, macrophages and monocytes, in hereditary versus idiopathic CP also identified various genes, including HLA-DR, CCL20 and IL1B, as significantly upregulated, and there was an enrichment of the allograft rejection pathway in hereditary CP compared with idiopathic CP (figure 5F and G and online supplemental figure S10A-C). These data further link that hereditary CP to higher HLA molecule expression, which may underlie enhanced autoimmune responses, although specific HLA typing would be necessary to confirm this notion.29 30 Overall, single-cell transcriptional analysis of pancreatic myeloid populations revealed distinct myeloid subpopulation enrichment in each group: macrophages in controls, CCL20+ monocytes and IL1B+ DCs in hereditary patients with CP, and FTH1+ or S100A8+ monocytes in idiopathic patients with CP. In particular, the significantly enriched CCL20+ monocyte population in hereditary CP suggests its potential role as a chemoattractant for the infiltrating CCR6+ CD4+ T cells.
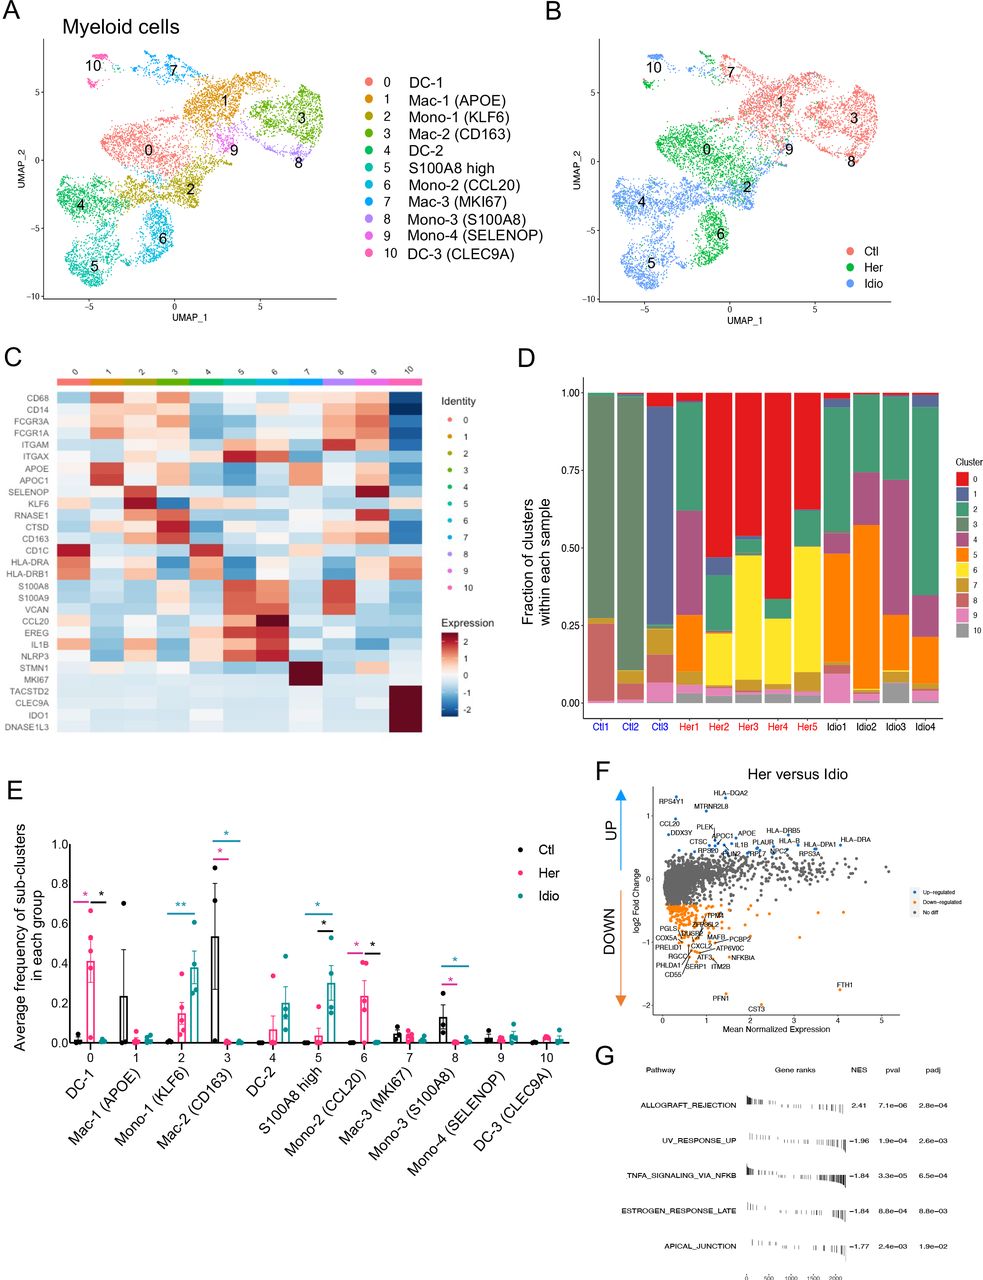
Distinct pancreatic myeloid cell transcriptional signatures between hereditary CP and idiopathic CP. (A) UMAP plot of 8590 pancreatic myeloid cells presenting 11 clusters (DC, dendritic cells; MAC, macrophages; mono, monocytes). (B) UMAP plot of pancreatic myeloid cells including 2998 cells from control donors, 2769 cells from hereditary CP and 2823 cells from idiopathic patients with CP coloured based on group (Ctl, control; Her, hereditary CP; Idio, idiopathic CP). (C) Heatmap of signature gene expression z scores across cells. (D) Cell cluster frequency shown as a fraction of 11 myeloid subclusters in each patient or donor. (E) The frequency of 11 myeloid subclusters shown as an average frequency of each cluster within each group. One-way analysis of variance Kruskal-Wallis test (*p<0.05, **p<0.01). The comparison of each pair was differentiated by colour; between Ctl and Her, Pink; between Ctl and Idio, Teal; between Her and Idio, Black. (F) Differentially expressed genes between hereditary and idiopathic CP groups. Each dot represents a gene, with significantly upregulated top 20 genes and downregulated top 20 genes in hereditary CP versus idiopathic CP coloured blue and yellow, respectively. (G) Functional enrichment analysis of significant hallmark gene sets comparing myeloid cells from hereditary CP with idiopathic CP. CP, chronic pancreatitis; NES, normalised enrichment score; UMAP, uniform manifold approximation and projection.
Functional analysis implicates the CCR6-CCL20 axis in hereditary CP
Consistent with the transcriptional expression of genes from the CCR6-CCL20 axis in CD4+ T cells and monocyte populations from hereditary CP, we confirmed the involvement of this unique chemokine and receptor axis by analysing DEGs from total immune cell populations, comparing hereditary CP with idiopathic CP (figure 6A). Accordingly, CCR6 and CCL20 were listed among the top 20 genes that were significantly upregulated in hereditary CP compared with idiopathic CP. Furthermore, to assess the crosstalk between myeloid cells and T cells, we analysed cytokine or chemokine receptor-ligand interactions between myeloid cells and the T-cell compartment by the expression levels of the receptor ligand (figure 6B and online supplemental figure S11A, B). The CCR6-CCL20 axis was expressed only in the two CP groups, and hereditary CP had a significantly higher expression of CCR6-CCL20 than idiopathic CP. Finally, we assessed the protein expression of CCR6 in T cells isolated from the second cohort of controls and patients with CP by flow cytometry (figure 6C, table 2, and online supplemental tables 4 and 5). First, we confirmed a significantly reduced frequency of CD8+ T cells and a significantly higher frequency of CD4+ T cells in hereditary CP compared with controls. Consistent with scRNA-seq results, the frequency of CD8+ or CD4+ T cells in idiopathic CP fell in the middle, ranging between that of controls and hereditary CP. More importantly, the percentage of CD4+ T cells expressing CCR6 was significantly augmented in hereditary CP compared with controls or idiopathic CP. After we confirmed the elevated protein expression of CCR6 in CD4+ T cells from hereditary CP samples, we detected CCL20 secretion from pancreatic monocytes in hereditary CP by ELISA (online supplemental figure 13A-C). Furthermore, CCR6+ and CCL20+ cells were colocalised with CD4+ and CD45+ immune cells, respectively, on the pancreas tissue sections of hereditary CP as validated with immunofluorescence (online supplemental figure 14A,B). We next assessed the functional significance of the CCR6 expression in T cells by the CCL20-mediated cell migration assay (figure 6D). Transwell chemotaxis was performed, and CXCL12 was used as a positive control, which is standard in T-cell migration assays.31 Pancreatic immune cells from hereditary CP tissues migrated towards soluble recombinant human CCL20 at a concentration comparable to previous reports.32 33 The increased chemotactic responsiveness of the pancreas-infiltrating T cells to CCL20 confirmed the functional significance of the increased receptor (CCR6) expression in hereditary CP. These data suggest that T cells migrate and infiltrate the diseased pancreas in hereditary CP through the CCR6-CCL20 axis.

Functional analysis implicates the CCR6-CCL20 axis as hereditary CP-specific pancreatic immune crosstalk. (A) Volcano plot of DEG analysis between hereditary and idiopathic CP groups with total immune populations. Each dot represents a gene, with significantly upregulated top 20 genes and downregulated top 20 genes in hereditary CP versus idiopathic CP coloured blue and yellow, respectively (left). DEGs ranked by fold changes in hereditary CP versus idiopathic CP (right). (B) UMAP plot of total pancreatic immune cells (left). Heatmap of combined expression of selected cytokine/chemokine and their receptor displaying the interactions between myeloid cells and T cells discovered by CellPhoneDB (right). (C) Flow cytometry analysis of CD8+, CD4+ or CCR6+ CD4+ T cells (Kruskal-Wallis test with Dunn’s multiple comparisons test, *p<0.05, **p<0.01). (D) Chemotaxis assay with pancreatic immune cells from hereditary CP (left, one-way analysis of variance with Tukey’s multiple comparisons test; right, paired t-test; **p<0.01, ***p<0.001). CP, chronic pancreatitis; Ctl, control; DEG, differentially expressed genes; Her, hereditary; Idio, idiopathic; UMAP, uniform manifold approximation and projection.
Statistical comparisons of demographic and characteristics between control and CP samples, a cohort for functional validation analyses
Discussion
Human CP studies have been hindered, in part, due to a limited access to clinical specimens. By leveraging the ability to access large fractions of exocrine pancreas tissues from organ donors and patients with CP undergoing islet isolation, we were able to perform in-depth single-cell level immune analyses using state-of-the-art technologies. Our studies did not include samples from patients whose CP was related to alcohol use, as few patients with this aetiology undergo total pancreatectomy with islet transplantation,34 but we received a sufficient number of samples from those with hereditary CP and idiopathic CP for in-depth immune analyses. Our previous study using flow cytometry and bulk TCR-seq revealed distinct immune cell characteristics between hereditary and idiopathic CP, highlighting critical insights into the distinct pathogenesis of CP across different aetiologies.21 To further delineate pathogenic signals and uncover differences in immune responses underlying different aetiologies of CP, here we used integrative single-cell multiomics sequencing analyses to simultaneously assess the TCR repertoire and RNA/protein expressions at a single-cell level. These unbiased in-depth analytical technologies enabled a comprehensive comparison between control and CP samples, as well as between different CP groups, leading us to identify novel immune cell subsets and their crosstalk, as well as T-cell subset-dependent TCR repertoire changes. Consistent with our previous study,21 hereditary and idiopathic CP samples had distinct immune characteristics, not only in the frequencies of immune subpopulations, but also in their unique gene expression patterns and the degree of T-cell clonal expansions among the different subsets. Furthermore, T-cell analyses revealed a significant portion of CD4+ T-cell subsets (CCR6+ Th, TNF+ Th1 and Treg) were enriched in the hereditary CP pancreas highlighting that the immune signature of the pancreas from patients with hereditary CP is largely conserved across heterogeneous CD4+ T-cell subsets. However, idiopathic CP showed evenly distributed CD4+ and CD8+ T-cell subsets uniquely expressing FTH1 and PCBP2, which indicates that human idiopathic CP is highly associated with iron metabolism in immune cells, and this aligns with previous reports of dysregulated iron metabolism in pancreatitis.35–37
Distinct T-cell characteristics between hereditary and idiopathic CP were also seen in the TCR repertoire analysis. Pancreatic T cells exhibited an increased clonal expansion in CD8+ T-cell subsets in all control and CP groups, which led to significantly lower T-cell clonality in hereditary CP where CD4+ T-cell infiltrates were increased. These data suggest that differences in the TCR repertoire found in control versus CP or hereditary CP versus idiopathic CP were highly relevant to the distribution of specific T-cell subsets. In contrast to reports of TCR repertoires in autoimmune, infectious and malignant diseases,24 38–40 where newly infiltrating immune cells are usually responsible for the increased clonality, here infiltrating pancreatic CD4+ T cells contributed to a reduced clonality in the diseased states, but to an increased heterogeneity in the overall T-cell subsets. In addition, shared TCR clone analysis with scRNA/TCR-seq data unveiled the unique interactions between CCR6+ Th and Th1 subsets in hereditary CP, supporting the naturally increased CD4+ T-cell heterogeneity in the hereditary CP microenvironment. A better understanding of pathogenic T-cell infiltration and its patterns will be made possible by the unique pancreas-specific signals and TCR repertoire we found in hereditary and idiopathic CP, which has not been reported previously and is likely to provide fundamental clues on pathogenic mechanisms and/or disease progression in CP. Given the distinct TCR repertoire changes and common antigen-binding motifs found in hereditary versus idiopathic CP, future studies that include predicting HLA restriction and antigen screening against disease-specific TCR candidates41 will be important.
One of the striking findings in the single-cell analyses was the upregulation of the CCR6-CCL20 axis in hereditary CP. Upregulation of CCL20 by proinflammatory cytokines, such as IL-1β and TNF-α,42–44 and infiltrating CCR6+ lymphocytes has been found in microenvironments of inflammatory, infectious and malignant states in various organs such as the stomach, intestines, liver and lung.32 45–48 The CCL20 expression pattern has been compared between pancreatic cancer and CP,49 and its tumor-promoting role in pancreatic cancer has been proposed.50 51 However, CCR6+ T-cell infiltration in hereditary or any other type of CP, to our knowledge, has not been reported. Our findings also suggest there is a CP-specific crosstalk between CD4+ T cells and monocytes through the CCR6-CCL20 axis in hereditary CP, a novel insight that can make way for precision targeting of this disease. Interestingly, among the different causes of CP, hereditary CP has the highest risk for developing pancreatic cancer, with a cumulative increased risk of up to 40%.52 53 The significant upregulation of the CCL20-CCR6 axis in hereditary as compared with idiopathic CP (and organ donors) might contribute to the increased risk of pancreatic cancer in hereditary CP, although further studies should be done to confirm this correlation.
We focused the majority of our analysis and reporting on the major immune cell subsets identified, but we also found that B cells and mast cells were distinctly distributed in hereditary versus idiopathic CP, though their frequencies were limited to less than 10% of all immune cells. It will be important in the future to analyse these cells in-depth and examine their potential functional significance in CP, since there are several reports have suggested their potential pathogenic roles in pancreatitis.54–56 Although pathogenic role for B cells and their activation has been described in autoimmune pancreatitis,57 58 the potential involvement of B cells in CP was initially reported and discussed many decades ago.59 A recent study with an experimental CP model suggests a pathogenic role for B cells in tissue regeneration.60 Our scRNA-seq analysis revealed significantly increased frequencies of B cells and plasma cells in both CP groups, with differential gene expression signatures between hereditary and idiopathic CP (online supplemental figure 12A,B). These data implicate B cells, along with other immune subsets, in the immunopathogenic mechanisms of CP and requires future investigation. Collectively, our approaches with integrative single-cell analyses unveiled distinct pancreatic immune signatures and pathways between different aetiologies of CP, thereby expanding our understanding of pancreatic immune cell signalling and function in the disease-specific pathogenic microenvironment. In addition, our study contributes to a growing literature characterising the function of human pancreatic immune cells in health and disease.
Data availability statement
Data are available upon reasonable request. All data relevant to the study are included in the article or uploaded as supplementary information. All raw and processed sequencing data have been deposited with Gene Expression Omnibus database, GSE165045. Code used for data analysis is available at https://github.com/yangysheep2018/CITE-seq-TCR_paper. All other processed data are available in the main text or the supplementary materials.
Ethics statements
Patient consent for publication
Ethics approval
This study was approved by Institutional Review Board of the Stanford University.
Acknowledgments
We thank our collaborators, patients and donors who provided precious human pancreatic tissues for this study. We also thank Y Yang, Y Wei, A R Ji and D Mikhail for technical assistance, M Manohar and E K Jones for their scientific input and all other members of the Habtezion laboratory for their helpful comments and suggestions.
References
Supplementary materials
Supplementary Data
This web only file has been produced by the BMJ Publishing Group from an electronic file supplied by the author(s) and has not been edited for content.
Footnotes
Contributors BL and AH designed experiments, wrote manuscript, accept full responsibility for the work of the study, have access to the data, and controlled the decision to publish. AH provided overall guide and supervision. BL performed all experiments and analysed data, and HN performed fluorescence-activated cell sorting to prepare single cells for single-cell sequencing, flow cytometry panel design and data analysis. YY analysed CITE-seq and scTCR-seq data. HH performed GLIPH2 analysis, interpreted and reviewed scTCR-seq results. MB and DH provided chronic pancreatitis patients’ tissues and clinical information. GLS provided control pancreatic tissues and clinical information. MMD, SZH, SJP and MB reviewed manuscript and participated in the interpretation of data.
Funding This study was supported in part by National Institute of Health grant DK105263 (AH), Diabetes Genomics and Analysis Core of the Stanford Diabetes Research Center (P30DK116074), Department of Defense grant W81XWH-19-1-0888 (AH, SZH, SJP) and National Pancreas Foundation Research Grant (BL).
Competing interests None declared.
Patient and public involvement statement Patients or the public were not involved in the design, conduct, reporting or dissemination plans of this research.
Provenance and peer review Not commissioned; externally peer reviewed.
Supplemental material This content has been supplied by the author(s). It has not been vetted by BMJ Publishing Group Limited (BMJ) and may not have been peer-reviewed. Any opinions or recommendations discussed are solely those of the author(s) and are not endorsed by BMJ. BMJ disclaims all liability and responsibility arising from any reliance placed on the content. Where the content includes any translated material, BMJ does not warrant the accuracy and reliability of the translations (including but not limited to local regulations, clinical guidelines, terminology, drug names and drug dosages), and is not responsible for any error and/or omissions arising from translation and adaptation or otherwise.