Article Text

Abstract
Referral to a transplant centre is the initial, necessary step to receiving a liver transplant (LT). Inequity of access in consideration of and referral for LT is a contributing factor to the wide variation of premature mortality rates from liver disease across the UK. Data assessing this critical referral step are lacking. We sought to review LT referral rates to our centre to assess variation within our catchment area. We propose a novel intervention based on ‘social norms feedback’ strategies that have been effective in improving referral behaviours in other healthcare settings.
Referrals for LT for chronic liver disease indications between 1 April 2017- 31 March 2019 were reviewed. Electronic patient records were interrogated to establish the referring NHS Trust and patient demographics. NHS Trust catchment population data from Public Health England was then used to calculate the referral rate per 100,000 population for each individual trust over the 2 year period. An interactive dashboard displaying trust referral rates was created using the Shiny package in R. Individualised feedback letters were created, documenting each Trust’s referral rate, the average referral rate for the region, and a link to the dashboard that allows the user to compare referral rates of all Trusts in our region.
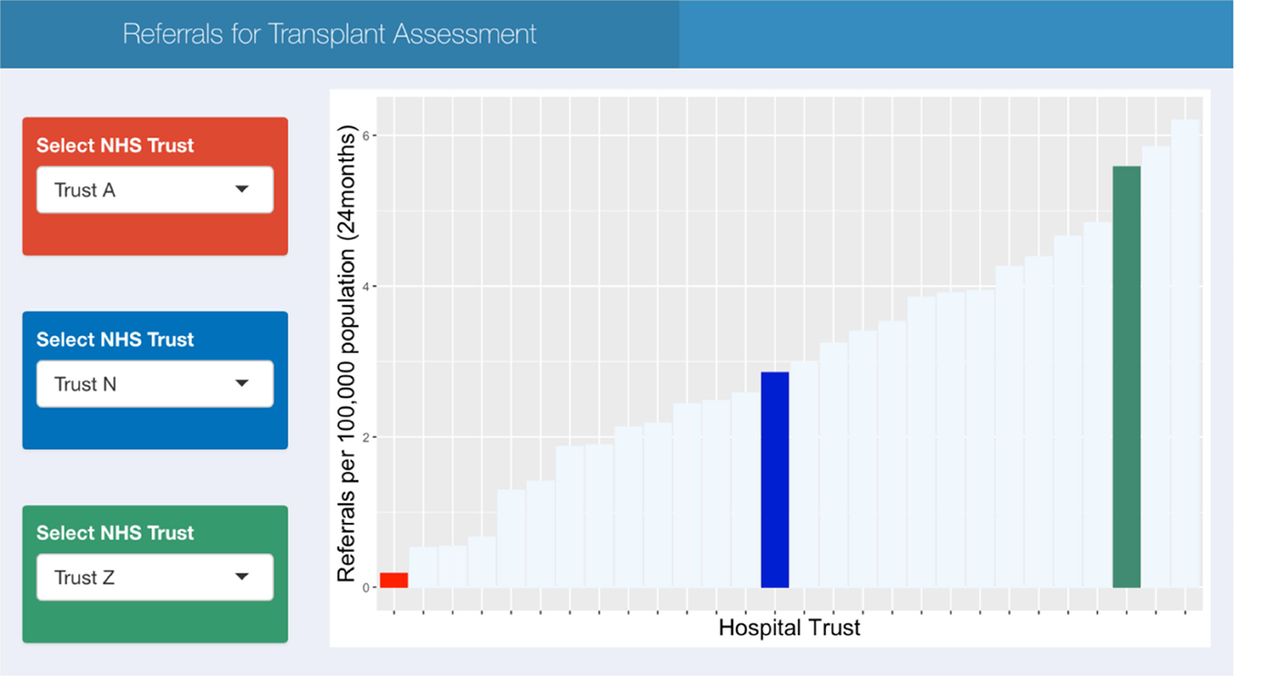
371 patients from 28 NHS Trusts were referred for LT assessment over 24 months. 64% were male and 50% had alcohol related liver disease. Median UKELD at referral was 54 (range 42–72). The median number of referrals from an individual trust was 11 (range 1- 49). The median referral rate was 2.9 per 100,000 catchment population with a range from 0.18 per 100,000 to 6.20 per 100,000. This range is illustrated in the interactive referral dashboard (figure 1).
Example of interactive dashboard allowing comparison of trust referral rates
We have identified a substantial variation in referral rates for LT within our region. Whilst this must be taken in the context of variation in risk factors for liver disease and population health needs, it provides valuable information for targeted interventions and exploration of potential barriers. LT is the end result of a complex multistep process and these finding would support consideration of extending national monitoring to the earlier referral stages to help improve equity of access to transplant.