Article Text

Abstract
Objective Pancreatic ductal adenocarcinoma (PDAC) is an aggressive disease with limited therapeutic options. However, metabolic adaptation to the harsh PDAC environment can expose liabilities useful for therapy. Targeting the key metabolic regulator mechanistic target of rapamycin complex 1 (mTORC1) and its downstream pathway shows efficacy only in subsets of patients but gene modifiers maximising response remain to be identified.
Design Three independent cohorts of PDAC patients were studied to correlate PI3K-C2γ protein abundance with disease outcome. Mechanisms were then studied in mouse (KPC mice) and cellular models of PDAC, in presence or absence of PI3K-C2γ (WT or KO). PI3K-C2γ-dependent metabolic rewiring and its impact on mTORC1 regulation were assessed in conditions of limiting glutamine availability. Finally, effects of a combination therapy targeting mTORC1 and glutamine metabolism were studied in WT and KO PDAC cells and preclinical models.
Results PI3K-C2γ expression was reduced in about 30% of PDAC cases and was associated with an aggressive phenotype. Similarly, loss of PI3K-C2γ in KPC mice enhanced tumour development and progression. The increased aggressiveness of tumours lacking PI3K-C2γ correlated with hyperactivation of mTORC1 pathway and glutamine metabolism rewiring to support lipid synthesis. PI3K-C2γ-KO tumours failed to adapt to metabolic stress induced by glutamine depletion, resulting in cell death.
Conclusion Loss of PI3K-C2γ prevents mTOR inactivation and triggers tumour vulnerability to RAD001 (mTOR inhibitor) and BPTES/CB-839 (glutaminase inhibitors). Therefore, these results might open the way to personalised treatments in PDAC with PI3K-C2γ loss.
- SIGNAL TRANSDUCTION
- PANCREATIC CANCER
- LIPID METABOLISM
- CELL BIOLOGY
- AMINO ACIDS
Data availability statement
Data are available in a public, open access repository. Data are available on reasonable request. All data relevant to the study are included in the article or uploaded as online supplemental information. Not applicable.
This is an open access article distributed in accordance with the Creative Commons Attribution Non Commercial (CC BY-NC 4.0) license, which permits others to distribute, remix, adapt, build upon this work non-commercially, and license their derivative works on different terms, provided the original work is properly cited, appropriate credit is given, any changes made indicated, and the use is non-commercial. See: http://creativecommons.org/licenses/by-nc/4.0/.
Statistics from Altmetric.com
What is already known about this subject?
Pancreatic ductal adenocarcinoma (PDAC) is an aggressive and lethal disease characterised by poor response to current therapies.
What are the new findings?
In this work, we show that loss of PI3K-C2γ, a class II PI3K, promotes PDAC growth and prevents mechanistic target of rapamycin (mTOR) signalling deactivation, triggering cellular addiction to glutamine. Studying genetically engineered mice, we found that the proliferative advantage of tumours with PI3K-C2γ loss correlates with hyperactivation of the mTOR pathway and rewiring of glutamine metabolism. Mechanistically, PI3K-C2γ recruits Asap1 to the lysosome to repress mTORC1 activation in response to glutamine decrease. Importantly, loss of PI3K-C2γ in PDAC triggers cancer vulnerability to a combination of mTOR and glutaminase inhibitors.
How might it impact on clinical practice in the foreseeable future?
Similar to glutamine starvation, loss of PI3K-C2γ increases sensitivity to glutaminase inhibitors, CB-839 and BPTES, especially when in combination with everolimus. Our findings unravel a signal transduction pathway that contributes to glutamine dependence, representing an exploitable vulnerability for the development of effective therapeutic strategies for PDAC.
Introduction
Pancreatic ductal adenocarcinoma (PDAC) is on path to become the second leading cause of cancer-related death by 2030.1 Resistance to chemotherapies represents a critical challenge for patients with pancreatic cancer, thus, novel therapeutic approaches for PDAC are urgently needed. A phenomenon contributing to therapeutic resistance and dismal prognosis is a unique characteristic of PDAC called desmoplasia, which results in reduced availability of oxygen and nutrients to the cancer. To survive in such a harsh microenvironment, pancreatic cancer cells adopt unique metabolic processes to meet their energy demand, including rewired glucose and glutamine metabolism.2 3 Previous evidence demonstrates that glutamine is a critical nutrient for pancreatic cancer,4 5 being the major source of carbon and nitrogen for biosynthetic reactions and redox homeostasis.6 7
A key regulator of metabolic adaptation to nutrient availability is the mTOR (mechanistic target of rapamycin) pathway, which drives metabolic reprogramming to support biosynthetic needs and optimal cell growth. mTOR signalling is often dysregulated in PDAC, thus representing an attractive therapeutic target with remarkable responses in preclinical models.8 However, results of clinical trials using mTOR inhibitors are less encouraging, showing clinical benefit only in a minority of PDAC patients.9 10 Therefore, stratification of patients with genetic markers modifying susceptibility to mTOR inhibition is expected to provide a better therapeutic response.11
While it is well known that the mTOR axis is activated by class I PI3K,12 class II PI3K play an opposite effect and their lipid product PI(3,4)P2 can act as a negative regulator of mTOR signalling.13–15 Class II PI3Ks consist of three isoforms, PI3K-C2α, PI3K-C2β and PI3K-C2γ, which display non-redundant cellular roles and distinct biological functions.16 The PI3K-C2γ isoform has a unique pattern of expression, appearing in liver, kidney and exocrine pancreas.17 While the presence of PI3K-C2γ in the pancreas might suggest a role in PDAC, whether this lipid kinase affects cancer initiation and/or progression is still unclear.
In this study, we showed that loss of PI3K-C2γ accelerates PDAC development and progression with hyperactivation of the mTOR pathway. Our results showed that PI3K-C2γ inhibits mTORC1 through a specific mechanism, distinct from that of PI3K-C2β13 14 and involving the PI(3,4)P2/Asap1/Arf1 pathway. This negative feedback is triggered by low glutamine and its loss in PDAC drives to glutamine addiction. Accordingly, lack of PI3K-C2γ sensitises PDAC cells to a synergic effect of combined mTOR and glutaminase (GLS1) inhibition in vitro and in vivo. Our findings thus support the notion that loss of PI3K-C2γ in PDAC might allow a more accurate patient stratification required to improve the therapeutic responses.
Material and methods
Histopathological analysis
PI3K-C2γ protein expression was evaluated in three independent cohorts of PDAC samples. Sections were stained with specific antibodies: PIK3C2G (ThermoFisher, PA5-15239), phospho-S6 Ser235/236 (#4858, Cell Signalling), PCNA 6D645 (sc-71858) and phospho-4E-BP1 Thr37/46 (#2855, Cell Signalling). For mouse analysis, PanIN was defined by previously published guidelines in genetically modified mouse models of PDAC.18 19
Mice strains generation and analysis
B6/C57 Pik3c2g-/- mice were previously generated.17 KrasLSL-G12D;Trp53LSL-R172H (KP)18 and Pdx-Cre mice were kindly provided by prof. Franco Novelli and prof. Paola Cappello. Pik3c2g+/+ (WT) and Pik3c2g-/- (KO) mice were crossed with KP and Pdx-Cre mice to generate all experimental cohorts. Nu/nu CD1+ mice were purchased from Charles River Laboratories. All animal experiments were authorised by the Italian Ministry of Health (33/2019-PR). MRI scans were acquired at 7.1T on a Bruker Avance Neo 300 spectrometer equipped with the Micro 2.5 microimaging probe. For orthotopic injections, KPC cells (106 cells) were injected into 8 weeks old Pik3c2g+/+ mice. For BPTES (12.5 mg/kg/mice, twice a week) and/or everolimus (1.5 mg/kg/mice, daily) treatment, KPC (2×10⁶ cells/mice) and Panc1 (4×10⁶ cells/mice) cells were injected subcutaneously in nu/nu CD1+ mice.
Cell culture
The human PC cell lines Capan1 (HBT-79), MiaPaca2 (CRL-1420), Panc1 (CRL-1469) and Cos7 (CRL-1651) cell lines were purchased from American Tissue Cell Culture (Manassas, Virginia, USA) and maintained under culture with DMEM (Gibco) High Glucose containing 2 mM glutamine (Invitrogen), 5000 U/mL Penicillin-Streptomycin (Gibco) and 10% heat-inactivated dialyzed fetal bovine serum (Invitrogen). For drug treatment, Everolimus (11597, Cayman Chemical), CB-839 (22038, Cayman Chemical) or BPTES (S7753, Aurogene) were added the day after seeding in culture media. Cells were counted at the indicated time point with CellTiter-Fluor Cell Viability Assay (Promega). Human cell lines authentication was performed by BMR Genomics. All cell lines were routinely tested for Mycoplasma contamination using PCR.
Metabolic assay
The media were assayed for glucose and lactate levels by using Biosen C-Line analyser according to the manufacturer’s instruction. KPC WT and KO cells were subjected to the Seahorse XF Cell Mito Stress Test. To analyse the incorporation of uniformly (U) radiolabeled 14C-glutamine into proteins and lipids, culture medium was supplemented with 0.05 µCi/mL 14C-glutamine (Perkin Elmer).
Statistical analysis
Prism software (GraphPad) was used for statistical analysis. CompuSyn software was used to score the Combination Index of the combinatorial treatment. Significance was calculated with Student’s t-test and one-way or two-way analysis of variance tests followed by Bonferroni’s post hoc analysis or Mantel Cox log-rank test where appropriate.
Results
PI3K-C2γ expression is reduced in pancreatic PDAC
To assess the relevance of PI3K-C2γ expression in cancer, we interrogated PDAC transcriptomes available at cBioPortal for Cancer Genomics.20 21 Data from TCGA cohort (n=148) showed that shallow deletion (heterozygous loss), but rarely mutations, of PIK3C2G is a common aberration in about 15% of PDAC patients.20 21 In addition, gene expression analysis performed in four integrated PDAC datasets showed that PIK3C2G is mainly expressed in neoplastic epithelial cells (online supplemental figure S1A), indicating that the reduced expression of PIK3C2G observed in the TCGA and ICGC datasets is due to a decreased expression in tumour but not stromal cells.22–25 Furthermore, we observed a significant negative correlation (Spearman: −0.51; p=2.22e-13) between PIK3C2G methylation and mRNA expression, consistent with a reduction of its expression in PDAC patients.20 21
Supplemental material

PI3K-C2γ loss decreases KPC mice survival and accelerates PDAC cells growth. (A, B) Immunohistochemical (IHC) assessment (A) and quantification (B) of the level of PI3K-C2γ expression in PDAC patients in cohort #1. Representative images of high (score ≥1) and low (score <1) PI3K-C2γ expressing tumours (n=73) (scale bar=100 µm). (C, D) Percentage of tumours expressing high (score ≥1) or low (score <1) levels of PI3K-C2γ in cohort #2 (n=76), (C) and cohort #3 (n=45), (D). (E) Kaplan-Meier curve for survival of WT/KO KPC mice (n=40, Mantel-Cox log-rank test). (F) Histopathological analysis of WT/KO KPC mice pancreata. Representative H&E images, PAS-alcian blue and Masson trichrome stainings of 1.5 and 4 months old mice. Arrows indicate PanIN lesions, asterisks (*) indicate normal acini, hashtags (#) indicates PDAC (scale bar=100 µm). (G) Axial (top) and coronal (bottom) T2w MRI (B0=7.1 T) of WT (left) and KO (right) 6 weeks old KPC mice. White arrows indicate pancreatic tumour. (H, I) Growth assay of WT/KO KPC (H) and Panc1 (I) cells (n=5). Data are shown as mean±SEM, ANOVA followed by Bonferroni’s post hoc test, otherwise indicated. ANOVA, analysis of variance; KPC, LSL-KrasG12D/+;LSL-Trp53R172H/+;Pdx-1-Cre; PAS, Periodic acid–Schiff; PDAC, pancreatic ductal adenocarcinoma.
Next, we explored the expression of PIK3C2G in the context of the two molecular subtypes of PDAC, using the Moffitt’s PDAC classification.26 We found that PIK3C2G expression is significantly lower in the aggressive basal-like subtype than in the classical PDAC,27 28 in both the TCGA (n=148, p=0.035) and the ICGC cohorts (n=95, p=0.013) (online supplemental figure S1B). We also investigated the correlation between the expression of PIK3C2G and the surrogate biomarker of classical PDAC cells, GATA6, confirming the enrichment of PI3K-C2γ low expressors in GATA6 low tumours in both cohorts (online supplemental figure S1C).
To confirm that a subset of PDAC shows reduced PI3K-C2γ expression, we used a validated antibody to stain by IHC a total of 194 cases from three independent cohorts. The specificity of the antibody for PI3K-C2γ was validated in pancreas tissue from PI3K-C2γ-deficient Pik3c2g-/- mice17 (online supplemental figure S1D). In the first cohort (cohort #1, n=73), low levels of PI3K-C2γ were found in 38% (28/73) of patients (IHC score <1), while 62% were classified as positive (IHC score ≥1) (figure 1A and B). Moreover, the reduction of PI3K-C2γ expression was observed in 35.6% (16/45) of moderately differentiated PDACs and 42.9% (12/28) of poorly differentiated PDACs (online supplemental figure S1E). In a second independent cohort (cohort #2, n=76), low levels of PI3K-C2γ were found in 22.4% (17/76) of patients, 46.9% (23/49) of which were scored as poorly differentiated PDAC (figure 1C). In the third cohort (cohort #3, n=45), low levels of the protein were detected in 33.3% (15/45) of PDAC patients (figure 1D), 40.0% (4/10) of which scored as poorly differentiated PDAC (online supplemental table S1). Patients with a low expression of PI3K-C2γ exhibited significantly shorter clinical overall survival (but not progression-free survival) than those with high PI3K-C2γ levels (p=0.035, online supplemental figure S1F,G).
Loss of PI3K-C2γ promotes pancreatic cancer in mice
To investigate the role of PI3K-C2γ in pancreatic cancer development, we crossed Pik3c2g-/- mice17 with LSL-KrasG12D/+;LSL-Trp53R172H/+;Pdx-1-Cre (KPC WT)18 and generated KPC KO mice. While KPC WT mice succumbed to death at an average of 30 weeks, animals from KPC KO group died at an average of 11 weeks of age (p<0.0001, figure 1E), thus indicating that the loss of PI3K-C2γ reduces overall survival time. However, mice lacking the expression of PI3K-C2γ in WT background17 were not prone to tumour development and did not display metabolic alterations (ie, pancreatic, liver and renal functions) (online supplemental figure S1H and online supplemental table S2).
Analysis of PanIN lesions indicated that loss of PI3K-C2γ promotes the appearance of each stage of PanIN progression (PanIN1, 2, and 3) (figure 1F and online supplemental figure S1I,J). This disease acceleration was not associated with metabolic alterations, as no changes in blood glucose were detected in both genotypes up to 8 weeks (online supplemental figure S1K). In further agreement with accelerated lethality in the absence of PI3K-C2γ, T 2w MRI analysis, indicated that KPC KO tumours were more diffuse throughout the abdomen than KPC WT controls (figure 1G). In line with this finding, KPC KO mice showed a significant increase in the number of lung and liver metastases (online supplemental figure S2A).
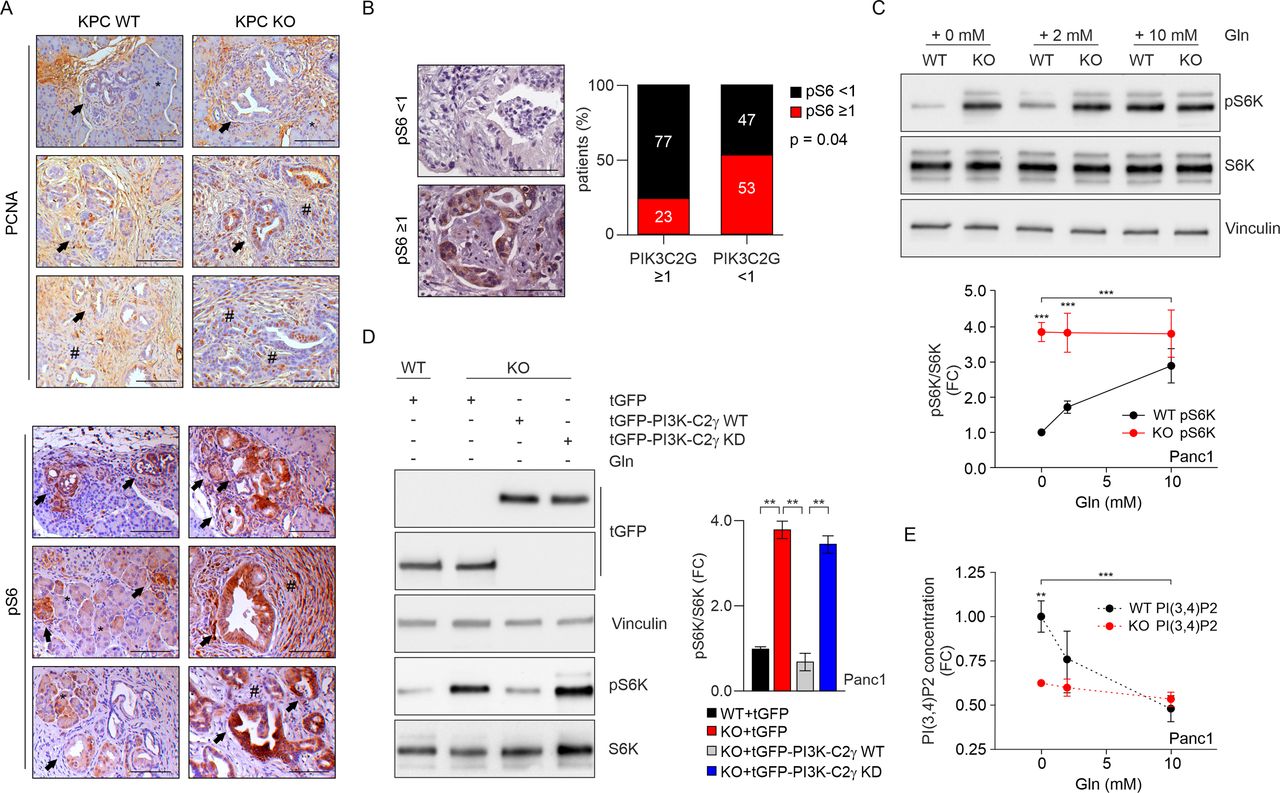
PI3K-C2γ loss induces mTORC1 hyperactivation on glutamine deprivation. (A) IHC assessment of the level of PCNA (top) and pS6 (bottom) in tumours taken from WT/KO KPC mice. Arrows indicate PanIN lesions, asterisks (*) indicate normal acini, hashtags (#) indicates PDAC (scale bar=100 µm). (B) IHC assessment (left) and quantification (right) of the level of pS6 expression (focal positive reactivity) in PDAC patients (scale bar=100 µm) expressing high (score ≥1) or low (score <1) of PI3K-C2γ levels (n=45 patients, p=0.04, χ2 test). (C) WB analysis of mTORC1 activity in WT/KO Panc1 cells that were starved of glutamine (Gln), then stimulated with Gln at the indicated concentrations. Representative Western blot images of whole-cell lysates probed with indicated antibodies (top) and quantification of pS6K/S6K ratio in the indicated conditions (n=9, bottom). (D) WB analysis of pS6K in WT Panc1, KO Panc1 or KO Panc1 cells re-expressing WT or the kinase dead (KD) versions of tGFP-PI3K-C2γ after glutamine depletion for 2 hours. Representative Western blot images of whole-cell lysates probed with indicated antibodies (left) and quantification of pS6K/S6K ratio in the indicated conditions (n=4, right). (E) Quantification of PI(3,4)P2 concentration in WT/KO Panc1 cells that were starved of glutamine (Gln), then stimulated with Gln at the indicated concentrations (n=5). Data are shown as mean±SEM, ANOVA followed by Bonferroni’s post hoc test, otherwise indicated. ANOVA, analysis of variance; IHC, immunohistochemical; mTORC1, mechanistic target of rapamycin complex 1; KPC, LSL-KrasG12D/+;LSL-Trp53R172H/+;Pdx-1-Cre; PCNA, proliferating cell nuclear antigen; PDAC, pancreatic ductal adenocarcinoma. **P<0.01; ***p<0.001.
In addition, reimplantation of primary tumour cells derived from WT and KO tumours (online supplemental figure S2B) in syngeneic mice indicated that KPC KO tumours grew at a significantly increased rate and developed more metastases than WT controls (online supplemental figure S2C,D). Accordingly, KPC KO cells showed increased cell growth and invasive ability than WT cells, thus supporting that the absence of PI3K-C2γ provides a cell-autonomous growth advantage (figure 1H and online supplemental figure S2E).
To assess the functional impact of PI3K-C2γ in human PDAC cells, we knocked out the PIK3C2G gene using CRISPR/Cas9 in three PDAC cell lines (Panc1, Capan1 and MiaPaca2). As for mice, the endogenous PI3K-C2γ could not be detected by Western blot but the nature of the knock-out was confirmed by RT-PCR (online supplemental figure S2F-H) as well as immunohistochemistry (online supplemental figure S2I). PI3K-C2γ-deficient Panc1, Capan1 and MiaPaca2 cells showed significantly higher cell numbers than WT controls (figure 1I and online supplemental figure S2J,K). In addition, we observed increased ERK signalling (online supplemental figure S2L,M) in PI3K-C2γ-deleted cells in line with their enhanced cell number. Finally, increased proliferation in human and murine KO cells was confirmed in PCNA-stained sections from either KPC tumours (figure 2A) or xenograft models (online supplemental figure S3A).
These findings in PI3K-C2γ-deficient PDAC cells suggested an intrinsic defect in signalling pathways controlling cell growth and, in support to this hypothesis, phosphorylation of mTORC1 pathway effectors, like S6K and 4EPB1, was found higher in murine KPC KO than in WT controls (online supplemental figure S3B). In further agreement, human KO cells also displayed abnormally elevated mTORC1 pathway activation, as per increased 4EBP1 and S6K phosphorylation (online supplemental figure S3C,D).
PI3K-C2γ kinase activity is critical for mTORC1 repression upon glutamine deprivation
We next assessed phosphorylation of mTORC1 downstream effectors like 4EBP1 and S6 by immunohistochemistry in PDAC samples. In tumours with PI3K-C2γ score <1, 4/12 PDAC cases (33.3%) were phospho-4EBP1 positive while in tumours with PI3K-C2γ score ≥1, 6/25 PDAC cases (24.0%) were phospho-4E-BP1 positive (online supplemental figure S3E). We observed a trend towards increased p4E-BP1 and reduced PI3K-C2γ expression or increased pS6 but the correlation was not significant. A stronger proof of mTORC1 pathway activation was evidenced in the staining for pS6, where a significant negative association between pS6 and PI3K-C2γ (n=45, p=0.04 by χ2 test) was found in PDAC patients stratified for PI3K-C2γ expression (figure 2B and online supplemental figure S3F). Similarly, pS6 appeared more pronounced in sections of KPC KO murine tumours than in WT controls (figure 2A), thus indicating that, on loss of PI3K-C2γ, mTORC1 hyperactivation occurs in both human and murine PDAC samples.
Therefore, we tested how the loss of PI3K-C2γ impacted on mTORC1 signalling in PDAC by analysing upstream modulators and downstream effectors in different growth conditions. First, we tested whether activation by serum of the PI3K-dependent mTORC1 activators Akt1 and Akt2 was different in WT and KO cells as well as in KO cells reconstituted with WT or kinase dead (KD) PI3K-C2γ. Either the loss of PI3K-C2γ or its re-expression did not affect Akt1/2 phosphorylation in all conditions tested (online supplemental figure S4A-D), thus suggesting a more direct action, potentially compatible with the PI3K-C2γ product PI(3,4)P2 directly inhibiting mTORC1.13 14 Next, phosphorylation of S6K in response to serum deprivation was analysed and found potently reduced in both genotypes (online supplemental figure S3C,D). However, pS6K remained slightly higher in rapidly growing KO cells independently of the presence or absence of serum (online supplemental figure S3C,D). Activity of the mTORC1 complex can also be regulated by amino acids29 and, in WT cells, decreasing glutamine concentration caused a dose-dependent reduction of serum-induced S6K phosphorylation (figure 2C, online supplemental figures S3B-D and S4E (input)). On the contrary, when KO cells were grown in the presence of serum but in limiting amounts of glutamine, pS6K remained high regardless of glutamine levels (figure 2C, online supplemental figures S3B-D and S4E (input)), thus suggesting that loss of PI3K-C2γ removes an inhibiting action on mTORC1 signalling in response to glutamine deprivation. In agreement with this hypothesis, the catalytic activity of the mTORC1 complex, assessed in a kinase assay in the absence of glutamine, was higher in KO cells than in WT controls (online supplemental figures S4E,F). In the same conditions of glutamine deprivation, add-back of the WT but not of the KD form of PI3K-C2γ restored pS6K levels (figure 2D). Moreover, when glutamine was withdrawn from WT cells maximal production of PI(3,4)P2 (figure 2E), a PI3K-C2γ product17 able to inhibit mTORC1 activity,13 occurred together with the strongest reduction of S6K phosphorylation (figure 2C). Conversely, loss of PI3K-C2γ significantly blunted the synthesis of this phosphoinositide in response to low glutamine and kept pS6K constitutively high, thus demonstrating that PI3K-C2γ is required to produce the mTORC1 negative regulator PI(3,4)P2 in the absence of glutamine in murine and human PDAC cells (figure 2C and E and online supplemental figure S4G). Altogether, these observations support a model where glutamine deprivation leads to the accumulation of a PI3K-C2γ-generated pool of PI(3,4)P2 that in turn reduces mTORC1 activity, likely to fine tune protein synthesis with amino acid availability.
PI3K-C2γ lipid product recruits ASAP1 on lysosomes upon glutamine depletion
In line with the increased phosphorylation of S6K on glutamine withdrawal, PI3K-C2γ loss enhanced mTOR localisation on lysosomes (online supplemental figure S4H-I), where mTORC1 activation preferentially occurs.30 Next, PI3K-C2γ subcellular localisation was tested in WT Panc1 or Cos7 cells cotransfected with tGFP-PI3K-C2γ and miRFP-Lamp1. The number of PI3K-C2γ-Lamp1 positive structures significantly increased on glutamine withdrawal (figure 3A and B and online supplemental figure S5A,B), thus indicating that PI3K-C2γ is enriched at the lysosome on glutamine deprivation. Next, to verify that PI3K-C2γ lipid kinase activity occurs on lysosomes, tGFP-PI3K-C2γ−miRFP-Lamp1 cells were cotransfected with the fluorescent sensor NES-mCherry-cPHX3 specifically detecting PI(3,4)P2. Colocalisation of the three signals was observed in live cell imaging, indicating that, in the absence of glutamine, PI3K-C2γ exerts its catalytic activity on the lysosome to restrain mTORC1 activation (figure 3C,D and online supplemental figure S5C-F).

PI3K-C2γ-derived PI(3,4)P2 inhibits Arf1 activity. (A, B) Localisation of PI3K-C2γ on Lamp1-positive lysosomes. Representative confocal images of tGFP-labelled PI3K-C2γ and miRFP-labelled LAMP1 in normal culture conditions (NC), (A) or on glutamine withdrawal (0 mM Gln), (B) for 2 hours in Panc1 cells. Dashed white line defines cell limits. White arrows indicate colocalisation of the indicated proteins (scale bar=10 µm). (C, D) Localisation of PI3K-C2γ and PI(3,4)P2 on Lamp1-positive lysosomes. Representative confocal images of tGFP-labelled PI3K-C2γ, mCherry-labelled PHX3 (probe for the detection of PI(3,4)P2) and miRFP-labelled LAMP1 in normal culture conditions (NC), (C) or on glutamine withdrawal (0 mM Gln), (D) in Panc1 cells. Dashed white line defines cell limits. White arrows indicate colocalisation of the indicated proteins (scale bar=10 µm). (E, F) PD of endogenous active ARF1 in WT/KO Panc1 cells on glutamine withdrawal. Quantification of active ARF1 pulled-down by GST (F, n=5). (G, H) PD of endogenous active ARF1 in WT, KO Panc1 or KO Panc1 cells re-expressing either tGFP-PI3K-C2γ WT or tGFP-PI3K-C2γ kD (kinase dead) on glutamine withdrawal for 2 hours. Representative Western blot images of active ARF1 PD assay probed with indicated antibodies (G). Quantification of active ARF1 pulled-down by GST (H, n=5). Data are shown as mean±SEM, ANOVA followed by Student’s t-test (F) or Bonferroni’s post hoc test (H). ANOVA, analysis of variance; PD, pull down; Tl, total lysate. **P<0.01.
Given that glutamine-mediated mTORC1 activation depends on the nucleotide cycling of the small GTPase ADP ribosylation factor-1 (Arf1),31 32 we tested whether PI3K-C2γ is required for the transition of Arf1 to the inactive state. Pull-down experiments of the GTP-bound active form of Arf1 demonstrated that the loss of PI3K-C2γ is associated with elevated Arf1 activity in cell models (figure 3E–H and online supplemental figure S5G) and in tumours derived from xenograft experiments (online supplemental figure S5H,I). To further verify that the lipid product generated by PI3K-C2γ is required to regulate Arf1 activity, we re-expressed a KD PI3K-C2γ in KO models. While the exogenous re-expression of WT PI3K-C2γ is sufficient to deactivate Arf1 (figure 3G and H) and to limit mTOR (figure 2D), expression of the KD mutant fails to change Arf1 activity (figure 3G and H).
We next hypothesised that PI(3,4)P2 could constitute a docking site for Asap1 (ArfGAP with SH3 domain, ANK repeat and PH domain-containing protein), a GAP protein required for Arf1 inhibition.33 34 Using confocal imaging, we found that Asap1 and PI3K-C2γ colocalised on Lamp1 positive vesicles on glutamine depletion (figure 4A,B). On the contrary, Asap1 failed to localise at the lysosomes when cotransfected with PI3K-C2γ KD mutant in response to glutamine starvation (figure 4C,D). Consistently, loss of PI3K-C2γ reduced the colocalisation of Asap1 with Lamp1 (online supplemental figure S6A). In addition, we found that Asap1 colocalises with PI(3,4)P2 (detected by the NES-mCherry-cPHX3 probe) on Lamp1 positive vesicles in live imaging experiments (figure 4E,F).

PI3K-C2γ-derived PI(3,4)P2 recruits Asap1 that inhibits Arf1 activity. (A, B) Localisation of PI3K-C2γ and Asap1 on Lamp1-positive lysosomes. Representative confocal images of tGFP-labelled PI3K-C2γ, mCherry-labelled ASAP1 and miRFP-labelled LAMP1 in normal culture conditions (NC, (A) or on glutamine withdrawal (0 mM Gln, (B) in Cos7 cells. Dashed white line defines cell limits. White arrows indicate colocalisation of the indicated proteins (scale bar=10 µm). (C, D) Localisation of PI3K-C2γ KD (kinase dead) and Asap1 on Lamp1-positive lysosomes. Representative confocal images of tGFP-labelled PI3K-C2γ KD, mCherry-labelled Asap1 and miRFP-labelled Lamp1 in normal culture conditions (NC, (C) or on glutamine withdrawal (0 mM Gln, (D) in Cos7 cells (scale bar=10 µm). (E, F) Localisation of PI(3,4)P2 and Asap1 on Lamp1-positive lysosomes. Representative confocal images of GFP-labelled PHX3, mCherry-labelled Asap1 and miRFP-labelled Lamp1 in normal culture conditions (NC), (E) or on glutamine withdrawal (0 mM Gln), (F) in Cos7 cells. Dashed white line defines cell limits. White arrows indicate colocalisation of the indicated proteins (scale bar=10 µm). (G) PD of endogenous active Arf1 and western blot analysis of mTORC1 activity probed with indicated antibodies in WT, Asap1 KO overexpressing tGFP or tGFP-PI3K-C2γ on glutamine withdrawal in Panc1 cells. mTORC1, mechanistic target of rapamycin complex 1; PD, pull down, TL, total lysate.
To demonstrate that PI3K-C2γ-derived PI(3,4)P2 is responsible for the regulation of the Asap1-Arf1 axis, we showed that Asap1 can associate not only with PI(4,5)P2, as previously reported,34 but also with PI(3,4)P2 (online supplemental figure S6B,C). As expected, the absence of Asap1 elevated the levels of the active Arf1 (figure 4G) but re-expression of PI3K-C2γ did not rescue active Arf1 levels, indicating that PI3K-C2γ is epistatic to Asap1 (figure 4G). In line with Arf1 activation, pS6K levels were higher in Asap1 KO cells compared with WT controls (figure 4G). To further verify that the interaction between the lipid product PI(3,4)P2 and Asap1 is required for regulating Arf1 activity, we mutagenised the PH domain of Asap1 (R345L) to disrupt the ability to interact with PI(3,4)P2,35 but not PI(4,5)P2 (online supplemental figure S6B,C). We found that re-expression of Asap1 R345L in Asap1 KO cells failed to deactivate Arf1 (online supplemental figure S6D), indicating that the PI(3,4)P2 generated by PI3K-C2γ on lysosomes is required for Asap1-mediated Arf1 inhibition in response to glutamine depletion.
Loss of PI3K-C2γ promotes glutamine metabolism rewiring
Next, we focused on PI3K-C2γ-dependent regulation of cell metabolism. We monitored the catabolic dependency of WT and KO cells using the Seahorse XF96 Mito Stress test to measure oxygen consumption rate in real time conditions. Analysis revealed that basal and maximal respiration were significantly lower in KO cells than WT controls (figure 5A–C and online supplemental figure S7A-C). Glutamine withdrawal for 24 hours dramatically decreased the respiratory capacity of WT cells while KO cells were marginally affected (figure 5A–C), indicating that the catabolic contribution of glutamine in KO cells is negligible. The higher spare respiratory capacity of KO cells (figure 5D and online supplemental figure S7D) was associated with enhanced glycolytic metabolism, as shown by increased glucose consumption and lactate release (figure 5E,F and online supplemental figure S7E,F). Therefore, we hypothesised that glutamine-auxotrophy of the PI3K-C2γ KO cells may be due to a potential non-energetic role of glutamine. Next, we measured the radioactive incorporation into lipids in cells that were cultured using the uniformly (U) radiolabeled 14C-glutamine. Use of glutamine carbon units for lipid and protein synthesis was higher in KO cells than WT controls (figure 5G,H), thus indicating that glutamine carbon skeleton is consumed to support anabolic pathways.

PI3K-C2γ loss induces metabolic rewiring towards the anabolic use of glutamine (A–D) seahorse XFe96 MITO stress test analysis and Oxygen Consumption Rate (OCR) was measured in real time in normal culture condition (2 mM Gln) or on 24 hours of glutamine withdrawal (0 mM Gln 24 hours) (n=3). Basal (B), maximal (C) and spare (D) OCR were measured and normalised on protein levels (n=3). Gln=glutamine, oligo=oligomycin, FCCP=carbonyl cyanide-4 (trifluoromethoxy) phenylhydrazone, Rot/AntA=rotenone/antimycin. (E) Quantification of glucose consumption in normal culture conditions (2 mM Gln) of WT/KO Panc1 cells (n=5). (F) Quantification of lactate production in normal culture conditions (2 mM Gln) of WT/KO Panc1 cells (n=5). (G, H) WT/KO KPC cells were cultured for 24 hours in a medium containing radioactive 14C-glutamine. Lipids and proteins were extracted in parallel and radioactive signal was measured to monitor the amount of glutamine that is incorporated into lipids (G) and proteins (H). Each value was normalised on protein content (n=3). (I) Cell viability assay on WT/KO Panc1 cells at indicated glutamine concentrations after 24 hours (n=5). (J) Growth assay of WT/KO Panc1 cells in normal culture conditions (2 mM Gln) or on glutamine withdrawal (0 mM Gln) (n=5). #: KO 2 mM Gln vs KO 0 mM Gln); *: WT 0 mM Gln vs KO 0 mM Gln. Data are shown as mean±SEM, ANOVA followed by Bonferroni’s post hoc test (B–D, I, J) or Student’s t-test (E–H). ANOVA, analysis of variance. *P<0.05; **P<0.01; ***p<0.001; ***#<0.001.
Glutamine restriction abrogates growth of PI3K-C2γ-deficient cells
Subsequently, we explored the glutamine and glucose dependency of PI3K-C2γ-deficient tumours. While glucose was required for PDAC growth for both WT and KO cells (online supplemental figure S7G,H), most KO cells did not proliferate under glutamine withdrawal (figure 5I and online supplemental figure S7I). To validate the effect of glutamine on cell growth, WT and KO cells were cultured in presence or absence of glutamine. In normal growing conditions, KO cells exhibited significantly higher cell numbers than WT controls but glutamine withdrawal prominently hampered this growth, confirming that KO cells are glutamine-addicted (figure 5J and online supplemental figure S7J). Next, we tested if different glutaminemetabolising pathways could rescue the growth deficit of KO cells on glutamine deprivation. Supplementation of BSA-conjugated palmitate, specifically rescued survival of KO cells while having no effect on WT controls (online supplemental figure S7K). On the contrary, addition of BSA alone did not improve cell survival either in KO or WT cells, thus indicating that only the exogenous supply of fatty acid precursors could bypass glutamine deprivation.
Loss of PI3K-C2γ sensitises pancreatic cancer cells to mTOR and GLS1 inhibitors
To pharmacologically replicate the sensitisation to glutamine depletion observed in the absence of PI3K-C2γ, we tested the effects of BPTES (Bis-2-(5-phenylacetamido-1,3,4-thiadiazol-2-yl) ethyl sulfide) and CB-839 (Telaglenastat), two potent inhibitors of glutaminase 1 (GLS1) activity.36 Like glutamine starvation, administration of BPTES (online supplemental figure S8A,B) as well as CB-839 (figure 6A and online supplemental figure S8C,D) dose-dependently inhibited growth of KO cells, confirming that PI3K-C2γ-deficient cells are addicted to glutamine metabolism and that pharmacological inhibition of glutaminolysis can phenocopy the effect of glutamine restriction (figure 5I and online supplemental figure S7I). Treatment with GLS1 inhibitors increased the level of apoptosis in KO cells, as evidenced by caspase-3/7 activity levels (online supplemental figure S8E) without affecting the upstream phosphorylation status of S6K37 (online supplemental figure S8F,G). Differently from WT, KO cells exhibited sustained AMPK phosphorylation in response to CB-839 administration (online supplemental figure S8H), indicating that interfering with glutamine metabolism strongly activates metabolic stress signalling. The administration of Everolimus (RAD001), a rapamycin analogue inhibiting mTORC1, decreased proliferation more effectively in KO cells than in WT controls, confirming the critical role of mTORC1 hyperactivation in PI3K-C2γ KO cells (figure 6A and online supplemental figure S8D). Likewise, either treatment with Everolimus in the presence of low glutamine (0.1 mM, online supplemental figure S8I) or combinatorial administration of Everolimus with CB-839 significantly hampered PI3K-C2γKO cells cell growth than WT controls, and appeared more effective than single treatments (figure 6A, online supplemental figure S8D and table S3).
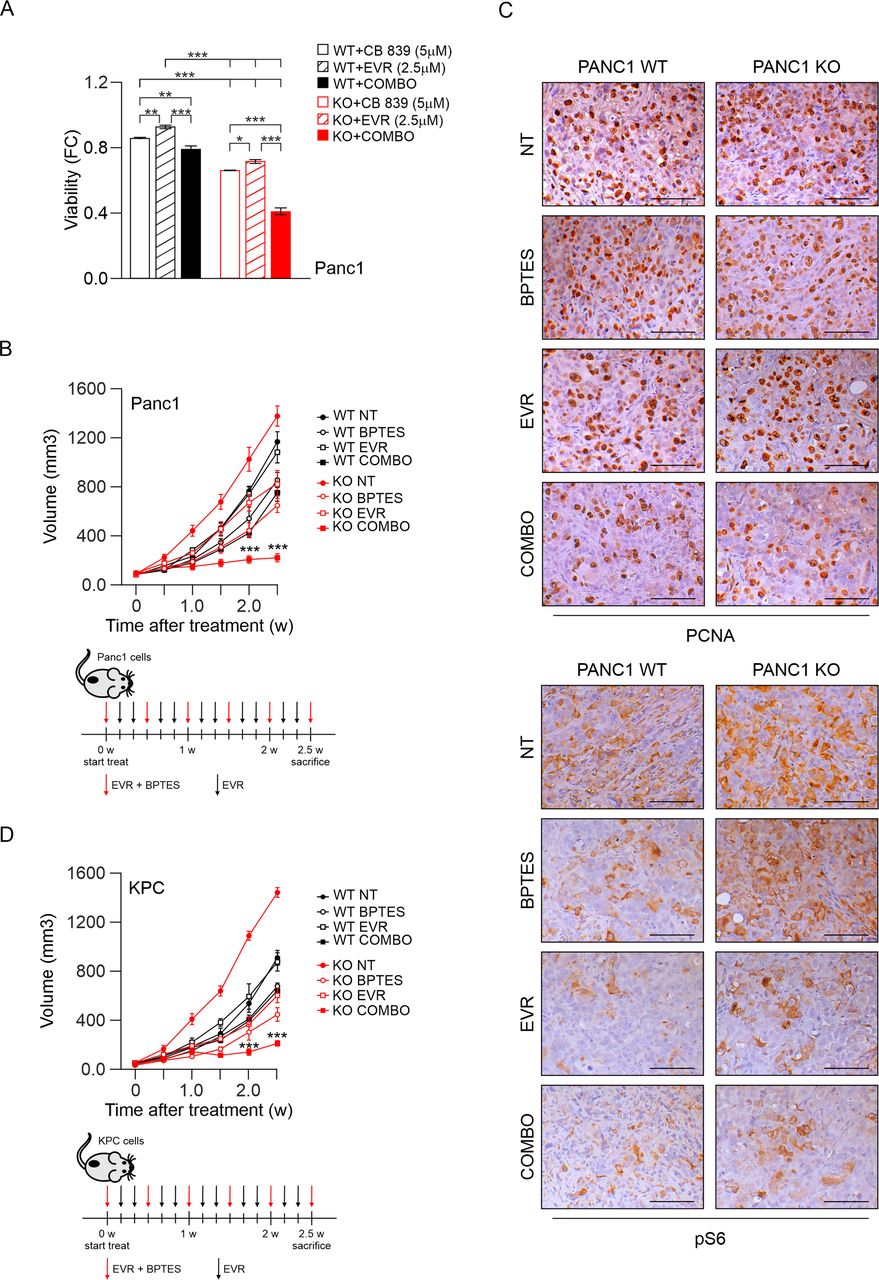
PI3K-C2γ loss sensitises to glutaminase inhibitors in xenograft models. (A) Cell viability assay on WT/KO Panc1 cells after 48 hours of treatment with CB 839 (5 μM), everolimus (2.5 µM) or combination of the two drugs (Combo, n=6). (B) quantification of xenograft tumour growth arising from subcutaneously injected WT/KO Panc1 cells. Mice were treated for 2.5 weeks (w) with intraperitoneal injections of vehicle (NT), BPTES, everolimus (EVR) or combination (COMBO) of the two drugs (n=6). Schematic representation of drugs administration (bottom panels). (C) IHC assessment of the level of PCNA (top) and pS6 (bottom) in tumours taken from mice injected with WT/KO Panc1 cells treated with vehicle (NT), BPTES, everolimus (EVR) or combination (COMBO) of the two drugs for 2.5 weeks. (D) quantification of xenograft tumour growth arising from subcutaneously injected WT/KO KPC cells. Mice were treated for 2.5 weeks (w) with intraperitoneal injections of vehicle (NT), BPTES, everolimus (EVR) or combination (COMBO) of the two drugs (n=6). Schematic representation of drugs administration (bottom panels). Data are shown as mean±SEM, ANOVA followed by Bonferroni’s post hoc test. ANOVA, analysis of variance. *P<0.05; **P<0.01; ***p<0.001.
To explore the antitumour potential of combination therapy in vivo, we first analysed a xenograft tumour model usingPanc1 cells. Administration of everolimus/BPTES alone or in combination was well tolerated and produced no apparent morbidity and/or mortality in mice. In vivo administration of Everolimus did not affect growth of WT Panc1 xenografts but, at 2.5 weeks of treatment, this drug appeared to effectively inhibit growth of PI3K-C2γ-deficient tumours (p<0.001; figure 6B). Likewise, BPTES inhibited cancer growth more strongly in KO than in WT Panc1 xenografts (p<0.05; figure 6B). Furthermore, the combination of Everolimus and BPTES resulted in a stronger anticancer response, that was again more pronounced in KO than in WT xenografts (p<0.001; figure 6B). Consistently, PI3K-C2γ deleted tumours treated with combination therapy exhibited reduced levels of PCNA staining compared with WT and to untreated KO controls (figure 6C). In line with in vitro data, Everolimus but not BPTES treatment reduced S6 phosphorylation in tumour samples (figure 6C). Similar results were also obtained in a second mouse model where KPC murine cells were subcutaneously injected in syngeneic mice (figure 6D and S9A). Finally, efficacy of the everolimus/BPTES combination was tested in KPC mouse model (online supplemental figure S9B-D). T2w MRI showed the presence of ascites and pancreatic tumours, that appeared as heterogeneous hyperintense nodules in all groups (online supplemental figure S9B). The combo therapy delayed progression, improved tumour edge definition, and reduced abdominal spread (online supplemental figure S9B). Accordingly, the combo treatment significantly increased survival of KO mice (100% vs 80% survival at 8 weeks of combo and vehicle-treated KO mice, respectively; n=5 per group, p=0.01 by log-rank Mantel-Cox test, online supplemental figure S9C). In line with previous results, PCNA was less intense in KPC KO tumours treated with the combo than in treated WT tumour samples or untreated KO controls (online supplemental figure S9D). Collectively, these results indicated that the combination therapy is more effective in the PI3K-C2γ KO genetic background, demonstrating that loss of PI3K-C2γ sensitises pancreatic cancer cells and tumours to mTOR and GLS1 inhibitors (online supplemental figure S10).
Discussion
Pancreatic cancer is one the most aggressive tumours and currently available therapies are only minimally effective in treating this disease. The metabolism of pancreatic cancer is adapted to support tumour growth in its nutrient-deprived environment.2
A central integrator of cell growth and nutrient availability is the mTOR pathway, which drives metabolic reprogramming to support the biosynthetic needs of cancer cells.38 While mTOR is activated by class I PI3K, our results indicated that class II PI3K-C2γ acts as a negative regulator of mTOR signalling, in line with previous findings.13 The fact that class II PI3Ks work differently from class I enzymes is consolidating and, while the role of class I PI3K as oncogenes is well established, class II PI3K are emerging as tumour suppressors controlling cell division39 as well as other cellular functions linked to cell growth.12 16 40 In this study, we demonstrated that the loss of PI3K-C2γ in mice confers a growth advantage to pancreatic cancer cells, correlating with hyperactivation of the mTORC1 signalling and metabolic shift towards glutamine dependency. In agreement, increased phosphorylation of the S6 correlated with decreased expression of PI3K-C2γ in a cohort of patients. Although only a trend could be evidenced for another mTORC1 effector, like 4EBP1, this potential inconsistency might be attributed not only to the relatively small number of samples analysed (n=37) but also to the ability of 4EBP1 to be regulated by multiple pathways other than that of mTORC1.41 In further support to our hypothesis, reduced expression of PI3K-C2γ correlated with poor prognosis and a more aggressive phenotype, not only indicating a function of PI3K-C2γ as a tumour suppressor in PDAC but also suggesting a role of this protein as a potential prognostic biomarker.
At the molecular level, our results demonstrated that PI3K-C2γ restrains mTORC1 activity at the lysosome through the production of a restricted pool of PI(3,4)P2 in response to glutamine withdrawal. Various effectors can relay inhibitory signals to restrain mTORC1 activity,11 30 including the class II PI3K-C2β isoform.13 Nevertheless, while PI3K-C2β acts on growth factor deprivation,13 14 our results showed that PI3K-C2γ selectively responds to glutamine starvation. In particular, glutamine deprivation couples PI3K-C2γ activity to mTORC1 signalling, leading to the accumulation of a PI3K-C2γ-generated pool of PI(3,4)P2 that in turn reduces S6K phosphorylation. How PI3K-C2γ translocation to lysosomes is regulated by glutamine availability is at this stage unclear and the focus of future studies. Nonetheless, our findings are in line with phospholipids playing a key role in the control of metabolic responses through the docking of PH-domain containing proteins.15 42
In agreement with the established role of mTORC1 in promoting anabolic reactions,30 our results showed that the loss of PI3K-C2γ rewires glutamine metabolism to support lipid and protein biosynthesis, sustaining the higher growth rate of KO cells. However, failure of PI3K-C2γ-deficient tumours to limit mTORC1 signalling and anabolic processes leading to glutamine addiction can turn detrimental when glutamine levels decline. Our findings showed that cells lacking PI3K-C2γ become auxotrophic for glutamine, a condition that characterises several glutamine-dependent tumours.7 In PI3K-C2γ-deficient tumours, glutamine consumption thus exceeded its biosynthesis, leading to synthetic lethality between loss of PI3K-C2γ and glutamine starvation. Therefore, the inability of PI3K-C2γ KO tumours to curtail cell growth in nutrient limiting-condition results in a ‘metabolic catastrophe’, a metabolic state in which high anabolic demand is contrasted by insufficient energy production.43 Based on these findings, targeting the metabolic phenotype of PI3K-C2γ-deficient tumours can be further exploited by specific therapeutic strategies in pancreatic cancer.
This critical role of glutamine in pancreatic cancer has fostered the development of pharmacological strategies to target glutamine utilisation.4 A crucial step in the metabolism of glutamine that supports cancer growth is its conversion to glutamate by the enzyme glutaminase (GLS1). Inhibitors of GLS1, such as CB-839, showed clinical benefits in PDAC patients44 (NCT03263429). Moreover, a combination therapy of CB-839 with Everolimus is currently undergoing clinical trials in patients with advanced solid tumours (NCT02071862), indicating that the drug combination is well tolerated.45 Nevertheless, biomarkers are needed to identify different sub-populations of patients who can receive highest benefit from glutaminase inhibitors.
Our findings provide a rationale for targeting glutamine metabolism in combination with mTOR inhibitors in tumours with reduced expression of PI3K-C2γ and hyperactive mTOR signalling. Furthermore, our study suggests that targeting PI3K-C2γ or its downstream effectors may unveil metabolic vulnerabilities that can be further exploited for pancreatic cancer therapy, if cotreated with mTOR inhibitors.
Data availability statement
Data are available in a public, open access repository. Data are available on reasonable request. All data relevant to the study are included in the article or uploaded as online supplemental information. Not applicable.
Ethics statements
Patient consent for publication
Ethics approval
Ethics approval number 1885 from the Integrated University Hospital Trust (AOUI) Ethics Committee (Comitato Etico Azienda Ospedaliera Universitaria Integrata) was approved in their meeting of 17 November 2010 and documented by the ethics committee 52070/CE on 22 November 2010 and formalised by the Health Director of the AOUI on the order of the General Manager with protocol 52 438 on 23 November 2010.The study protocol was approved by the local Ethics Committee at University Hospital of Pisa, Italy (Comitato di Bioetica, Azienda Ospedaliero-Universitaria Pisana, protocol number: 3909, July third, 2013).
Acknowledgments
We thank Prof. Andrea Graziani, Dr. Alessio Menga, Dr. Carlo Cosimo Campa, Prof. Vincenzo Calautti, Prof. Riccardo Taulli and Prof. Chiara Ambrogio for critically reading the manuscript and useful discussion. We acknowledge the Open Lab of Advanced Microscopy (OLMA) at the Molecular Biotechnology Centre (MBC) for support and Euro-BioImaging (www.eurobioimaging.eu) for providing access to imaging technologies and services via the MultiModal Molecular Imaging Italian Node (Torino, Italy). The data of the PanCuRx cohort used in this study were generated with the support of the Ontario Institute for Cancer Research through funding provided by the Government of Ontario.
References
Supplementary materials
Supplementary Data
This web only file has been produced by the BMJ Publishing Group from an electronic file supplied by the author(s) and has not been edited for content.
Footnotes
Twitter @SilviaAndreani7
EH and MM contributed equally.
Contributors Conceptualisation: MCDS, EH, MM; Methodology: MCDS, LG, AC, JPM, FG, EDG, RL, GS, SA, PD, CV, EG, VC, PEP, AM, EH and MM; Data curation: PD, CV and VCValidation: MCDS, EH and MM; Formal Analysis: MCDS, LG, AC, ER, JPM, FG, EM, NL, MB, RL, GS, SA, PD, CV, EG, VC, AM and MM. Investigation: MCDS, LG, AC, ER, JPM, FG, EM, NL, MB, RL, GS, SA, PD, CV, EG, VC, AM and MM. Resources: PDAC, FN, CV, EG, VC, AS; Writing-original draft preparation, MCDS, EH and MM; Visualisation: MCDS, EH, MM; Supervision: VC, AS, PEP, AM, EH, MM; Project Administration: MCDS, EH, MM; Funding Acquisition: EH, MM; Guarantor: MCDS, EH, MM.
Funding MCDS and JPM are supported by Fondazione Italiana per la Ricerca sul Cancro/Associazione Italiana Ricerca sul Cancro (FIRC/AIRC) fellowships (22 248 and 22558). FG is supported by Fondazione Pezcoller/SIC-Patrizia Coser. MM is supported by Worldwide Cancer Research grant (WWCR, 20–0033). EH is supported by AIRC (21875), MIUR (Ministero Università Ricerca, PRIN 2017) and Leducq Transatlantic Network of Excellence (19CVD02). EG is supported by AIRC (IG24444) and Dutch Cancer Society (KWF-11957). PD is supported by Fondazione Nadia Valsecchi Onlus. VC and AS are supported by AIRC (18 718 and 12182). AS is also supported by Italian Ministry of Health (FIMPDACUP_J38D19000690001). PEP is supported by AIRC (MFAG 2018 - ID. 21564). MB is supported by Fondazione Pezcoller/SIC Prof.ssa De Gasperi Ronc. AM is supported by AIRC and Fondazione Cassa di Risparmio di Firenze (IG22941 and MultiUser19515). FN is supported by AIRC (IG19931) and Fondazione Ricerca Molinette Onlus (Fondo CD38, Fondo Ursula and Giorgio Cytron). The data presented in the current study were in part generated using the equipment of the Facility di Medicina Molecolare, funded by 'Ministero dell’Istruzione dell’Università e della Ricerca-Bando Dipartimenti di Eccellenza 2018–2022' (AM).
Competing interests EH is a founder of Kither Biotech, a company involved in the development of PI3K inhibitors. The authors declare no potential conflicts of interest.
Patient and public involvement Patients and/or the public were not involved in the design, or conduct, or reporting, or dissemination plans of this research.
Provenance and peer review Not commissioned; externally peer reviewed.
Supplemental material This content has been supplied by the author(s). It has not been vetted by BMJ Publishing Group Limited (BMJ) and may not have been peer-reviewed. Any opinions or recommendations discussed are solely those of the author(s) and are not endorsed by BMJ. BMJ disclaims all liability and responsibility arising from any reliance placed on the content. Where the content includes any translated material, BMJ does not warrant the accuracy and reliability of the translations (including but not limited to local regulations, clinical guidelines, terminology, drug names and drug dosages), and is not responsible for any error and/or omissions arising from translation and adaptation or otherwise.