Article Text

Abstract
Objective p63 is a transcription factor within the p53 protein family that has key roles in development, differentiation and prevention of senescence, but its metabolic actions remain largely unknown. Herein, we investigated the physiological role of p63 in glucose metabolism.
Design We used cell lines and mouse models to genetically manipulate p63 in hepatocytes. We also measured p63 in the liver of patients with obesity with or without type 2 diabetes (T2D).
Results We show that hepatic p63 expression is reduced on fasting. Mice lacking the specific isoform TAp63 in the liver (p63LKO) display higher postprandial and pyruvate-induced glucose excursions. These mice have elevated SIRT1 levels, while SIRT1 knockdown in p63LKO mice normalises glycaemia. Overexpression of TAp63 in wild-type mice reduces postprandial, pyruvate-induced blood glucose and SIRT1 levels. Studies carried out in hepatocyte cell lines show that TAp63 regulates SIRT1 promoter by repressing its transcriptional activation. TAp63 also mediates the inhibitory effect of insulin on hepatic glucose production, as silencing TAp63 impairs insulin sensitivity. Finally, protein levels of TAp63 are reduced in obese persons with T2D and are negatively correlated with fasting glucose and homeostasis model assessment index.
Conclusions. These results demonstrate that p63 physiologically regulates glucose homeostasis.
- liver
- glucose metabolism
- diabetes mellitus
- diet
Data availability statement
Data are available upon reasonable request.
This is an open access article distributed in accordance with the Creative Commons Attribution 4.0 Unported (CC BY 4.0) license, which permits others to copy, redistribute, remix, transform and build upon this work for any purpose, provided the original work is properly cited, a link to the licence is given, and indication of whether changes were made. See: https://creativecommons.org/licenses/by/4.0/.
Statistics from Altmetric.com
WHAT IS ALREADY KNOWN ON THIS TOPIC
The role of p63 in glucose metabolism has been assessed using a global knockout (KO) for the isoform TAp63 (Su et al, Cell Metab;16(4):511–25). Those mice were obese, showed premature ageing and reduced life span and displayed lower levels of SIRT1.
WHAT THIS STUDY ADDS
Hepatic p63 expression, and more precisely the isoform TAp63, is reduced after fasting and refeeding normalises TAp63 expression.
Mice lacking TAp63 in hepatocytes, which do not display alterations in body weight, proliferation or apoptosis, have higher blood glucose excursions during a fasting-induced feeding or pyruvate administration.
p63 binds to the promoter of SIRT1, which is essential to maintain normal gluconeogenesis, and inhibits its activity.
Silencing SIRT1 in TAp63 liver KO mice normalises glucose levels.
Insulin stimulates p63 and mice and human hepatocytes without p63 do not respond to insulin-induced suppression of gluconeogenesis.
In patients with type 2 diabetes, hepatic TAp63 levels are decreased and negatively correlated with fasting glucose and insulin resistance.
HOW THIS STUDY MIGHT AFFECT RESEARCH, PRACTICE AND/OR POLICY
p63 is a transcription factor modulating the expression of a large number of genes. Understanding its function in glucose metabolism may help to identify novel genes associated to the control of glucose metabolism.
Our data showing that TAp63 levels are altered in patients with type 2 diabetes suggest that they are of clinical relevance.
Introduction
Members of the p53 protein family of transcription factors (including p63 and p73) generally show high structural similarities,1 2 but can exhibit different functions and expression profiles, as well as distinct biological effects through different mechanisms. p63 is expressed as two major isoforms: the TAp63 form that contains an N-terminal transactivation (TA) domain, and the N-terminal truncated (ΔNp63) isoform that lacks this domain.3 4 p63 acts as a master transcription factor of stem cell pluripotency and is crucial in basal epithelial development, differentiation and prevention of senescence. However, more recent evidence has shown that p63 is also involved in different aspects of metabolism. For instance, heterozygous p63 mice show weight loss,5 and mice lacking TAp63 develop late-onset obesity.6
The liver plays a key role in the metabolic flexibility adapting fuel oxidation to nutrient availability.7 In mouse liver, TAp63 is induced after consumption of a high-fat diet, and its hepatic-specific knockdown ameliorates high-fat diet-induced steatosis by reducing inflammation, endoplasmic reticulum stress and de novo lipogenesis.8 In human squamous cell carcinoma samples, p63 targets fatty acid synthase and promotes prosurvival effects.9 Proliferating cells require not only fatty acids but also large amounts of glucose to cope with their high energetic needs.10 Of note, p63 has been identified as one of the genes that dictates glucose reliance in squamous cell carcinomas.11 However, the physiological role of p63 in glucose homeostasis remains largely unknown. Mice lacking TAp63 in the whole body show premature ageing and reduced lifespan,12 13 and are obese, glucose intolerant and insulin resistant.6 Taking into consideration that: (1) p63 is widely expressed, (2) p63 plays tissue-specific roles and (3) glucose homeostasis is differentially regulated at multiple organs, the conclusions of total null models concerning glucose metabolism must be supported by additional tissue-specific models and evidence.
In the present work, we investigated the specific role of hepatic p63 in (1) maintaining blood glucose levels in physiological conditions, based on the capacity of the liver to store glucose as glycogen in the fed state and (2) releasing glucose during fasting, a process that must be tightly regulated to protect the body from an irreversible loss of resources. Our interest in uncovering the metabolic adaptations that make this balance possible was boosted by the findings that intermittent fasting plays a beneficial role in preventing the development and progression of ageing and several disease states.14 15 Our results indicated that p63 in liver rapidly decreased on fasting and increased when food is available. Mice lacking TAp63 in liver displayed an increased gluconeogenic capacity, while mice overexpressing this transcription factor showed the opposite phenotype; this fits with the fact that TAp63 binds SIRT1 gene promoter repressing its transcriptional expression, a well-known inductor of hepatic glucose production.16 Finally, TAp63 was reduced in liver of patients with type 2 diabetes (T2D) and showed a negative correlation with fasting glucose, homeostasis model assessment (HOMA) index and SIRT1 levels.
Methods
Animals
Animal experiments were conducted in accordance to the standards approved by the Faculty Animal Committee at the University of Santiago de Compostela, and the experiments were performed in agreement with the Rules of Laboratory Animal Care and International Law on Animal Experimentation.
Patients
Liver samples were obtained from patients with morbid obesity undergoing bariatric surgery (n=60) at the Clínica Universidad de Navarra.
Please see detailed methods in online supplemental material.
Supplemental material
Results
Nutritional availability regulates p63 in liver
Mice subjected to 24-hour fasting showed reduced p63 mRNA expression in the liver; of note, refeeding not only reversed but even increased its expression as compared with ad libitum-fed mice (figure 1A). The fasting-induced reduction of expression was observed as early as 6 hours of fasting (figure 1B). After a 12-hour overnight fasting, mice had access to food, and hepatic p63 expression was rapidly induced, with a tendency for upregulation at 30 min (p=0.06) and a significant upregulation after 1 hour (figure 1B). The results obtained in mice were reproduced in vitro in human hepatic THLE-2 cells: p63 expression levels decreased in starved cells after 30 min and remained low up to 4 hours (figure 1C). We then tested mice subjected to a 60% caloric restriction for 4 days, a physiological condition that (similar to fasting) promotes hepatic gluconeogenesis.17 p63 mRNA expression was likewise significantly decreased as compared with mice fed ad libitum (figure 1D).

Nutritional availability regulates hepatic p63. (A) p63 mRNA levels in the liver of wild-type (WT) mice fed ad libitum, fasted for 24 hours or refed (RF) for 24 hours after 24-hour fasting. (B) p63 mRNA levels in the liver of WT mice fed ad libitum (baseline) or fasted for 6 or 12 hours and refed for 30 min, 1 hour or 2 hours after overnight (12-hour) fasting. (C) p63 mRNA levels in THLE-2 cells maintained in complete medium (CM) (baseline) or starved in Krebs–Henseleit–HEPES buffer (KHH) for indicated times. (D) p63 mRNA levels in liver of mice subjected to a 60% caloric restriction (CR) for 4 days. (E) p63 mRNA levels in the liver of WT mice fed ad libitum, fasted 24 hours or fasted for 24 hours and fed with sugar. (F) p63 mRNA levels in THLE-2 cells maintained in CM or starved in KHH with or without glucose (10 mM). (G) p63 mRNA levels in THLE-2 cells maintained in CM or starved in KHH with or without glucose (10 mM) and 2-deoxy-d-glucose (10 mM). Expression of hipoxantina-guanina fosforibosiltransferasa (HPRT) served as loading control, and control values were normalised to 100%. Data are presented as mean±SE mean. *P<0.05, **p<0.01, ***p<0.001, using a Student’s t-test (B–D), or one way analysis of variancfollowed by a Bonferroni multiple comparison test (A,E–G).
As p63 mRNA levels were low in hypoglycaemic conditions (eg, fasting or caloric restriction) and high after refeeding (when blood glucose is elevated), we aimed to find out which signal of the nutritional status was behind its regulation. We first evaluated if glucagon and FGF21, essential fasting hormones, could modulate hepatic p63 levels. Neither glucagon administration in wild-type (WT) mice, nor in glucagon receptor knockout (KO) mice, affected hepatic p63 expression (online supplemental figure S1A). In line with these findings, there were no differences in hepatic p63 levels between WT and glucagon receptor (GCNR) KO subjected to fasting (online supplemental figure S1B). Moreover, FGF21 knock down did not modify hepatic p63 expression (online supplemental figure S1C,D). Given these negative results, we next investigated whether circulating glucose itself could modulate hepatic p63 expression. For this, we placed mice under a 24-hour fast with or without a sugar supplement. As previously reported,8 18 fasted mice receiving sugar lost the same weight as the non-sugar supplemented fasted mice, but their blood glucose levels remained steady, similar to mice fed ad libitum. Further, fasting reduced hepatic p63 expression, but mice receiving sugar during fasting showed a marked increase in p63 expression, which was significantly higher than in mice fed ad libitum (figure 1E). Notably, after incubating human THLE-2 cells in a starvation medium (Krebs–Henseleit–HEPES buffer (KHH)) with or without glucose for 2 hours, we observed higher levels of p63 in the glucose-supplemented cells than in the non-supplemented cells (figure 1F). In addition, glucose-induced p63 upregulation was completely blocked by the coadministration of 2-deoxy-d-glucose (figure 1G), which cannot undergo further glycolysis, suggesting that glucose itself is able to regulate p63 expression.
Further, in liver of 24-hour fasted mice, the levels of the TAp63 protein were significantly reduced (online supplemental figure S1E), but the protein levels of ΔNp63 and the ΔNp63 mRNA did not change (online supplemental figure S1F,G). Thus, the p63 isoforms were regulated distinctly by nutrient deprivation, with only TAp63 being affected. We also measured the regulation of p63 by nutrient availability in different tissues such as WAT, BAT, muscle, kidney and intestine. We found that the expression of p63 in these organs remained unchanged on fasting (online supplemental figure S1H). To further control the efficiency of our animal model on fasting, not only in the liver but also in extrahepatic tissues that are relevant for gluconeogenesis such as intestine and kidney, we have also measured the expression of gluconeogenic genes in those organs. We found that both G6Pase and PCK1 were indeed elevated on 24 hours of fasting and reduced after refeeding in kidney and intestine (online supplemental figure S1I,J).
Mice lacking TAP63 in liver display an increased gluconeogenic capacity
As hepatic TAp63 expression was regulated by nutrient availability, we generated two TAp63 conditional KO mouse models to study in detail the role of endogenous hepatic TAp63 in glucose metabolism. One model was generated by injecting AAV8-Cre into the tail vein of adult TAp63 floxed mice, to give a liver KO at adult stages (figure 2A); for the other model, TAp63 floxed mice were crossed with mice that expressed Cre recombinase under the control of the albumin gene promoter with α-fetoprotein enhancer (Alfp-Cre), resulting in the lack of TAp63 specifically in the hepatocytes (TAp63LKO) starting from the embryonic stages (figure 2F). The expression of p63 remained unaltered in other tissues including white adipose tissue (WAT), brown adipose tissue (BAT), muscle, kidney and intestine (online supplemental figure S2A).

Hepatic TAp63 regulates postprandial glucose. (A) p63 mRNA levels in FloxTAp63 mice injected with AAV8-GFP or AAV8-Cre. (B) Blood glucose in FloxTAp63 mice injected with AAV8-GFP or AAV8-Cre and subjected to a pyruvate tolerance test (PTT). Food intake (C) and postprandial glucose levels (D) in FloxTAp63 mice injected with AAV8 expressing either GFP or CRE, refed (RF) with chow diet. (E) SIRT1 mRNA levels and hepatic protein levels of SIRT1, PCK1 and G6Pase. (F) p63 mRNA levels in control mice and Alfp-Cre FloxTAp63 (TAp63LKO) mice. (G) Blood glucose in TAp63LKO mice subjected to a PTT. Food intake (H) and postprandial glucose levels (I) in TAp63LKO mice RF with chow diet. (J) SIRT1 mRNA levels and hepatic protein levels of SIRT1, PCK1 and G6Pase. Area under curve (AUC) is also shown. (K) Glucose infusion rate in control mice and TAp63LKO. (L) Tissue glucose uptake from brown adipose tissue (BAT) white adipose tissue (WAT) and muscle in control mice and TAp63LKO. Subcutaneous adipose tissue (SAT), perigonadal visceral adipose tissue (pgVAT) and renal perivascular adipose tissue (rpVAT). (M) p63 mRNA levels in control and TAp63 LKO mice injected with AAV8-GPF and AAV8-TAp63. (N) Blood glucose in control and TAp63 LKO mice injected with AAV8-GPF and AAV8-TAp63 subjected to PTT. Food intake, postprandial blood glucose (O) and protein levels (P) of SIRT1, PCK1 and G6Pase in control and TAp63 LKO mice injected with AAV8-GPF and AAV8-TAp63. Expression of HPRT (qRT-PCR) and GAPDH (western blot) served as loading control, and control values were normalised to 100%. Data are presented as mean±SE mean. *P<0.05, **p<0.01, ***p<0.001, using a Student’s t-test (A,B,D–G,I,J,L), or one-way analysis of variance followed by a Bonferroni multiple comparison test (M–P). *Indicates differences compared with control group. #Indicates differences between AAV8-GFP and AAV8-CRE mice.
As compared with the respective control mice, both groups of KO mice showed similar food intake, body weight and blood glucose levels during the glucose tolerance test (GTT), insulin tolerance test (ITT) and glutamine tolerance test (online supplemental figure S2B,C); however, they showed pyruvate-induced hyperglycaemic (figure 2B,G), indicating an increased gluconeogenic capacity. We next performed a refeeding experiment after an overnight fasting in both mouse models; to maintain glucose homeostasis in this physiological condition, hepatic gluconeogenesis must be inhibited as a required metabolic shift from the fasted to the fed states.19 We found that the mice lacking TAp63 in the liver displayed higher blood glucose levels than WT mice (figure 2D,I), despite eating the same amount of food (figure 2C,H). To note, when challenged by an oral glucose tolerance test (OGTT), TAp63 liver KO mice displayed higher levels of glucose after 15 min but area under the curve did not change (online supplemental figure S2D). At molecular level, proteins implicated in glucose synthesis were elevated in both models lacking TAp63 in the liver at 60 min after refeeding; these proteins including SIRT1 (also modulated at mRNA level), PCK1 and G6Pase (figure 2E,J). Given that mice lacking hepatic p63 showed increased glucose levels during the pyruvate tolerance test (PTT) without changes in the ITT and GTT, we performed an euglycaemic–hyperinsulinemic clamp to find out if this finding could be due to any tissue/organ compensation during the latter tests contributing to maintain normal blood glucose levels. It was found that, during the euglycaemic–hyperinsulinemic clamp, the glucose infusion rate was increased in fasted TAp63 liver KO mice compared with control fasted mice (figure 2K). In addition, these mice also showed a higher glucose uptake in different white fat depots but not in brown fat or skeletal muscle (figure 2L).
To further explore the relevance of TAp63 on hepatic glucose production, both mouse models lacking TAp63 in the liver and their controls were subjected to 24 hours of fasting. They displayed higher blood glucose levels (online supplemental figure S3A,E) with no differences in circulating FGF21, glucagon or transaminases (online supplemental figure S3B-H). Importantly, levels of gluconeogenic enzymes were also measured in the intestine and kidney of these animal models, but no differences were detected (online supplemental figure S3I-L), highlighting the specific role of hepatic gluconeogenesis in the observed phenotype. Finally, circulating levels of FGF21 and glucagon in both animal models were also measured after refeeding, without significant differences (online supplemental figure S4). The effects of a lack of hepatic TAp63 on glucose homeostasis were not caused by alterations in apoptosis or cell proliferation, as immunostainings for cleaved caspase 3 and Ki67 (markers of apoptosis and proliferation, respectively) were similar in mice lacking hepatic TAp63 as in control mice (online supplemental figure S5). These effects were, however, clearly visible in liver from a mouse with hepatocellular carcinoma (used as a control).

p63 binds to SIRT1. (A) Two putative motifs for TP63 found in the SIRT1 promoter using the JASPAR database. Eukaryotic Promoter Database identifies TP63 binding sites (black spots) in the SIRT1 promoter. (B) Luciferase reporter assay in AML12 cells transfected with the control si (si0) or sip63, and the control pTa-luciferase or pTA-202-Sirt1-luciferase for 48 hours, and luciferase activity was measured. (C) p63 and SIRT1 mRNA levels in AML12 cells transfected with si0 or sip63. (D) SIRT1 activity in AML12 cells transfected with si0 or sip63. Cells were kept in complete medium (CM). (E) Luciferase reporter assay in AML12 starved cells (kept in Krebs–Henseleit–HEPES buffer (KHH)) transfected with the control plasmid (p0) or a plasmid overexpressing Tap63 (pp63), and the control pTa-luciferase or pTA-202-Sirt1-luciferase for 24 hours. (F) p63 and SIRT1 mRNA levels in AML12 starved cells transfected with p0 or pp63. (G) SIRT1 activity in AML12 starved cells transfected with p0 or plasmid overexpressing TAp63. (H) Chromatin immunoprecipitation (ChIP) assay. Soluble chromatin prepared from AML 12 cells transfected with the pCDNA3 (empty vector) or the TAp63-FLAG vector for 48 hours was immunoprecipitated with an anti-FLAG antibody or control IgG. The immunoprecipitated DNA was amplified by PCR using primers amplifying the proximal binding site of p63 in the SIRT1 gene promoter. Intensity of the PCR product from three experiments was quantified. Expression of HPRT served as loading control, and control values were normalised to 100%. Data are presented as mean±SE mean. *P<0.05, **p<0.01, ***p<0.001, using a Student’s t-test (C,D,F–H), or one-way analysis of variance followed by a Bonferroni multiple comparison test (B,E).

Hepatic TAp63 regulates gluconeogenesis via SIRT1. (A) Pyruvate tolerance test (PTT), glucose tolerance test (GTT) and insulin tolerance test (ITT) in control or TAp63LKO mice after being injected with sh-luciferase or sh-SIRT1. (B) Postprandial glucose levels in control and TAp63LKO mice after being injected with sh-luciferase or sh-SIRT1. (C) SIRT1, PCK1 and G6Pase protein levels in control or p63 LKO mice after being injected with sh-luciferase or sh-SIRT1 after refeeding (RF). Area under curve (AUC) is also shown. (D) ALT and AST levels in control or TAp63LKO mice after being injected with sh-luciferase or sh-SIRT1. (E) SIRT1 mRNA levels in mice after being injected with sh-luciferase or sh-SIRT1. Expression HPRT (qRT-PCR) of GAPDH (western blot) served as loading control, and control values were normalised to 100%. Data are presented as mean±SE mean. *P<0.05, **p<0.01, ***p<0.001, using one-way analysis of variance followed by a Bonferroni multiple comparison test. *Indicates differences compared with control group. #Indicates differences between sh-luciferase and sh-SIRT1 mice.

Hepatic TAp63 overexpression worsens gluconeogenesis. (A) p63 mRNA levels in wild-type (WT) mice injected with AAV8-GFP or AAV8-TAp63. Food intake (B) and cumulative body weight gain (C) in WT mice injected with AAV8-GFP or AAV8-TAp63. (D) Pyruvate tolerance test (PTT), glucose tolerance test (GTT) and insulin tolerance test (ITT) in WT mice injected with either AAV8-GFP or AAV8-TAp63. (E) Body weight and blood glucose in mice fed ad libitum or subjected to a 60% caloric restriction (CR). (F) SIRT1 protein levels in each of the groups described above. (G) SIRT1 protein levels in WT mice fed ad libitum or fasted 24 hours. Blood glucose (H) and SIRT1 protein levels (I) in WT mice injected with AAV8-GFP or AAV8-TAp63. Expression of HPRT (qRT-PCR) or GAPDH (western blot) served as loading controls; control values were normalised to 100%. Data are presented as mean±SE mean. *P<0.05, **p<0.01, ***p<0.001, using a Student’s t-test (A,D,E,G–I), or one-way analysis of variance followed by a Bonferroni multiple comparison test (F). AUC, area under curve.
We then rescued TAp63 in the liver of TAp63LKO mice (figure 2M) by injecting AAV8 harbouring a WT TAp63 cDNA; expression of TAp63 reversed pyruvate-induced and refeeding-induced hyperglycaemic (figure 2N,O), with no differences during a GTT or the ITT (online supplemental figure S6). Further, after restoring hepatic TAp63 in the TAp63LKO mice, we detected no increase in SIRT1 or the gluconeogenic enzymes PCK1, or G6Pase after refeeding (figure 2P). Altogether, these data indicated that a deficiency of hepatic TAp63 favoured the production of hepatic glucose by increasing the levels of gluconeogenic genes, and that a rescue of TAp63 reversed these effects. p63 binds to SIRT1 promoter and regulates its activity

Hepatic TAp63 mediates insulin actions. (A) p63 mRNA levels in mice injected with saline or insulin 5 U/kg into the cava vein. (B) p63 mRNA levels in THLE-2 cells kept in complete medium (CM), KHH or KHH with insulin (10 nM). (C) p63 mRNA levels in THLE-2 cells kept in CM, KHH, KHH with insulin (10 nM) or KHH with insulin (10 nM) and LY294002 (10 nM). (D) Protein levels of pAKT and SIRT1 in FloxTAp63 mice injected AAV8 expressing either GFP or CRE treated with saline or insulin into the cava vein. (E) Protein levels of pAKT and SIRT1 in THLE-2 cells treated with saline or insulin (10 nM). (F) Glucose production in THLE-2 cells transfected with si0 or sip63 in the presence or absence of insulin (10 nM). (G) SIRT1 protein levels in wild-type mice injected with a virus encoding GFP or overexpressing TAp63. Expression of HPRT (qRT-PCR) or GAPDH (western blot) served as loading control, and control values were normalised to 100%. Data are presented as mean±SE mean. *P<0.05, **p<0.01, ***p<0.001, using a Student’s t-test (A,D,E), or one-way analysis of variance followed by a Bonferroni multiple comparison test (B,C,F,G).
SIRT1 is a nutrient-sensing deacetylase whose levels and activity increase with caloric restriction, thereby preserving euglycaemia by activating hepatic gluconeogenesis. For instance, SIRT1 plays a key role in the fasting adaptive response by stimulating the expression of essential gluconeogenic enzymes, including G6Pase and PCK1.16 20 As we observed that SIRT1 levels were elevated in mice lacking hepatic TAp63 and that SIRT1 levels are restored after the rescue of TAp63 expression in TAp63LKO mice, we evaluated the relationship between p63 and SIRT1 to regulate hepatic gluconeogenesis. By searching for potential binding sites of p63 in the SIRT1 promoter using the JASPAR database (http://jaspar.genereg.net/), we found a total of 19 putative binding sites for p63 (online supplemental figure S7A) in both Mus musculus and Homo sapiens SIRT1 gene promoters. However, when applying restrictive conditions, using a p value<0.001, we only detected one binding site in the first −100 base pairs (bp) upstream from the start transcription site in the SIRT1 promoter region (https://epd.epfl.ch//index.php) (figure 3A). Of note, this fragment is conserved between mice and humans (online supplemental figure S7B).

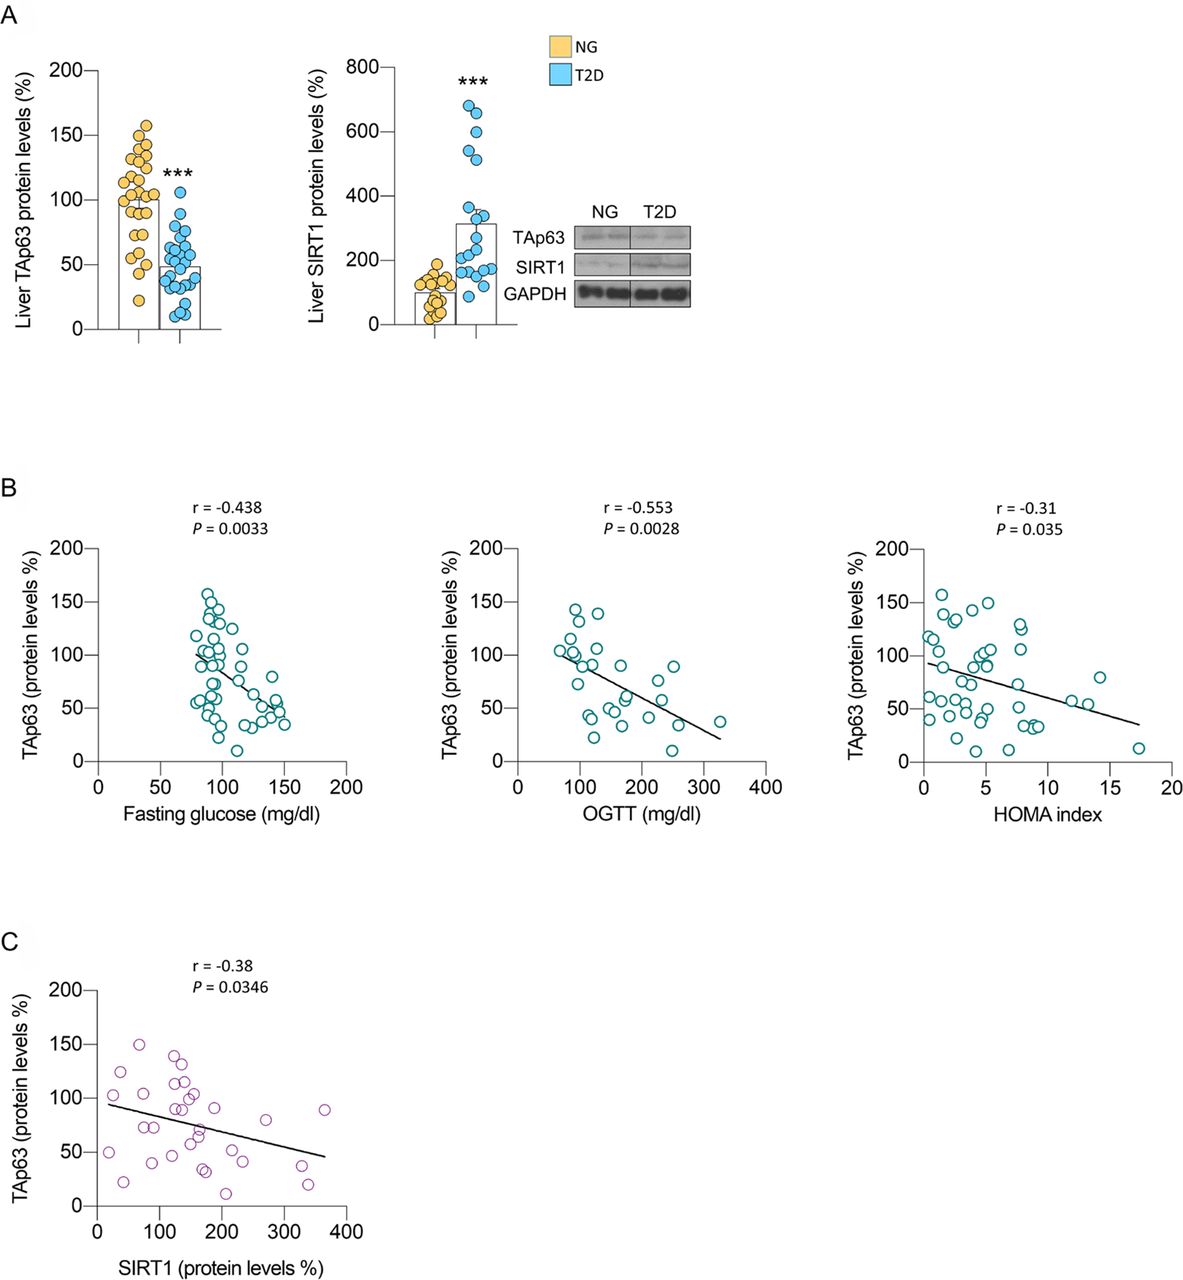
Hepatic TAp63 is associated with human type 2 diabetes. (A) Hepatic TAp63 and SIRT1 protein levels in patients with normoglycaemia (NG) or type 2 diabetes (T2D). (B) Correlations between p63 and fasting glucose, oral glucose tolerance test (OGTT) and homeostasis model assessment (HOMA) index. (C) Correlations between TAp63 protein levels and SIRT1 protein levels. Expression of GAPDH served as loading control, and control values were normalised to 100%. Data are presented as mean±SE mean. ***p<0.001, using a Student’s t-test (A).
To evaluate a possible transcriptional regulation of SIRT1 by TAp63, a luciferase reporter assay in the absence or presence of p63 was carried out using a control plasmid (pTa luc) or a plasmid containing the −202 bp SIRT1 promoter region, pTa-202-Sirt1-luciferase. First, after silencing p63 in AML12 cells, a significant increase in luciferase activity in the SIRT1 promoter was found (figure 3B). In agreement with this, silencing p63 increased SIRT1 expression and activity (figure 3C,D). In contrast, in starved cells transfected with a plasmid overexpressing TAp63, the luciferase activity at the SIRT1 promoter was significantly lower (figure 3E, online supplemental figure S7C), and both SIRT1 mRNA expression and activity were reduced (figure 3F,G). To conclusively prove the binding of the transcription factor p63 to the SIRT1 promoter, we carried out a ChIP assay corroborating the interaction between these two factors (figure 3H). These results indicate that TAp63 directly regulates SIRT1, repressing its expression and activity.
Knockdown of SIRT1 in liver restores glucose levels in mice lacking TAp63
We next investigated whether SIRT1 has a functional relevance as a mediator of the effects of TAp63 on glucose metabolism in vivo. For this, we inhibited SIRT1 in the liver of TAp63LKO mice by injecting a lentivirus shRNA-luciferase (control) or shRNA-SIRT1. As explained above, the deficiency of TAp63 in the liver exacerbated pyruvate-induced hyperglycaemic, as a result of an increased gluconeogenic capacity. However, when SIRT1 was also knocked down, glucose levels during the PTT were identical to the ones observed in control mice; this was not related to variations during a GTT or ITT (figure 4A).
We also carried out a refeeding experiment after an overnight fasting and found that the deletion of SIRT1 normalised glucose levels to those found in control mice (figure 4B). When we measured proteins implicated in glucose synthesis, the augmented levels of SIRT1, PCK1 and G6Pase in TAp63LKO mice were ameliorated after the knockdown of SIRT1 (figure 4C). To note, serum levels of aspartate transaminase (AST) and alanine transaminase (ALT) were not altered (figure 4D) and the knockdown of hepatic SIRT1 was specific since its expression remained unmodified in other organs (figure 4E). These results point to a key role of SIRT1 in mediating the action of TAp63 on glucose metabolism.
We also investigated whether these mice fed a chow diet had alterations in lipid metabolism and/or inflammation. The oil red O staining did not show differences between the three groups of mice (online supplemental figure S8A). Protein levels of enzymes implicated in de novo lipogenesis (FAS, pACC/ACC), lipid oxidation (CPT1) and lipid uptake (LPL) were also assessed, without significant differences detected (online supplemental figure S8B). mRNA expression of genes implicated in inflammation (Tnfα, Il1β, Il6, Tgfβ, F4/80) and lipid transport/cholesterol metabolism (Cyp7a1, Apoc2, Apoa1, Hmgcr) failed to show differences (online supplemental figure S8C,D). Finally, protein levels of total and phosphorylated CREB also remained stable (online supplemental figure S8E).
In summary, our data indicate that the lack of p63 in the liver of mice fed a chow diet for 8–10 weeks does not cause significant alterations in lipid storage, inflammation or cholesterol metabolism.
Overexpression of TAp63 in liver reduces gluconeogenic capacity and increases insulin sensitivity
To test whether TAp63 acts as a repressor of hepatic gluconeogenesis, we next performed a gain-of-function experiment by administering an AAV8 encoding TAp63 in WT mice (figure 5A). Overexpression of TAp63 in liver had no effect on body weight or food intake (figure 5B,C). When mice were challenged with pyruvate, the group with upregulated levels of TAp63 showed lower glucose levels than control mice (figure 5D). Notably, and in contrast to the KO models of TAp63, these mice also showed a higher insulin sensitivity (figure 5D), indicating that TAp63 is important to reduce gluconeogenesis. In fact, when mice were subjected to caloric restriction or fasting—two conditions that favour glucose production—mice expressing ectopic TAp63 in the liver displayed reduced glucose levels and Sirt1 expression, which is characteristically elevated in control WT mice (figure 5E–I). These data demonstrated that the increased levels of TAp63 reduced the gluconeogenic capacity of the liver. To note, these effects were not associated to changes in apoptosis and/or cell proliferation (online supplemental figure S9A), nor in defects in glucagon signalling pathway (online supplemental figure S9B).
To better address how fasting affects p63 and SIRT1 regulation, a fasting time-course experiment in WT mice (6–12–24 hours) was performed. We found that, as expected, blood glucose levels progressively decreased during fasting, while SIRT1 expression increased (online supplemental figure S10A). Hepatic p63 expression was increased throughout fasting (online supplemental figure S10A). In agreement with this, we found significant negative correlations between SIRT1 and TAp63 and between SIRT1 and blood glucose, and a significant positive correlation between blood glucose and TAp63 (online supplemental figure S10B). The fasting-induced expression of SIRT1 was reversed after refeeding or glucose supplementation to nutrient-deprived cells (online supplemental figure S10C,D). Moreover, we also measured SIRT1 levels in different tissues (WAT, BAT, muscle, kidney and intestine) after 24 hours of fasting and a further refeeding. Our data indicated that SIRT1 was upregulated after fasting and returned to baseline levels in BAT but remained unchanged in the other studied organs (online supplemental figure S10E). We also measured SIRT1 in the liver, WAT, BAT, muscle, kidney and intestine of control mice and mice lacking TAp63 in the liver and failed to detect differences (online supplemental figure S10F).
Lack of TAp63 blocks insulin signalling
In addition to insulin-stimulated glucose uptake in adipose tissue and muscle, another critical mechanism for reducing postprandial blood glucose concentrations is the insulin-mediated inhibition of glucose production in liver.21 As we found that TAp63 plays an important role as a suppressor of hepatic gluconeogenesis by regulating SIRT1 activity, we further evaluated the potential implication of TAp63 in the glucose-lowering action of insulin. Mice treated with insulin had increased p63 mRNA expression (figure 6A). Moreover, the low levels of p63 in THLE-2 starved cells increased when cells were treated with insulin (figure 6B), an effect that was completely blocked by the coadministration of a PI3K/AKT inhibitor (figure 6C). Mice treated with insulin showed elevated levels of pAKT in liver independent of hepatic TAp63 knockdown (figure 6D). However, while insulin-treated WT mice showed the expected reduction in SIRT1 protein levels, SIRT1 remained unchanged in mice lacking TAp63 (figure 6D). In agreement with this, pAKT increased in THLE-2 cells incubated with insulin, but a lower expression of Sirt1 was not found when p63 was silenced (figure 6E) and consequently, insulin failed to reduce glucose levels in the medium (figure 6F). Finally, we measured SIRT1 in WT mice overexpressing GFP or TAp63 treated with insulin, and detected that insulin was more efficient in reducing SIRT1 after ectopic overexpression of TAp63 (figure 6G).
Since it is well established that SIRT1 regulates gluconeogenic signals such as Foxo1 and Pgc1α, we also evaluated whether p63 could modulate these factors. First, we measured PGC1a acetylation levels, and found that it was reduced in the liver of mice lacking TAp63—which has increased SIRT1 levels—(online supplemental figure S11A). Finally, we addressed the cellular location of Foxo1 in cells incubated in a medium without nutrients, treated with insulin and cells treated with insulin where p63 was previously silenced. Our findings showed that after the treatment with insulin, Foxo1 was excluded from the nucleus as previously reported.22 However, when p63 was silenced, the effect of insulin on Foxo1 was partially ameliorated (online supplemental figure S11B). Overall, these results indicated that insulin stimulated p63 and that the lack of this transcription factor blunted insulin signalling.
TAp63 is decreased in obese persons and T2D and is inversely correlated with glucose and the HOMA index
Finally, to understand the potential clinical relevance of the preclinical findings, we assessed the levels of TAp63 in liver of obese persons who are normoglycaemia versus obese persons with T2D (see online supplemental table S1 for the clinical characteristics of our cohort). Protein levels of TAp63 were significantly lower in liver of persons with T2D, which is opposite to the increased expression of SIRT1 (figure 7A). Moreover, TAp63 protein levels were negatively correlated with fasting glucose, glycaemia at 2 hours after an OGTT and insulin resistance (as shown by the HOMA index) (figure 7B), glycated haemoglobin A1C (HbA1C) (online supplemental table S2) and SIRT1 expression (figure 7C). Multiple linear regression analyses also revealed that insulin resistance, together with age and body mass index, represented major determinants of hepatic p63 protein levels (online supplemental table S3). Overall, this evidence indicated that the hepatic TAp63 was associated to glucose homeostasis in humans.
Discussion p53 family members are widely recognised for their roles in cancer, mainly as tumour suppressors. Among the mechanisms used for inhibiting tumour progression, these members alter cellular metabolism in proliferating cells.23 However, the interaction of p53 family members with factors such as mTOR, AMPK or AKT, which are involved in a myriad of biological processes, allow them to also play a relevant role in metabolic aspects not related to cancer cells.23 24 Of the family members, p53 is the most extensively studied, and accumulating data indicate that it can act in different organs to modulate several facets of energy and glucose homeostasis. For instance, mice lacking p53 in specific hypothalamic neurons are more prone to diet-induced obesity,25 while the inhibition of p53 in white adipose tissue improves insulin resistance in mice with T2D-like disease.26 In liver, p53 deficiency causes increased hepatic fat content8 27 28 and reduced gluconeogenic capacity.29 30 Our knowledge about the metabolic actions of p63 is surprisingly scarce, given that there is a vast array of genes downstream of p63 that potentially exhibit many different biological effects.
Our findings, herein, showed that p63 is regulated by nutrient availability, and more precisely, by blood glucose levels but not FGF21 or glucagon. Fasting produced a quick reduction in p63 expression in liver, which was rapidly reversed when food is available. Of note, this regulation is exactly the opposite as that identified for p53, which is stabilised in mice on fasting and calorie restriction and returns to baseline levels after refeeding.29 30 These data represent another example of the complex interactions between p53 and p63, which can complement or antagonise each other at the cellular level (reviewed in Allocati et al31).
We also revealed that hepatic TAp63 is involved in the regulation of hepatic glucose production, as mice lacking this isoform in liver showed a higher blood glucose excursion after pyruvate administration, and after fasting and then refeeding; while mice overexpressing TAp63 exhibited changes in insulin sensitivity. These effects were independent of relevant changes in glucose tolerance. However, mice lacking hepatic TAp63 are more insulin sensitive, and the white adipose tissue seems to be responsible for the increased uptake of glucose. These results differ to those reported in mice globally lacking TAp63, which are obese, glucose intolerant, insulin resistant and develop liver steatosis due to their defects in fat utilisation, fatty acid oxidation and glucose utilisation.6 The different animal models used likely explain these distinct outcomes. Using a mouse model lacking TAp63 in all tissues to address issues involving organ crosstalk faces the limitation that does not account for which tissue is responsible for those metabolic alterations. For instance, in contrast to TAp63-deficient mice, mice lacking TAp63 specifically in liver are protected against diet-induced steatosis.8 In addition, the inhibition of TAp63 in POMC in male mice does not affect body weight or adiposity.32 Overall, it seems clear that hepatic TAp63 plays an organ-specific role in the regulation of glucose and lipid metabolism.
We found that the mechanism modulating the effects of TAp63 involved SIRT1, which is an important regulator of hepatic glucose metabolism.16 33 For instance, hepatic SIRT1 is a key modulator of gluconeogenesis in response to fasting,34 35 an effect determined by the complex interactions between multiple factors at different phases of fasting and/or feeding. Our results indicated that p63 directly binds to the SIRT1 promoter and inhibited its activity in hepatocytes, while silencing p63 induced SIRT1 activity. In agreement with this, SIRT1 knockdown only in liver blunts the features of mice lacking hepatic TAp63 related to glucose metabolism, of a reduction of increased excursion of blood glucose after a PTT and a fasting-induced feeding detected in TAp63 liver KO mice. This is different to previous reports in a TAp63 global KO mouse model, which has lower levels of SIRT1 when mice are on a caloric restriction or are fasting.6 That report also shows that in mouse embryonic fibroblasts obtained from TAp63 global KO mice, TAp63 transcriptionally activates SIRT1.6 Once again, the apparent differences between our findings and previous ones are probably interpreted by the different cell types and animal models used, whereby we believe that studying this transcription factor in specific cell types (such as liver, as we did here) and tissue-specific animal models can more precisely unravel its biological role.
Finally, we elucidated the potential clinical value of the current data and found that TAp63 was downregulated in liver of obese persons with T2D as compared with obese persons who are normoglycemic. TAp63 also showed a negative correlation with fasting glucose, glucose levels after an OGTT, the HOMA index, HbA1C and SIRT1 levels. The reduced levels of TAp63 in the liver of patients with T2D, because despite these patients show high levels of glucose and insulin, hepatocytes from these patients are insulin resistant. Since these hepatocytes do not ‘sense’ insulin and therefore do not incorporate glucose, lower levels of p63 are the expected outcome according to our preclinical data. All these clinical outcomes suggest that the interaction between TAp63 and SIRT1 modulates glucose levels in a manner that is important in humans, and that can be related with a pathophysiological situation such as T2D. Of note, the profile and correlations of TAp63 in patients with T2D are distinct from that found for p53, which is stabilised in this patient group.30 This supports the hypothesis that p53 family members can have different actions on glucose metabolism.
In summary, our data indicated that TAp63 in liver was modulated by glucose availability, and that the lack of this transcription factor boosted blood glucose levels in the fasting adaptive response by stimulating SIRT1 activity. In contrast, overexpression of TAp63 increased insulin sensitivity. Notably, these preclinical results were supported by clinical data. It is well known that metabolic flexibility is achieved in many instances by regulating glucose uptake. Our data uncovering a new mechanism provide a novel insight to glucose homeostasis that may be relevant for the physiopathology of diabetes, among other disorders. Altogether, this work identified a new physiological role of TAp63 in glucose metabolism in non-tumoral cells.
Data availability statement
Data are available upon reasonable request.
Ethics statements
Patient consent for publication
Ethics approval
This study involves human participants and was approved by Clínica Universidad de Navarra Ethical Committee (protocol 2017.104). Participants gave informed consent to participate in the study before taking part.
References
Supplementary materials
Supplementary Data
This web only file has been produced by the BMJ Publishing Group from an electronic file supplied by the author(s) and has not been edited for content.
Footnotes
Twitter @ChusaGzlzRellan, @MFdezFondevila, @RubenNogueiras
MJG-R and EN contributed equally.
Correction notice This article has been corrected since it was first published. The open access licence has been updated to CC BY.
Contributors MJG-R, EN, NdSL, AR, CV-D, SS, BP, MFF, UF, MV-R, AS, CI and AE: study conception and design, data acquisition, and data analysis and interpretation. MJG-R, EN, MF, DG, RP-F, VP, MS, ML, CD, RC and RN: manuscript writing and final review. RN acts as a guarantor.
Funding This work has been supported by grants from FEDER/Ministerio de Ciencia, Innovación y Universidades-Agencia Estatal de Investigación (CD: BFU2017-87721; ML: RTI2018-101840-B-I00; RN: RTI2018-099413-B-I00 and RED2018-102379-T), Xunta de Galicia (ML: 2016-PG068; RN: 2021-CP085 and 2020-PG015), Fundación BBVA (RN: BBM_BAS_0062), Fundación Atresmedia (ML and RN: 2018-PO055), Fundación Jesús Serra (RN: 2021-003), European Foundation for the Study of Diabetes (RN: 2018-PO069) and FIS-FEDER (GF: PI19/00785; AR: PI19/00990). This research also received funding from the European Community’s H2020 Framework Programme (ERC Synergy Grant-2019-WATCH-810331, to RN, VP and MS). Centro de Investigación Biomédica en Red (CIBER) de Fisiopatología de la Obesidad y Nutrición (CIBERobn), CIBER de Enfermedades Hepáticas y Digestivas (CIBERehd). CIBERobn and CIBERehd are initiatives of the Instituto de Salud Carlos III (ISCIII) of Spain which is supported by FEDER funds.
Competing interests None declared.
Patient and public involvement Patients and/or the public were not involved in the design, or conduct, or reporting, or dissemination plans of this research.
Provenance and peer review Not commissioned; externally peer reviewed.
Supplemental material This content has been supplied by the author(s). It has not been vetted by BMJ Publishing Group Limited (BMJ) and may not have been peer-reviewed. Any opinions or recommendations discussed are solely those of the author(s) and are not endorsed by BMJ. BMJ disclaims all liability and responsibility arising from any reliance placed on the content. Where the content includes any translated material, BMJ does not warrant the accuracy and reliability of the translations (including but not limited to local regulations, clinical guidelines, terminology, drug names and drug dosages), and is not responsible for any error and/or omissions arising from translation and adaptation or otherwise.