Article Text

Abstract
Objective Gastric adenocarcinoma (gastric cancer, GC) is a major cause of global cancer mortality. Identifying molecular programmes contributing to GC patient survival may improve our understanding of GC pathogenesis, highlight new prognostic factors and reveal novel therapeutic targets. The authors aimed to produce a comprehensive inventory of gene expression programmes expressed in primary GCs, and to identify those expression programmes significantly associated with patient survival.
Design Using a network-modelling approach, the authors performed a large-scale meta-analysis of GC transcriptome data integrating 940 gastric transcriptomes from multiple independent patient cohorts. The authors analysed a training set of 428 GCs and 163 non-malignant gastric samples, and a validation set of 288 GCs and 61 non-malignant gastric samples.
Results The authors identified 178 gene expression programmes (‘modules’) expressed in primary GCs, which were associated with distinct biological processes, chromosomal location patterns, cis-regulatory motifs and clinicopathological parameters. Expression of a transforming growth factor β (TGF-β) signalling associated ‘super-module’ of stroma-related genes consistently predicted patient survival in multiple GC validation cohorts. The proportion of intra-tumoural stroma, quantified by morphometry in tissue sections from gastrectomy specimens, was also significantly associated with stromal super-module expression and GC patient survival.
Conclusion Stromal gene expression predicts GC patient survival in multiple independent cohorts, and may be closely related to the intra-tumoural stroma proportion, a specific morphological GC phenotype. These findings suggest that therapeutic approaches targeting the GC stroma may merit evaluation.
- Gastric cancer
- gene expression
- prognostic factors
- oesophageal cancer
- molecular pathology
- carcinogenesis
- gastric adenocarcinoma
- colorectal cancer
- image analysis
- Helicobacter pylori–gastritis
- Barrett's metaplasia
- Barrett's carcinoma
- colorectal cancer screening
- gastric pre-cancer
- liver
- hepatoma
Statistics from Altmetric.com
- Gastric cancer
- gene expression
- prognostic factors
- oesophageal cancer
- molecular pathology
- carcinogenesis
- gastric adenocarcinoma
- colorectal cancer
- image analysis
- Helicobacter pylori–gastritis
- Barrett's metaplasia
- Barrett's carcinoma
- colorectal cancer screening
- gastric pre-cancer
- liver
- hepatoma
Significance of this study
What is already known on this subject?
-
Gene expression profiles of primary cancers can provide ‘snapshots’ of biological pathways expressed by cancer cells and other cell populations in solid tumours.
-
Identifying gene expression programmes associated with patient survival may refine our ability to predict clinical prognosis, discover specific molecular processes regulating disease progression and highlight novel avenues for therapeutic intervention.
What are the new findings?
-
▸ This study reports the largest analysis of gastric cancer transcriptomes to date, providing a comprehensive inventory of expression programmes (‘modules’) present in gastric cancer.
-
▸ Of the 178 modules expressed in primary gastric cancers, expression of a transforming growth factor β (TGF-β) associated module of stroma-related genes consistently predicted patient survival in multiple datasets.
-
▸ Histopathological analysis of primary gastric cancers revealed that stromal module expression was associated with the proportion of intra-tumoural stroma (ITS).
-
▸ Direct histopathological measurement of the ITS proportion was predictive of gastric cancer patient survival.
How might it impact on clinical practice in the foreseeable future?
-
▸ Quantifying the proportion of ITS in gastric cancers during routine histopathological assessment may serve as a surrogate marker for stromal gene expression levels in individual tumours.
-
▸ Therapies targeting pathways associated with the tumour stroma, such as TGF-β signalling, merit consideration in gastric cancer.
Introduction
Gastric adenocarcinoma (gastric cancer, GC) is a major cause of global cancer mortality.1 ,2 Treatment of GC patients is currently based on clinical parameters such as age, performance status and tumour, node, metastasis (TNM) staging,3 which are collectively used to decide whether a patient should be treated by surgery alone, surgery plus chemotherapy/chemoradiation or chemotherapy alone. Of these, TNM staging is the major tool used by clinicians to predict GC patient prognosis. However, GC patients with the same TNM stage often exhibit distinct clinical outcomes4 suggesting the existence of additional factors influencing GC disease aggressiveness. Previous studies attempting to identify additional GC prognostic factors have investigated a variety of clinical, histological (morphological subtypes, grade of differentiation) and molecular factors, including Ki67 expression (a marker of cell proliferation), p53 mutation status, DNA ploidy and human epidermal growth factor receptor 2 (HER2) expression.5–9 However, clear prognostic roles have not been consistently observed for most of these factors, particularly when tested in multiple independent patient cohorts. So far, prognostic studies in GC have focused primarily on aberrations occurring in the GC cell. However, like all solid tumours, GCs are highly complex entities composed of neoplastic epithelial cells, as well as of vessels, fibroblasts, immune cells and extracellular matrix. Compared with cancer cells, relatively little is known regarding the potential contribution of these other components to GC patient prognosis.10–13
Gene expression profiling represents a powerful technology that can provide an unbiased and holistic ‘molecular snapshot’ of distinct gene expression programmes present within a tumour.14 While some of the genes comprising these expression programmes are expressed exclusively by cancer cells, other cell types within a tumour may also contribute to the gene expression profile. Here, we hypothesised that a detailed analysis of a large number of GC transcriptomes would provide a comprehensive inventory of distinct expression programmes associated with GC, which can then be tested for associations with patient prognosis. Analysing gene expression data from 940 GCs and non-malignant gastric tissues from different patient populations, we found that the expression of a ‘stromal module’ comprising stroma-related genes was associated with both, transforming growth factor β (TGF-β) signalling and patient survival in multiple GC cohorts. In GC tissue sections, we further found that the proportion of the stroma within GCs (intra-tumoural stroma, ITS) also predicted patient survival. To our knowledge, this is the first study demonstrating a prognostic role for both, stromal gene expression and the ITS proportion in GC patients. Our results highlight the potential role of the ITS proportion as a predictive biomarker to identify subgroups of patients with GCs that might respond to tumour stroma-directed therapies. Moreover, because our molecular analysis indicates that the GC stromal module is associated with TGF-β signalling, molecular therapies targeting the TGF-β pathway may merit evaluation in GC patients.
Methods
Gastric cancer datasets
Discovery datasets
The GC coexpression network was generated using nine independent GC expression microarray datasets (supplemental table 1), comprising 591 gastric samples (428 GCs and 163 non-malignant samples (normal gastric mucosa, chronic gastritis, atrophic gastritis with intestinal metaplasia)). One hundred and nine of the 163 non-malignant gastric samples were matched to GC samples, while the remaining 54 non-malignant samples were gastric biopsies from individuals with Helicobacter pylori gastritis without cancer, recruited into a randomised, placebo-controlled trial of H pylori therapy.15 The datasets were obtained from the National Center for Biotechnology Information (NCBI) Gene Expression Omnibus (http://www.ncbi.nlm.nih.gov/geo/), or from collaborators (SG-2, LS-1 and AMS). Several of these datasets have been previously published.15–20 Detailed clinical information from the discovery datasets was not used in this study, with the exception of the AMS cohort (34 GCs) which was analysed to provide additional power for the survival analysis.
Validation datasets (transcriptome)
Three GC datasets (SG-3, AU-2 and YGC) were used for validation analyses comprising 288 GC and 61 non-malignant gastric samples. These samples were not used in the discovery phase. All 61 non-malignant validation samples were matched with a GC. Seven patients received neo-adjuvant therapy (one patient, SG-3 cohort; six patients, AU-2 cohort). Clinical characteristics are presented in table 1. Primary GCs were collected with patient consent from the participating centre's tissue repositories or pathology archives and approval from the respective institutional research ethics review committees in accordance with local regulations and legislations. Clinical information was collected with the approval of the Institutional Review Board. Gene expression data of these validation datasets have been deposited under Gene Expression Omnibus accession numbers GSE15459 (SG-3), GSE35809 (AU-2) and GSE13861 (YGC).21
Clinical characteristics of validation datasets
Validation dataset (tissue microarray (TMA))
An additional GC TMA dataset (LS-2) was also analysed. TMAs were constructed from an independent set of 163 GC patients who underwent curative D2 resection at the Academic Department of Surgery, Leeds General Infirmary, Leeds, UK, between 1970 and 1991. After excluding technical failures and data from patients who died within 30 days after surgery (postoperative mortality), results from 131 patients were available for analyses. Median follow-up time after surgery was 5.5 years ranging from 0.11 years to 20.6 years. Forty-nine (37.4%) patients had died due to cancer at the end of the study period. Clinical characteristics of the LS-2 TMA dataset are presented in the online supplemental table 2.
The supplemental methods provide details of GC network construction, functional annotation of network modules, mapping of modules and oncogenic pathways to individual samples, clinicopathological and survival analyses, and quantitation of ITS by computerised point counting.
Results
Network analysis identifies multiple conserved gene expression modules in GC
We established a discovery series of 591 gastric tissue samples (428 cancers and 163 matched non-neoplastic samples), drawn from nine independent GC transcriptome datasets representing a wide variety of GC patient populations from different countries, including countries with low and high GC incidence (online supplemental table 1). We used these discovery datasets to construct a GC gene coexpression network. First, we established a core network of genes commonly present in all nine datasets comprising genes exhibiting consistent and robust expression correlations in both, GCs and non-malignant gastric samples (see Methods, figure 1A). Second, to increase the number of genes in the network, we expanded the network construction to all possible combinations of eight, seven and six datasets. This network construction method yielded a final GC coexpression network comprising 3177 genes linked by 14 965 interactions (false discovery rate (FDR) <0.001, supplemental table 3, figure 1A).
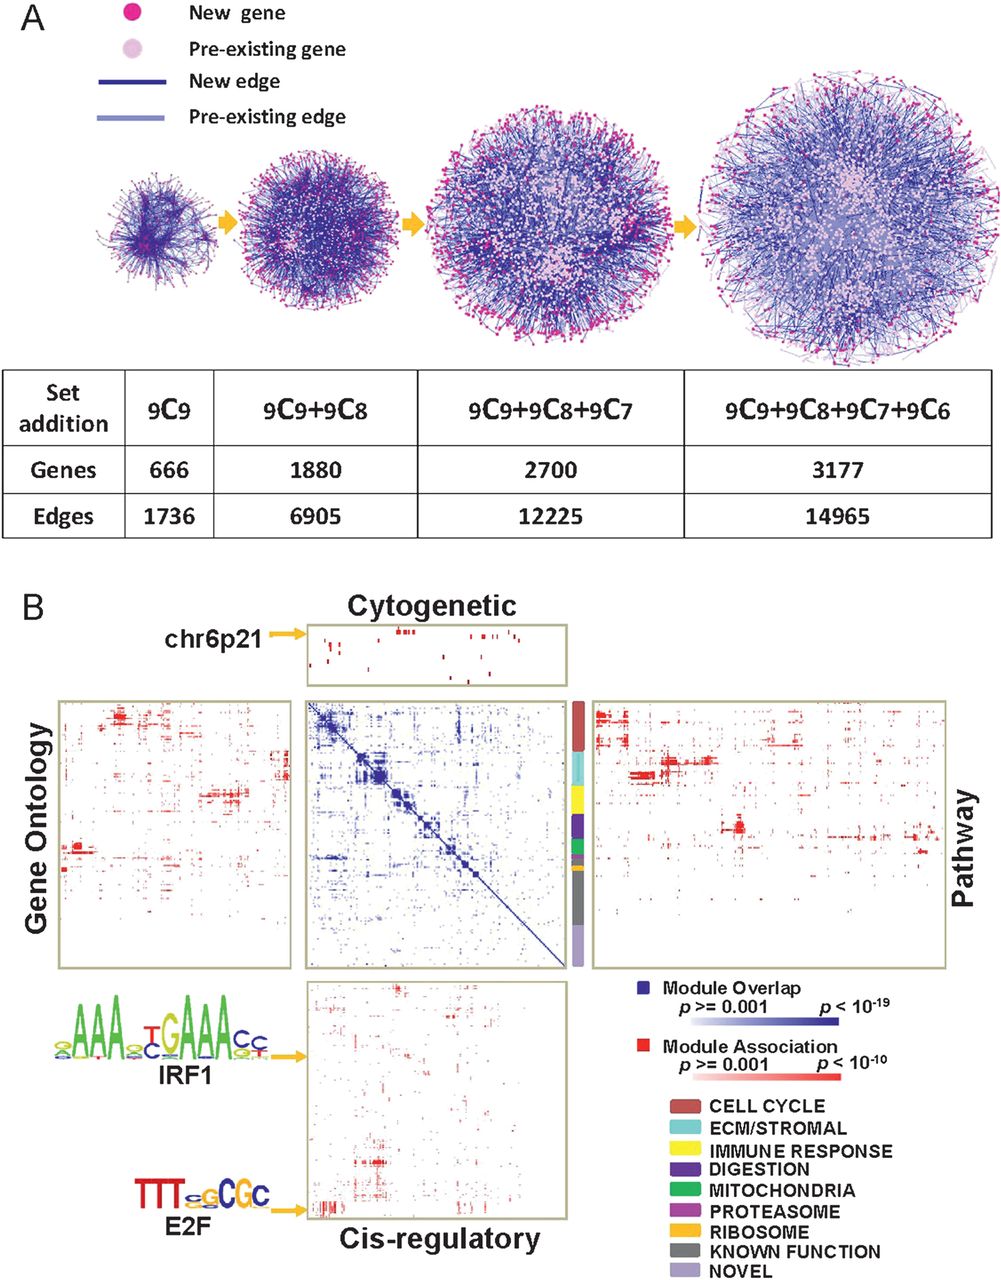
Gastric cancer (GC) coexpression network construction and annotation. (A) Network construction. (left to right) Core network exhibiting conserved coexpression correlations across 9 GC datasets (9C9). Genes are nodes (pink) and edges are coexpression correlations (blue). The core network was expanded by adding nodes and edges across all possible combinations of 8, 7 and 6 GC datasets (9C8, 9C7, 9C6). Light pink nodes represent pre-existing nodes already present in the prior network, while dark pink nodes represent new genes. Light blue lines represent pre-existing edges from the prior network, while dark blue lines represent new edges. All genes and edges are associated with a false discovery rate <0.001. (B) Functional annotations of modules. (blue-white heat map) Gene composition overlap between the 178 modules. Darker blue regions represent modules with significant gene overlap. The white-blue scale bar indicates p values for the module overlap (hypergeometric test). (Surrounding four red matrices) Module mapping against the Molecular Signatures Database (MSigDB); cytogenetic location (top), pathway signatures (right), cis-regulatory binding sites (bottom) and gene ontologies (left). Darker red areas represent significant module associations (minimum overlap number of genes = 5). The white-red scale bar indicates the p values for the module association. The multicoloured vertical colour bar to the right of the white-blue heat map represents groups of modules exhibiting significant overlap in gene content (super-modules, see colour code at bottom right). Arrows indicate representative cis-regulatory motifs (E2F, IRF1) and chromosomal bands (6p21). E2F- and IRF1-binding motifs are shown using standard position-weight matrix terminology.
To partition the network into meaningful and biologically relevant subunits, we then defined ‘modules’ within the coexpression network, defined as groups of genes showing a high degree of internal coexpression relative to genes external to the group. Using a previously described module construction algorithm,22 we identified 178 coexpression modules in the network comprising 10–200 genes each (supplemental figure 1, supplemental document 1; supplemental table 4 presents a representative module). Supporting the biological relevance of the GC network, network topology analyses at multiple levels, for example, between (1) all individual genes in the entire coexpression network, (2) all modules and (3) genes within a particular module revealed that the identified networks all exhibited a ‘scale-free’ structure with most genes acting as ‘edges', and certain genes acting as ‘hubs' (supplemental figure 2 and supplemental table 5; also see Discussion). These findings are consistent with previous studies establishing that biological networks are often scale-free.23
Since coexpressed genes typically act within the same pathway or share related biological functions,24 we proceeded to systematically annotate the 178 modules in the coexpression network by comparing their gene content against the Molecular Signatures Database (MSigDB), a publicly accessible database of gene sets annotated by chromosomal position, pathway components, gene ontologies and cis-regulatory binding sites (figure 1B). A total of 148 (83%) of 178 modules were successfully mapped to at least one MSigDB dataset at the threshold level of significance (p<0.001, minimum overlap >5 genes), while 30 modules lacked MSigDB assignments and may be novel. Several modules shared similar MSigDB annotations raising the possibility that these modules might participate in common biological programmes. We called these higher order associations ‘super-modules’, and identified seven distinct super-modules in the coexpression network. One super-module comprised 32 modules related to various aspects of cell cycle and proliferation.25 A second super-module, designated the ‘stromal super-module', contained 23 modules associated with extracellular matrix biology and stromal cells. The remaining super-modules in the coexpression network were associated with immune response, digestive function, mitochondrial, ribosomal and proteasomal function (see colour legend in figure 1B). Supplemental document 1 provides all the member genes of the 178 modules, and supplemental document 2 provides a comprehensive table of the 178 modules and their MSigDB assignments.
Determining levels of module expression in individual validation samples
To compare the expression levels of different modules between individual GCs, we used a previously published algorithm (GENOMICA, see Methods and Segal et al, 200426) to map the 178 expression modules onto three independent GC datasets not used in the network construction described above (Singapore dataset: SG-3, 153 GCs and 38 matched non-malignant gastric samples; Australia dataset: AU-2, 70 GCs and 9 non-malignant samples; South Korea dataset: YGC, 65 GCs and 14 matched non-malignant samples). Table 1 provides the clinicopathological characteristics of these datasets. To maximise statistical power, we combined all samples from these datasets (SG-3, AU-2 and YGC) resulting in a combined validation series of 349 samples (288 GCs and 61 non-malignant gastric samples).
Mapping of the expression modules to this combined validation series confirmed that the modules were differentially expressed across individual GCs (figure 2A). We noted interesting relationships between modules. For example, GCs with high expression of cell proliferation modules tended to coexpress modules related to digestive function, while GCs with high expression of the stromal module exhibited low expression of cell proliferation modules and low expression of modules related to digestive function. A subset of GCs showed high expression of modules related to proteosomal function (see Discussion).
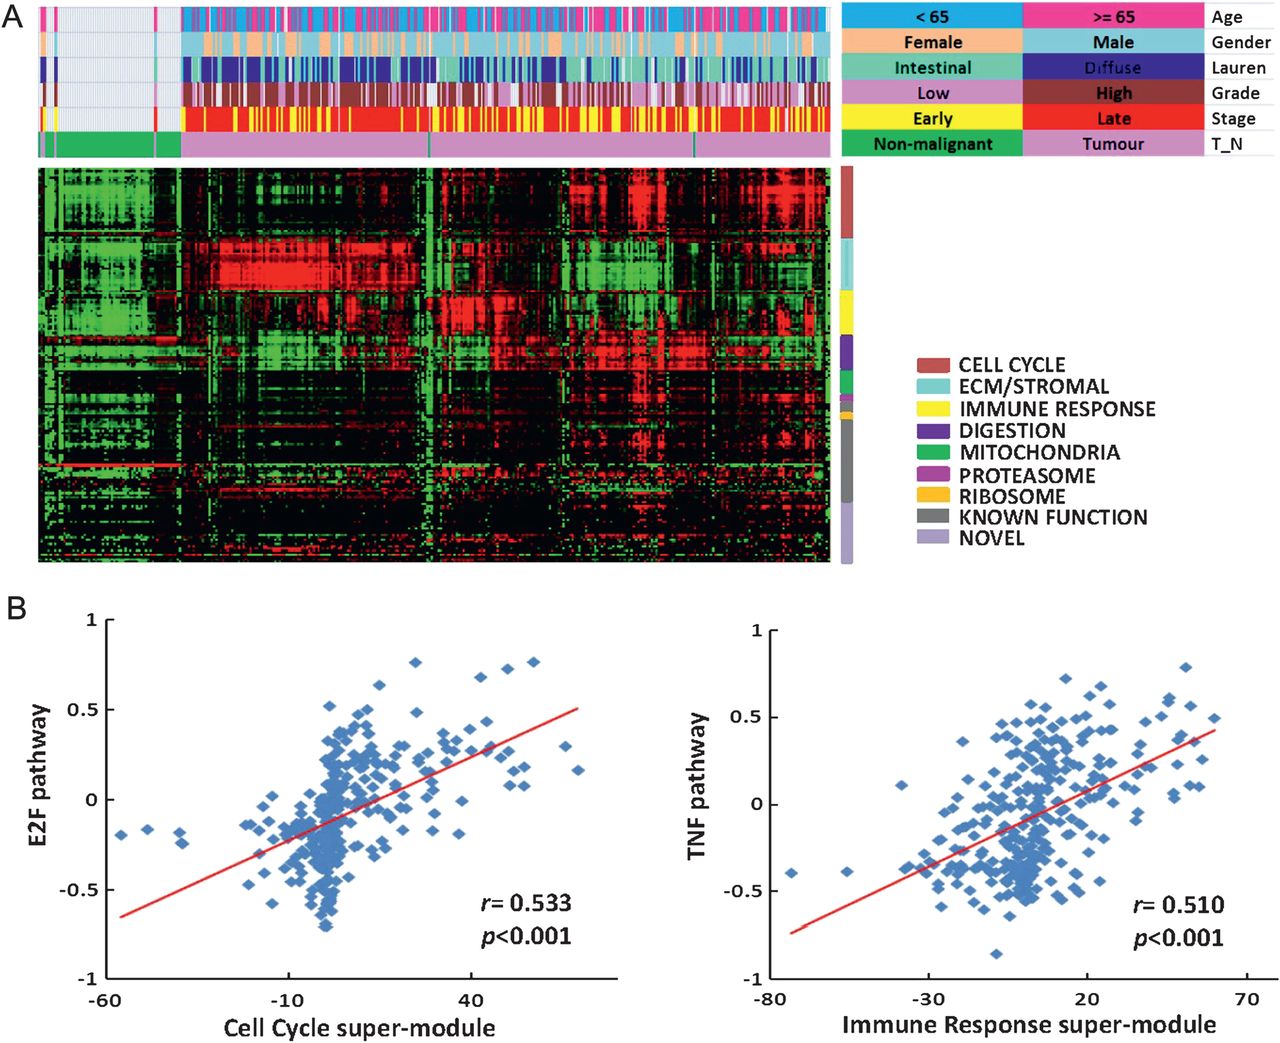
Patterns of module expression are associated with distinct clinicopathological characteristics and oncogenic pathways. (A) The lower red-green heat map represents different patterns of module expression in the combined validation series SG-3/AU-2/YGC dataset (349 samples) ordered by hierarchical clustering. Red represents modules that are highly expressed, while green represents modules expressed at low levels. Coloured bars above the heat map represent clinicopathological characteristics (age, gender, Laurén classification, grade of differentiation, TNM stage, gastric cancer or non-malignant gastric tissue) (colour legend on top right). (B) Oncogenic pathways associated with modules and super-modules. Data originates from the 288 gastric cancers in the 349 combined validation series: SG-3 (n=153), AU-2 (n=70) and YGC (n=65). (Left) E2F pathway activation was significantly correlated with cell-cycle super-module expression (correlation coefficient r=0.533, p<0.001). The y axis represents levels of E2F pathway activation, while the x axis represents levels of cell-cycle super-module expression. Each data point represents an independent validation sample. (Right) Tumour necrosis factor (TNF) pathway activation correlated with immune response super-module expression (correlation coefficient r=0.510, p<0.001). The y axis represents levels of TNF pathway activation, while the x axis represents levels of immune response super-module expression.
GC expression modules are associated with distinct clinicopathological characteristics
We used the combined validation series to explore if expression of any of these modules might be related to clinicopathological characteristics including age, gender, disease stage, histopathological subtype and grade of differentiation (figure 2A and supplemental table 6). The results from the combined validation series are presented in the paragraphs below and in supplemental table 6, while the results from analyses of the individual datasets can be found in supplemental figure 3 and supplemental table 7. For these and all subsequent analyses, p values were corrected for multiple hypotheses testing, and a corrected p value <0.05 was considered significant.
Age at diagnosis
GCs from patients younger than 65 years of age exhibited higher stromal and immune response super-module expression (stromal: p<1.00×10−323; immune response: p=6.69×10⁻³), while GCs from patients older than 65 years of age exhibited higher cell cycle (p=1.47×10⁻⁷), mitochondrial (p=4.99×10⁻³) and ribosomal (p=0.028) super-module expression.
Gender
GCs from male patients were associated with higher cell cycle (p<1.00×10−323) and proteasomal (p=9.1×10⁻⁴) super-module expression, while GCs from female patients were associated with higher stromal super-module expression (p<1.00×10−323).
Disease stage (UICC (Union for International Cancer Control)/AJCC (American Joint Committee on Cancer) 6th edition)
Early-stage (stages I and II) GCs were associated with higher cell cycle (p=4.32×10⁻⁹), mitochondrial (p=7.68×10⁻⁹), ribosomal (p=5.87×10⁻³) and proteasomal (p=0.035) super-module expression, while late-stage (stages III and IV) GCs were associated with higher stromal super-module expression (p<1.00 ×10−323).
Histopathological subtype
Intestinal-type GCs exhibited higher cell cycle (p<1.00 ×10−323), proteasomal (p=4.95×10⁻¹⁴), digestive function (p=6.97×10⁻¹³), mitochondrial (p=3.0×10⁻³) and immune response super-module expression (p=3.45×10⁻³), while diffuse-type GCs were associated with higher stoma super-module expression (p<1.00×10−323).
Grade of differentiation
Well and moderately differentiated, low-grade GCs exhibited higher cell cycle (p<1.00×10−323), digestive function (p<1.00×10−323), mitochondrial (p=2.93×0−9) and proteasomal (p=5.49×10⁻⁷) super-module expression, while poorly differentiated and undifferentiated, high-grade GCs were associated with higher stromal (p<1.00×10−323) and immune response (p=1.08×10⁻⁵) super-module expression. We also considered the current WHO guideline that differentiation should only be graded in intestinal-type GCs.27 When our analysis was restricted to intestinal-type GCs, low-grade GCs exhibited higher digestive function (p=5.10×10⁻⁷) and mitochondrial (p=0.002) super-module expression, while high-grade GCs were associated with higher immune response (p=1.20×10⁻¹⁵) and stromal (p=0.027) super-module expression.
Supporting the robustness of the above associations, similar trends were also observed for the vast majority of these relationships (61 of 69) when the three independent validation datasets (SG-3, AU-2 and YGC) were analysed individually. Only eight relationships showed an opposite trend in the individual sets compared with the combined 349-sample set, and of these eight, only one was significant (Laurén classification and cell-cycle module expression in YGC cohort, p value<0.05, supplemental table 7).
GC expression modules are associated with distinct oncogenic pathways
Besides investigating the association with clinicopathological characteristics, we also sought to link the expression of the 178 modules to molecular signalling pathways known to be activated or deregulated in malignant tumours. Using a previously described pathway mapping approach, we mapped specific gene expression signatures (‘pathway signatures’) representing 21 oncogenic and tumour suppressor pathways previously implicated in gastric carcinogenesis (p53, EGFR, TGF-β, STAT3, VEGF, CEBP, AKT, BRCA1, HER2, SRC, E2F, TNF, MYC, WNT, NF-kB, PI3K, PPARG, p63, RAS, CD31 and HSP9028–30) onto the combined validation series. We then identified specific GC modules whose expression was significantly correlated to the expression of the pathway signatures (online supplemental tables 8 and 9).
E2F is a transcriptional regulator of cell-cycle genes.31 We found that GCs expressing high levels of E2F pathway activation also expressed 32 distinct cell-cycle-related modules (r=0.533, p<0.001; figure 2B, left panel). Supporting E2F as a transcriptional regulator of these modules, a promoter analysis of genes in these cell-cycle-related modules revealed that they were significantly enriched in E2F binding motifs (p=2.41×10⁻⁷; figure 3A).

Oncogenic pathways and module expression. (A) Transcription factor-binding motifs in super-modules. Network diagrams depict the cell cycle and immune super-modules. Blue and red points represent distinct modules within the larger super-module. E2F consensus binding sites were significantly enriched in genes of the cell cycle super-module (p=2.41×10⁻⁷), while IRF1 consensus binding sites were significantly enriched in genes of the immune super-module (p=2.72×10⁻⁵). Position-weight matrix depictions of E2F1- and IRF1-binding motifs are shown. (B) Correlation of TGF-β pathway with stromal super-module expression in the 288 GCs (correlation coefficient r=0.708, p<1.0×10−323). The y axis represents levels of TGF-β pathway activation, while the x axis represents levels of stromal super-module expression. Each point depicts an independent sample. (C) Enrichment of serum response factor transcription factor-binding motifs in the stromal super-module (p=2.31×10⁻¹⁶). Green, pink and red points in the network diagram represent distinct modules within the super-module.
GCs exhibiting high levels of Tumour Necrosis Factor (TNF) and Nuclear Factor Kappa-light-chain-enhancer of activated B cells (NF-kB) pathway activation also expressed multiple modules related to immune function (r=0.510, p<0.001; figure 2B, right panel). A promoter analysis of genes from the immune modules revealed that they were characterised by an enrichment of NF-kB target genes (p=1.51×10⁻⁶, hypergeometric test) and genes with interferon regulatory factor 1 (IRF1)-binding motifs (p=2.72×10⁻⁵; figure 3A). IRF1 has been described as a major downstream target of both TNF and NF-kB signalling.32
Expression of the stromal super-module was associated with elevated levels of TGF-β pathway activation in both, the combined validation series and the individual datasets (r=0.708, p<1.0×10−323; figure 3B and online supplemental figure 4). Moreover, expression of the TGF-β ligands TGF-β3 and TGF-β1, and also the TGF-β receptors TGF-βR1, TGF-βR2 and TGF-βR3 was consistently higher in GCs with high stromal super-module expression (all p values <0.001; online supplemental table 10). A promoter analysis of genes in the stromal super-module revealed that they were significantly enriched in genes with serum response factor-binding motifs (p=2.31×10⁻¹⁶; figure 3C), a transcription factor known to be activated by TGF-β signalling.33–35 These results suggest that TGF-β signalling may regulate the expression of the stromal super-module in GC.
Similar to the clinicopathological characteristics, associations between the expression modules and oncogenic pathways observed in the combined validation series were largely preserved when the three independent validation datasets (SG-3, AU-2 and YGC) were analysed individually (online supplemental table 9).
Expression of the stromal super-module in GCs predicts overall survival
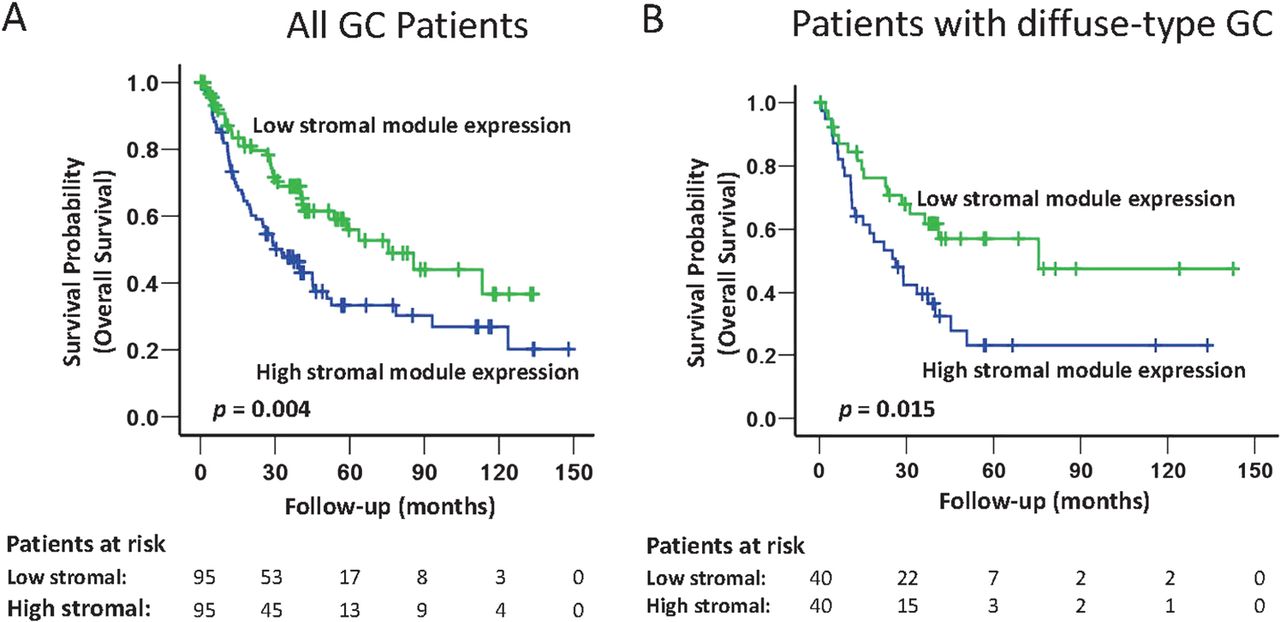
Surveying the different expression modules, we identified a significant relationship between the expression level of the stromal super-module in GC and patient survival. Specifically, in the combined validation dataset, univariate Cox regression analysis treating stromal super-module expression as a continuous variable in the model revealed that GCs with a high level of stromal super-module expression were associated with significantly poorer overall survival (p=0.025; HR 1.007, 95% CI 1.001 to 1.013; table 2). Similar results were observed in a Kaplan–Meier survival analysis, comparing the 1/3 of patients with high stromal super-module expression with the 1/3 of patients with low stromal super-module expression (p=0.004, log-rank test; figure 4). Adverse survival trends of patients with GCs exhibiting high stromal super-module expression were also observed when the individual datasets were analysed (p=0.043 (SG-3); p=0.045 (YGC); p=0.23 (AU-2); online supplemental figure 5). Further supporting the association between patient survival and stromal super-module expression, a significant relationship with patient survival was also observed in a fourth dataset (AMS, n=34; comparing top vs bottom tertiles), which was used in the initial construction of the coexpression data, and for which clinical outcome data was available (p=0.018; online supplemental figure 5).
Univariate and multivariate Cox regression analysis for stromal super-module expression and clinicopathological characteristics in the combined validation series

Stromal super-module expression predicts patient survival in the cancers from the combined validation dataset, and in patients with diffuse-type gastric cancer (GC). (A) Expression of the stromal super-module predicts all GC patient survivals in the combined validation dataset. All GC patients were divided into three equally sized groups based on the level of stromal super-module expression: high stroma (top 1/3), moderate stroma (middle 1/3), and low stroma (bottom 1/3). Kaplan–Meier analysis was used to compare overall survival probability from the time of surgery of patients with either high stroma (top 1/3) or low stroma (bottom 1/3) GC. GC patients with high levels of stromal super-module expression had a poorer prognosis (p=0.004, log-rank test). (B) Stromal super-module expression levels predict patient survival in patients with diffuse-type GC. One hundred and eighteen patients with diffuse-type GC (combined SG-3/AU-2/YGC data) were divided into three equally sized groups based on levels of stromal super-module expression: high stroma (top 1/3), moderate stroma (middle 1/3), and low stroma (bottom 1/3). Kaplan–Meier survival analysis demonstrates that patients with diffuse-type GC and high levels of stromal super-module expression (top 1/3, n=40) had poorer survival than patients with diffuse-type GC and low levels of stromal super-module expression (bottom 1/3, n=40) (p=0.015, log-rank test).
To compare the prognostic significance of stromal super-module expression with current gold standard clinicopathological criteria of patient prognosis prediction, we performed multivariate Cox regression analysis incorporating stromal super-module expression (continuous variable), age (<65 years vs ≥65 years), gender, resection margin status (R0 vs R1), morphology (intestinal-type vs diffuse-type vs mixed type, grade of differentiation (well vs moderate vs poor) and pathological tumour stage according to TNM classification (UICC/AJCC 6th edition). In the combined validation series, the prognostic value of stromal super-module expression was related to disease stage (p=0.12, HR: 1.005, 95% CI 0.999 to 1.012; table 2). A stage-adjusted analysis revealed that the association between stromal super-module expression and survival was primarily observed in stages III and IV (ie, late stage) disease (p=0.024 for stages III and IV compared with p=0.668 for stages I and II; online supplemental table 11). Kaplan–Meier survival analysis restricted to stage III GC patients showed that patients with GCs expressing high levels of stromal super-module expression had a poorer prognosis compared with patients with low stromal super-module expression (p=0.039; online supplemental figure 6).
Besides survival, high expression of the stromal super-module was significantly associated with diffuse-type morphology (p<1.00×10−323; online supplemental table 6), a histological subtype traditionally associated with clinically poor prognosis.36 ,37 In a subgroup analysis of diffuse-type GCs in the combined validation set, we found that patients with diffuse-type and high stromal super-module expressing GCs exhibited a significantly poorer survival compared with patients with diffuse-type and low stromal super-module expressing GCs (p=0.015; figure 4B). This result suggests that additional information beyond histological classification may be revealed by measuring stromal super-module expression, supporting recent reports describing distinct subtypes of diffuse-type GC.38
To validate our results using a non-array technology, we performed immunohistochemistry on GC full sections for two proteins, vimentin (VIM) and caldesmon (CALDESM), whose mRNA expression was highly correlated with stromal super-module expression (see Methods for selection criteria). In the LS-1 dataset, VIM protein expression exhibited a trend towards association with stromal super-module expression (r=0.34, p=0.08). Similarly, CALDESM protein expression tended to be positively associated with stromal super-module expression (r=0.22, p=0.26; online supplemental figure 7). We think it not surprising that there is only a trend and no significant correlation between the IHC results and the stromal super-module expression, as the former is based on measurements of a single biomarker (eg, VIM or CALDESM protein), while the latter is based upon the coordinated expression levels of 878 genes, which is likely to be more robust.
Stromal super-module expression is related to the intratumoural stroma proportion
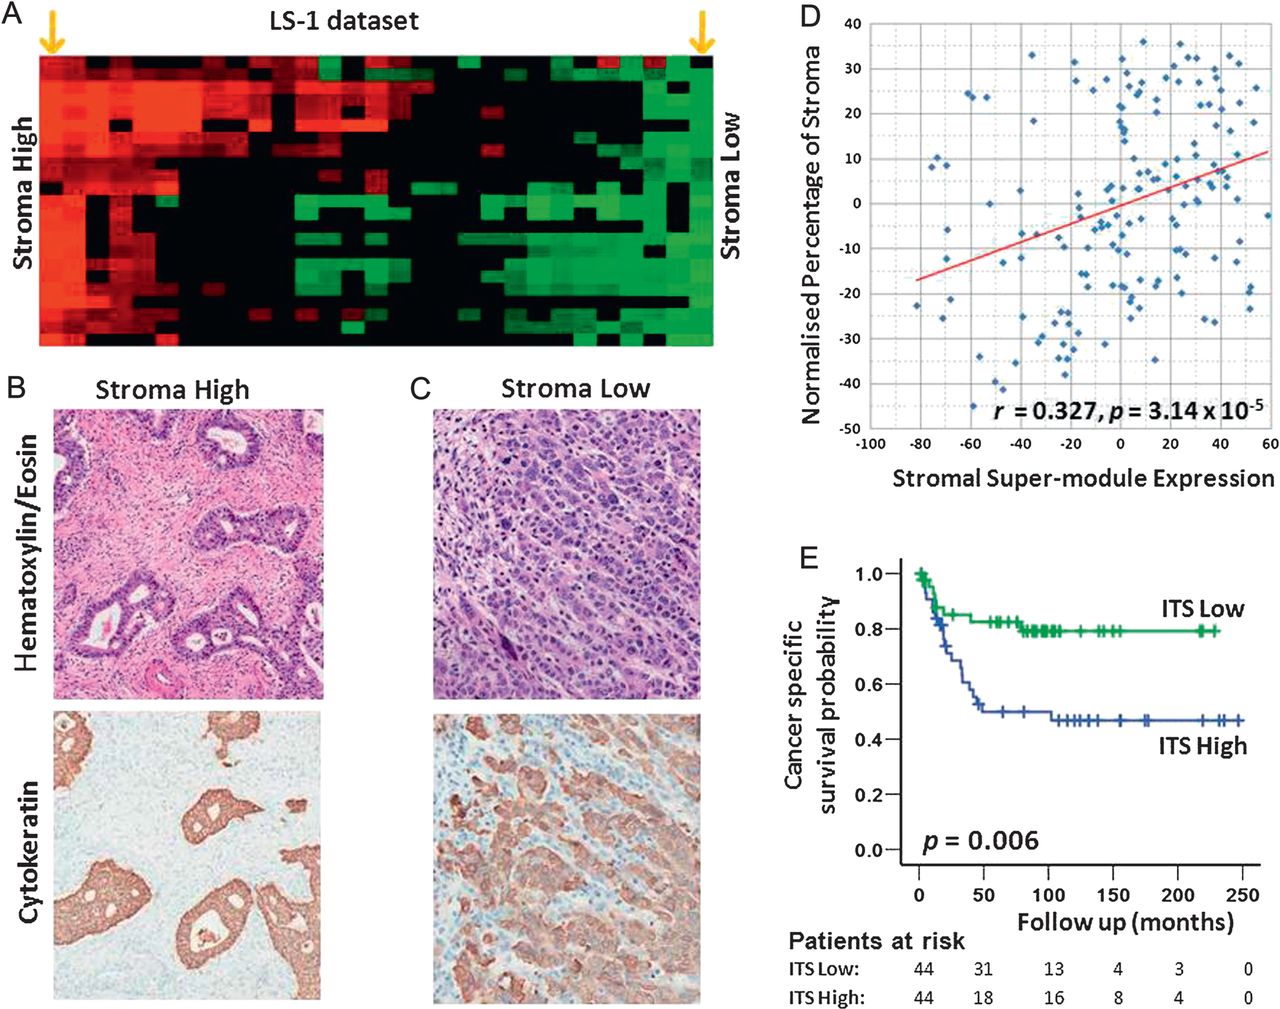
We hypothesised that GC stromal super-module expression levels might be correlated with specific histopathological features observable in routine haematoxylin & eosin (H&E)-stained sections of GCs. To explore this possibility, we analysed two GC datasets, representing cases for which we were able to obtain full H&E sections of sufficient quality for histological analysis, and corresponding gene expression data. These included (1) 156 GCs comprising 119 SG-3 GCs, and an additional 37 GCs that were subsequently recruited in the course of this study (‘Expanded SG-3’) and (2) all 29 GCs in the LS-1 dataset. Genomic and histological analysis confirmed that the GCs exhibited highly variable stromal super-module expression across individual GCs (figure 5A for LS-1). A representative H&E-stained section was selected from each case and scanned using an Aperio scanner. To quantify the proportions of the different components within the cancer (eg, cancer cells, stroma including fibroblasts and extracellular matrix, tumour lumen, necrosis, vessels, inflammatory cells), we used a computerised morphometric method (point counting, see online supplemental methods), previously applied to colon cancer39 and formally described by Weibel.40 The set of investigated GCs exhibited diverse histopathological phenotypes with respect to tumour cell density, intra-tumoural stroma, vascularity and immune cell infiltrates (figure 5B and C). We detected a significant positive correlation between the expression of the stromal super-module and the morphometrically quantified proportion of intra-tumoural stroma in both, the expanded SG-3 and LS-1 datasets (SG-3: median ITS: 60%, range: 15–99%, correlation coefficient r=0.327, p=3.14×10⁻⁵, figure 5D; LS-1: 29 GCs, median ITS: 47%, range: 3–88%; correlation coefficient r=0.426, p=0.021; online supplemental figure 8). The association between stromal super-module expression and ITS proportion remained significant after correcting for stage, age, gender, Laurén classification and grade (expanded SG-3: p=0.002; LS-1: p=0.024; partial correlation analysis41). This result suggests that the expression level of the stromal super-module in GCs may be directly related to the proportion of ITS measured in H&E-stained tissue sections.
Association of intra-tumoural stroma (ITS) proportion with stromal super-module expression and patient survival. (A) Stromal super-module expression of gastric cancers (GCs) in the LS-1 dataset (n=29). Columns represent individual GCs, rows represent individual stromal modules. Red, high stromal super-module expression, green, low stromal super-module expression. The orange arrows at the extreme left and right represent GCs selected for figure 5B and C. (B) and (C) Representative H&E-stained sections of GCs (top panel) illustrating prominent differences in ITS between a GC with high stromal super-module expression (B) and a GC with low stromal super-module expression (C). Consecutive sections from the same blocks subjected to cytokeratin (CK) immunohistochemistry to facilitate visualisation of GC tumour cells (brown). The intra-tumoural stroma was CK negative (blue due to the haematoxylin counterstain). (D) Association of stromal super-module expression with the ITS proportion in the expanded SG-3 dataset. The y axis represents the normalised ITS proportion measured by morphometry (see Methods). The x axis represents the expression level of the stromal super-module. Each point represents an individual GC. A significant positive correlation was observed (correlation coefficient r=0.327, p=3.14×10⁻⁵). (E) 131 GCs from LS-2 were divided into three equal-sized groups based on the levels of ITS, for example GCs with high, moderate or low ITS proportion. Kaplan–Meier analysis demonstrates that patients with GCs exhibiting a high ITS proportion (blue line) have poorer cancer-specific survival compared to patients with low ITS proportion GCs (green line, p=0.006, log-rank test).
To further investigate the stromal super-module expression/ITS proportion association, we tested whether the ITS proportion directly measured from H&E-stained tissue samples, might predict GC patient survival. Applying the same computerised point counting method, we analysed another independent series of 131 GC patients from which TMAs had been constructed (LS-2, see Methods, online supplemental table 2 provides the clinicopathological characteristics of the TMA cohort). A high ITS proportion was more commonly seen in diffuse-type GC than intestinal-type GC (median ITS diffuse-type GC: 64%, range: 17–95%; median ITS intestinal-type GC: 47%, range: 11–92%; p=0.005; Student's t test), in late-stage GCs than early-stage GCs (median ITS late-stage GCs: 62%, range: 11–95%; median ITS early-stage GCs: 47%, range: 13–92%; p=0.01), and in high-grade GCs than low-grade GCs (median ITS high-grade GCs: 57%, range: 13–95%; median ITS low-grade GCs: 47%, range: 11–82%; p=0.007). Similar to the genomic results, a Kaplan-Meier survival analysis comparing the one third of patients with high ITS GCs with one third of patients with low ITS GCs revealed that patients with high ITS GC had a significantly poorer prognosis (p=0.006, log-rank test; figure 5E). A trend towards worsened survival was also seen in ITS high diffuse-type GCs (p=0.29, log-rank test). However, in multivariate analysis, including ITS proportion (continuous variable), age (<65 years vs ≥65 years), gender (male vs female), morphology (intestinal-type vs diffuse-type vs mixed type), grade of differentiation (well vs moderate vs poor) and pathological tumour stage according to TNM classification (UICC/AJCC 6th edition) in the Cox regression model, ITS proportion was not an independent predictor of patient survival (p=0.682; online supplemental table 12).
Similar to the LS-2 dataset, in the expanded SG-3 dataset, a high ITS proportion was more commonly seen in diffuse-type GCs than intestinal-type GC (median ITS diffuse-type GC: 67%, range: 15–96%; median ITS intestinal-type GC: 53%, range: 18–92%; p=9.204×10⁻⁵), in high-grade GCs than low-grade GCs (median ITS high grade GCs: 64%, range: 15–96%; median ITS low-grade GCs: 55%, range: 20–92%; p=0.044), and tended to be more common in late-stage GCs than early-stage GCs (median ITS late-stage GCs: 63%, range: 18–95%; median ITS early-stage GCs: 53%, range: 15–96%; p=0.076). Most importantly, when divided into three equal-sized groups based on their ITS proportions, SG-3 patients with high ITS GCs also exhibited a poorer overall survival compared with patients with low ITS GCs (p=0.047; online supplemental figure 9). The similarity of these relationships between clinicopathological data, patient survival and morphometry results compared with the genomic analysis results, both derived from entirely independent GC datasets, supports the potential existence of a biological relationship between the level of stromal super-module expression and the ITS proportion in GCs.
Discussion
This study reports the largest genomic meta-analysis of GC to date exceeding previous studies by more than double the total number of patients.22 Compared with previous GC gene expression studies from single centres,15–20 our meta-analysis of multiple expression datasets provided increased statistical power enabling us to identify significant gene-gene relationships which would most likely be less evident in smaller datasets.22 For example, demonstrating the increased sensitivity of the current study, we were able to detect the expression of several modules related to mitochondrial and proteosomal function, which were not evident in our own previous analyses of smaller subsets of the same data.15–20 Previous studies based on data from a single microarray platform may also suffer from biases due to platform-specific artifacts.42 In contrast, our meta-analysis approach combined data from multiple independent patient populations and different microarray platforms, maximising the probability that identified relationships are biologically relevant.
Our analysis indicates that the GC coexpression network exhibits a ‘scale-free' topological organisation where the vast majority of genes are connected to a small number of other genes (‘edges'), and only a few genes (‘hubs') are highly connected to many other genes.43–45 A survey of the top ‘hub' genes revealed involvement in normal gastric physiology (PGC, LIPF), cell adhesion (NCAM1, LGALS4, MGP), gene transcription (ILF2, H2AFZ), and signalling (PPP2R3A, PPTRC) (online supplemental table 5). It is possible that these 'hub' genes may function as important control nodes in the GC gene coexpression networks, however, without direct functional data the functional significance of the 'hub' genes in the GC coexpression network remains to be elucidated. In addition to hub genes, our analysis revealed the existence of 178 expression modules associated with diverse cellular functions ranging from cell proliferation and immunity to mitochondrial and stromal function. Some of the identified expression modules may highlight therapeutic opportunities. For example, we observed high expression of modules related to proteasomal function in a subset of GCs. Bortezomib, a clinically approved proteasome inhibitor, has recently shown pre-clinical efficacy in GC cells.46 It may be interesting to investigate if GCs expressing high levels of the proteasomal modules exhibit heightened sensitivity to bortezomib or other related proteasomal inhibitor compounds. We also identified relationships between modules, for example, GCs with high expression of cell proliferation modules tended to coexpress modules related to digestive function, while GCs with high expression of the stromal super-module exhibited low levels of proliferation and digestive module expression. The mutual exclusivity of the expression of the stroma and proliferation modules observed in this study is consistent with recent studies demonstrating that cancer cells can exist in either a proliferative or invasive state, but usually cannot proliferate and invade at the same time.47–49
We found that the expression level of a TGF-β associated super-module of stroma-related genes consistently predicted clinical outcome in multiple independent GC datasets. Expression of the stromal super-module was also related to the ITS proportion, a specific morphological GC phenotype and diffuse-type histology. These genomic and morphometric results are of clinical relevance, as they suggest that the prognosis of GC patients may be influenced by cancer cells and by other cell types residing in the tumour stroma. Our results also provide a molecular basis that may explain, at least in part, the poor prognosis of diffuse-type GC patients. First, the negative correlation between stroma and cell proliferation may contribute to the poor response of diffuse-type GCs to cytotoxic chemotherapy, which targets actively dividing cells. Second, a high ITS proportion may directly inhibit the effects of current therapies by reducing both drug delivery to tumour cells50 ,51 and protecting cells against chemotherapy-induced apoptosis.52 Third, recent functional studies have indicated that the tumour stroma may play a vital role in the differentiation, proliferation and migration of tumour cells,53 and the tumor stroma may contribute to aggressive disease by providing a favourable mechano-environmental scaffold necessary for tumour progression.54 These findings are supported by studies in different cancer types including oesophageal,55 colorectal,39 ,56 prostate,57 pancreatic,58 breast and liver cancers,59 which showed that the tumour microenvironment and stroma may play significant roles in patient prognosis and chemosensitivity.60–63 However, to our knowledge, our report is the first to demonstrate a prognostic role of the tumour stroma in GC, highlighting the potential role of the ITS proportion as a predictive biomarker to identify subgroups of patients with GCs that might respond to therapies directed towards the tumour stroma.
Given the association between stromal super-module expression levels and GC patient survival, and the current limited impart of targeted agents (trastuzumab, lapatinib) in diffuse-type GCs, we were interested in identifying the molecular pathways potentially influencing intra-tumoural stroma growth. By correlating the expression levels of the stromal super-module to the activity of different oncogenic-signalling pathways, our analysis strongly implicates the TGF-β signalling pathway as a key regulator of the intra-tumoural stroma. Although the TGF-β pathway has been historically viewed as a tumour-suppressive pathway where tumour cells often exhibit mutational or epigenetic inactivation of TGF-β pathway components, such as TGFβRI, TGFβRII and SMAD4,64 recently published work suggests that TGF-β signalling in tumours is more complex and may stimulate a pro-tumourigenic stromal environment.65 For example, TGF-β ligands secreted by cancer cells have been shown to alter the function of healthy fibroblasts within the tumour stroma, leading to a myofibroblast-like phenotype supporting tumour growth, vascularisation and metastasis.66 ,67 Notably, the TGF-β pathway has been identified as a target for therapeutic intervention using endogenous proteins, such as soluble betaglycan or decorin, or artificial agents, such as antisense oligonucleotides, antibodies or small-drug molecules.64 Given the dearth of therapeutic options for GC patients at present, it will be important to assess if targeting TGF-β might prove an effective strategy for perturbing the GC tumour stroma and improving patient outcomes.
In summary, this is the first comprehensive genomic meta-analysis of GC transcriptome data, generating a robust inventory of multiple gene-expression modules present in GCs. Our analysis revealed that the level of stromal super-module expression in GCs may serve as a novel prognostic factor in GC, and that this pathway is likely to involve TGF-β signalling. Admittedly, the association between patient survival and stromal gene expression/ITS proportion, while statistically significant, is relatively weak with regard to effect size. As such, it remains currently uncertain whether measuring the ITS proportion will prove to be a useful clinical tool for predicting GC patient prognosis, above and beyond the accepted standard of TNM tumour staging. To definitively address this question, future research goals will involve measuring the ITS proportion in patient materials from large prospective multicentre randomised controlled trial populations, where potential biases, due to disease stage, patient-related factors, treatment, pathology reporting and tissue collection are minimised. Finally, very few of our patients received chemotherapy prior to surgery, and hence, our results cannot address the prognostic value of the ITS proprotion after neoadjuvant chemotherapy. Given the increasing use of neoadjuvant chemotherapy in GC patients in the West,68 ,69 it will be intriguing to evaluate the impact of neo-adjuvant chemotherapy on ITS at the histological and molecular level.
Acknowledgments
The authors thank Ken Hillan from Genentech for supporting the generation of the Leeds microarray dataset.
References
Supplementary materials
Supplementary Data
This web only file has been produced by the BMJ Publishing Group from an electronic file supplied by the author(s) and has not been edited for content.
Files in this Data Supplement:
- Data Supplement 1 - Online Supplements
Footnotes
-
Funding This work was supported by Grants to PT from the Biomedical Research Council of Singapore (Grant 05/1/31/19/423), the National Medical Research Council of Singapore (Grant TCR/001/2007), and internal grants from the Duke-National University of Singapore Graduate Medical School, and the Cancer Sciences Institute of Singapore. The funders had no role in study design, data collection and analysis, decision to publish or preparation of the manuscript.
-
Competing interests None.
-
Patient consent Obtained.
-
Ethics approval Primary gastric cancer tissue samples were collected with patient consent from the participating centre's tissue repositories or pathology archives and approval by the respective institutional Research Ethics Review Committees in accordance with local regulations and legislations. Clinical information was collected with Institutional Review Board approval.
-
Provenance and peer review Not commissioned; externally peer reviewed.
-
Data sharing statement The microarray data in this study is available from GEO under accession numbers GSE2669, GSE2680, GSE2685, GSE2637, GSE3438, GSE15459, GSE13861, GSE37023, GSE35809 and http://smd.stanford.edu/cgi-bin/publication/viewPublication.pl?pub_no=516.