Article Text

Abstract
Objective To characterise the influence of diet on abdominal symptoms, anal gas evacuation, intestinal gas distribution and colonic microbiota in patients complaining of flatulence.
Design Patients complaining of flatulence (n=30) and healthy subjects (n=20) were instructed to follow their usual diet for 3 days (basal phase) and to consume a high-flatulogenic diet for another 3 days (challenge phase).
Results During basal phase, patients recorded more abdominal symptoms than healthy subjects in daily questionnaires (5.8±0.3 vs 0.4±0.2 mean discomfort/pain score, respectively; p=<0.0001) and more gas evacuations by an event marker (21.9±2.8 vs 7.4±1.0 daytime evacuations, respectively; p=0.0001), without differences in the volume of gas evacuated after a standard meal (262±22 and 265±25 mL, respectively). On flatulogenic diet, both groups recorded more abdominal symptoms (7.9±0.3 and 2.8±0.4 discomfort/pain, respectively), number of gas evacuations (44.4±5.3 and 21.7±2.9 daytime evacuations, respectively) and had more gas production (656±52 and 673±78 mL, respectively; p<0.05 vs basal diet for all). When challenged with flatulogenic diet, patients’ microbiota developed instability in composition, exhibiting variations in the main phyla and reduction of microbial diversity, whereas healthy subjects’ microbiota were stable. Taxa from Bacteroides fragilis or Bilophila wadsworthia correlated with number of gas evacuations or volume of gas evacuated, respectively.
Conclusions Patients complaining of flatulence have a poor tolerance of intestinal gas, which is associated with instability of the microbial ecosystem.
- Colonic Bacteria
- Colonic Fermentation
- Colonic Microflora
- Functional Bowel Disorder
- Visceral Sensitivity
This is an open-access article distributed under the terms of the Creative Commons Attribution Non-commercial License, which permits use, distribution, and reproduction in any medium, provided the original work is properly cited, the use is non commercial and is otherwise in compliance with the license. See: http://creativecommons.org/licenses/by-nc/3.0/ and http://creativecommons.org/licenses/by-nc/3.0/legalcode
Statistics from Altmetric.com
Significance of this study
What is already known on this subject?
-
Some patients specifically complain of excessive evacuation of gas per anus.
-
Intestinal gas content depends by-and-large on gas production by bacterial fermentation of unabsorbed substrates.
-
Diet influences anal gas evacuation and gut microbial composition.
What are the new findings?
-
A proportion of patients complaining of flatulence have increased number of gas evacuations, but the net volume of gas evacuated is within the normal range.
-
Flatulence is associated with abdominal symptoms.
-
Patients’ microbiota present dysbiotic traits and characteristically respond with instability in microbial composition when consuming a flatulogenic diet.
-
A number of gut bacterial taxa correlate with anal gas evacuations and volume of gas evacuated.
How might it impact on clinical practice in the foreseeable future?
-
Diet influences flatulence, abdominal symptoms, digestive comfort and stability of the gut microbial ecosystem in patients complaining of flatulence.
-
Microbial biomarkers may predict symptoms associated with flatulence.
Introduction
Some patients complain of excessive evacuation of gas per anus, which may become socially disabling. However, the physiology and pathophysiology of flatulence remain poorly understood.1 ,2
Gas evacuated per anus originates by-and-large in the colon, where unabsorbed meal residues are fermented by colonic bacteria.3–5 However, even on the same diet, the amount of gas production exhibits very large interindividual differences. Hence, the volume of gas produced and evacuated per anus is determined by two main factors: the diet, particularly the amount of fermentable residues, and the composition and metabolic activity of colonic microbiota.
We hypothesised that patients complaining of excessive passage of gas per anus: (a) really have higher number of gas evacuations on their usual diet than healthy subjects; (b) have more intestinal gas production and evacuate more volume of gas; (c) gas evacuation depends on diet, but the differences in number of evacuations and volume of gas evacuated between patients and healthy subject are not due to differences in diet, that is, are also present on a standardised diet; and (d) these differences are associated with differences in the colonic microbiota. Hence, our aims were to determine: (a) the effect of diet on the number of gas evacuations and the volume of gas evacuated; (b) whether the number of evacuations and the gas volume evacuated are increased in patients complaining of flatulence; and (c) the relationships among diet, abdominal sensations, gas evacuation and colonic microbiota. To this aim, we designed a comprehensive study comparing patients complaining of excessive passage of gas per anus and healthy subjects. We took advantage of high-throughput sequencing technology and recently developed bioinformatic tools to comprehensively analyse the whole spectrum of gut microbial communities.
Material and methods
Participants
A total of 30 patients complaining of excessive passage of gas per anus (age range 25–65 years) and 20 healthy subjects without gastrointestinal symptoms (age range 21–63 years) participated in the study. Antibiotic consumption during the previous 2 months was an exclusion criterion. Patients who consulted for excessive passage of gas per anus were instructed to prospectively fill out a clinical questionnaire (see details in clinical data section below) for 3 days (entry period), and only those scoring anal gas evacuation ≥5 on a 10-point scale were offered to participate in the study. All patients reported associated symptoms and fulfilled Rome III criteria for postprandial distress syndrome (n=15), irritable bowel syndrome (n=11; five diarrhoea-predominant, two constipation-predominant and four alternating) or functional abdominal pain (n=4).6 ,7 In healthy subjects, the same evaluation was performed during the entry period to confirm the absence of gastrointestinal symptoms. Subjects gave written informed consent to participate in the study. The protocol for the study was previously approved by the Institutional Review Board of University Hospital Vall d'Hebron.
Study design
Participants were instructed to follow their usual diet for 3 days (basal phase) and to consume a diet rich in fermentable residues for another 3 days (challenge phase), during which each meal (breakfast, lunch, dinner) included at least one portion of the following: (a) bread, cereals and pastries made of whole wheat or corn; (b) beans, soya bean, corn, broad bean or peas; (c) Brussels’ sprouts, cauliflower, broccoli, cabbage, celery, onion, leek, garlic or artichoke; and (d) banana, fig, peach, grapes or prunes. A specifically trained nurse provided detailed instructions about the foods to be consumed, but the caloric content of the diet was not standardised. Participants were offered to obtain the foodstuffs directly in the research unit. To address compliance with the diet, participants were instructed to fill out a diary specifying the foods consumed.
During both dietary intervention phases, the following evaluations were performed: (a) clinical data; (b) number of anal gas evacuations; (c) microbiota analysis (stool sampling last 2 days) in the morning of the fourth day; (d) volume of intestinal gas produced after a test meal; and (e) volume of abdominal gas by CT imaging after the challenge phase in patients only.
Measurements
Number of anal gas evacuations
The number of gas evacuations per anus was measured using an event marker (DT2000 Memory Stopwatch, Digi sport instruments, Shanggiu, China) during each study phase. Participants were instructed to carry the event marker during daytime and to register every evacuation of gas per anus. Previous studies measuring the number of gas evacuations simultaneously by an event marker and continuous recording of anal gas evacuation showed a very good correlation.8–11
Clinical data
Participants were instructed to fill out a questionnaire at the end of the 3 days during each study phase that evaluated the following parameters: (a) number of bowel movements and stool form using the Bristol scale;12 (b) subjective sensations of flatulence (defined as anal gas evacuation), abdominal bloating (pressure/fullness), abdominal distension (girth increment), borborygmi and abdominal discomfort/pain, by corresponding 0–10 analogue scales; and (c) digestive well-being using a 10-point scale graded from +5 (satisfaction) to −5 (dissatisfaction). On the last day of each study phase, body weight and girth were measured.
Volume of intestinal gas produced after a test meal
Gas collection tests were conducted after overnight fast the fourth day of each study phase. A standard meal (either normal or flatulogenic) was administered and the volume of gas evacuated was measured for 6 h, as previously described;13 ,14 in brief, gas was collected using a rectal balloon catheter (20 F Foley catheter, Bard, Barcelona, Spain) connected via a line without leaks to a barostat, and the volume was continuously recorded. The normal meal was administered at the end of the basal phase and consisted of a glass of milk (coffee optional) and buttered toasts with marmalade (330 Kcal, 1.2 g fibre); the flatulogenic meal was administered at the end of the challenge phase and consisted of cooked beans with sausage, whole wheat bread and canned peach (874 Kcal, 26.5 g fibre).
Volume of abdominal gas
Abdominal CT scans were obtained after the 6 h gas collection test with a helical multislice CT scanner (M×8000, Philips Medical Systems, Best, The Netherlands) with the following specifications: exposure of 120 kV and 50 mAs, 2.5-mm section thickness, reconstruction at 1.6-mm intervals, 1.5 pitch ratio, and 512×512 acquisition matrix.15 With these characteristics, the total effective dose was 2.4 mSv, similar to the dose of a CT colography and approximately a quarter of the dose of a standard CT scan.16 Abdominal gas volume was measured using a software program developed in our laboratory.15
Microbiota analysis
A total of 100 faecal samples (basal and challenge phases in each participant) were used for microbial community analysis. Faecal samples were collected at home, kept immediately at −20°C in the home freezer and delivered frozen to the laboratory using a freezer pack. They were stored at −80°C for later analysis. Subjects were instructed to collect faecal samples on the 2 days prior to their scheduled visit on the last day of each study phase and the last sample was used. Genomic DNA extraction was conducted as described by Godon et al.17 DNA was then submitted to PCR-amplification of the V4 region of the bacterial and archaeal 16S rRNA gene. The V4 primer pairs used in this study are expected to amplify almost 100% of the Archaea and Bacteria domains according to our analysis done using PrimerProspector software.18 The forward (V4F_517_17: 5′-GCCAGCAGCCGCGGTAA-3′) and reverse (V4R_805_19: 5′-GACTACCAGGGTATCTAAT-3′) primers targeting the 16S gene had their 5′ ends tagged with specific sequences for pyrosequencing as follows: 5′-CCATCTCATCCCTGCGTGTCTCCGACTCAG-{MID}-{GCCAGCAGCCGCGGTAA}-3′ and 5′-CCTATCCCCTGTGTGCCTTGGCAGTCTCAG-{GACTACCAGGGTATCTAAT}-3′. Tag pyrosequencing was performed using multiplex identifiers of 10 bases provided by Roche, which were specified upstream the forward primer sequence (V4F_517_17). Standard PCR was run in a Mastercycler gradient (Eppendorf) at 94°C for 2 min, followed by 35 cycles of 94°C for 30 s, 56°C for 20 s, 72°C for 40 s and a final cycle of 72°C for 7 min. The 16S rRNA V4 amplicons were subsequently sequenced on the 454 Life Sciences (Roche) Genome Sequencer FLX and Junior platforms (Scientific and Technical Support Unit, Vall d'Hebron Research Institut, Barcelona, Spain), according to standard 454 platform protocols.
Pyrosequencing of the PCR products generated a total of 570 000 raw sequences from all the samples. These sequences (or reads) were subsequently filtered using V.1.3 of the QIIME pipeline (http://qiime.sourceforge.net/), following the recommendations of Huse et al.19 Cd-hit was used to cluster sequences into operational taxonomic units (OTUs, or taxa) at 97% sequence identity. We also compared this approach with the UCLUST clustering method, with similar results in terms of diversity and OTU numbers. Representative sequences for each OTU were aligned using PyNAST against Greengenes template alignment (February 2011 release), and taxonomy was assigned to the OTUs detected using Basic Local Alignment Search Tool and the Greengenes taxonomy mapping file. We considered only taxa that were represented in at least one sample by at least 0.2% of the sequences in that sample.
Statistical analysis
Microbiota analysis
For α and β microbiota diversity analyses, samples were subsampled to 1356 sequences per sample to remove biases due to sequencing depth. Rarefied at 1356 sequences per sample, all samples in our dataset had an average of Good's coverage of 97% (SD±0.84), which means that at this level of coverage an additional sequence would have only a 3% chance of belonging to a previously unseen type. Distance matrices were built using both the weighted and unweighted UniFrac metrics, and hierarchical clustering with UPGMA (unweighted pair group method with arithmetic mean) was used to build trees.
Overall comparisons
In each subject, daily measurements during each diet were averaged. In each group of subjects, mean or grand mean values (±SE) of all parameters measured were calculated. Overall comparison of each variable between data sets (patients and healthy subjects, before and after diet challenge) was performed by Kruskal–Wallis non-parametric analysis of variance, and if variation among data sets was considered significant (p<0.05), post hoc comparisons between data sets were tested by Dunn's multiple comparisons method. Correlations of paired data were analysed by linear regression analysis. Prevalence of specific microbial groups among individuals was compared by χ2 test for independence (overall comparison) and the Fisher exact test (two groups comparison).
Results
Basal phase
The caloric content of the diet during the basal period was similar in patients (1584±58 kcal/day) and healthy subjects (1582±51 kcal/day), but the fibre content was lower in patients (13.3±0.9 vs 17.7±0.7 g/day in healthy subjects; p=0.003).
Number of gas evacuations
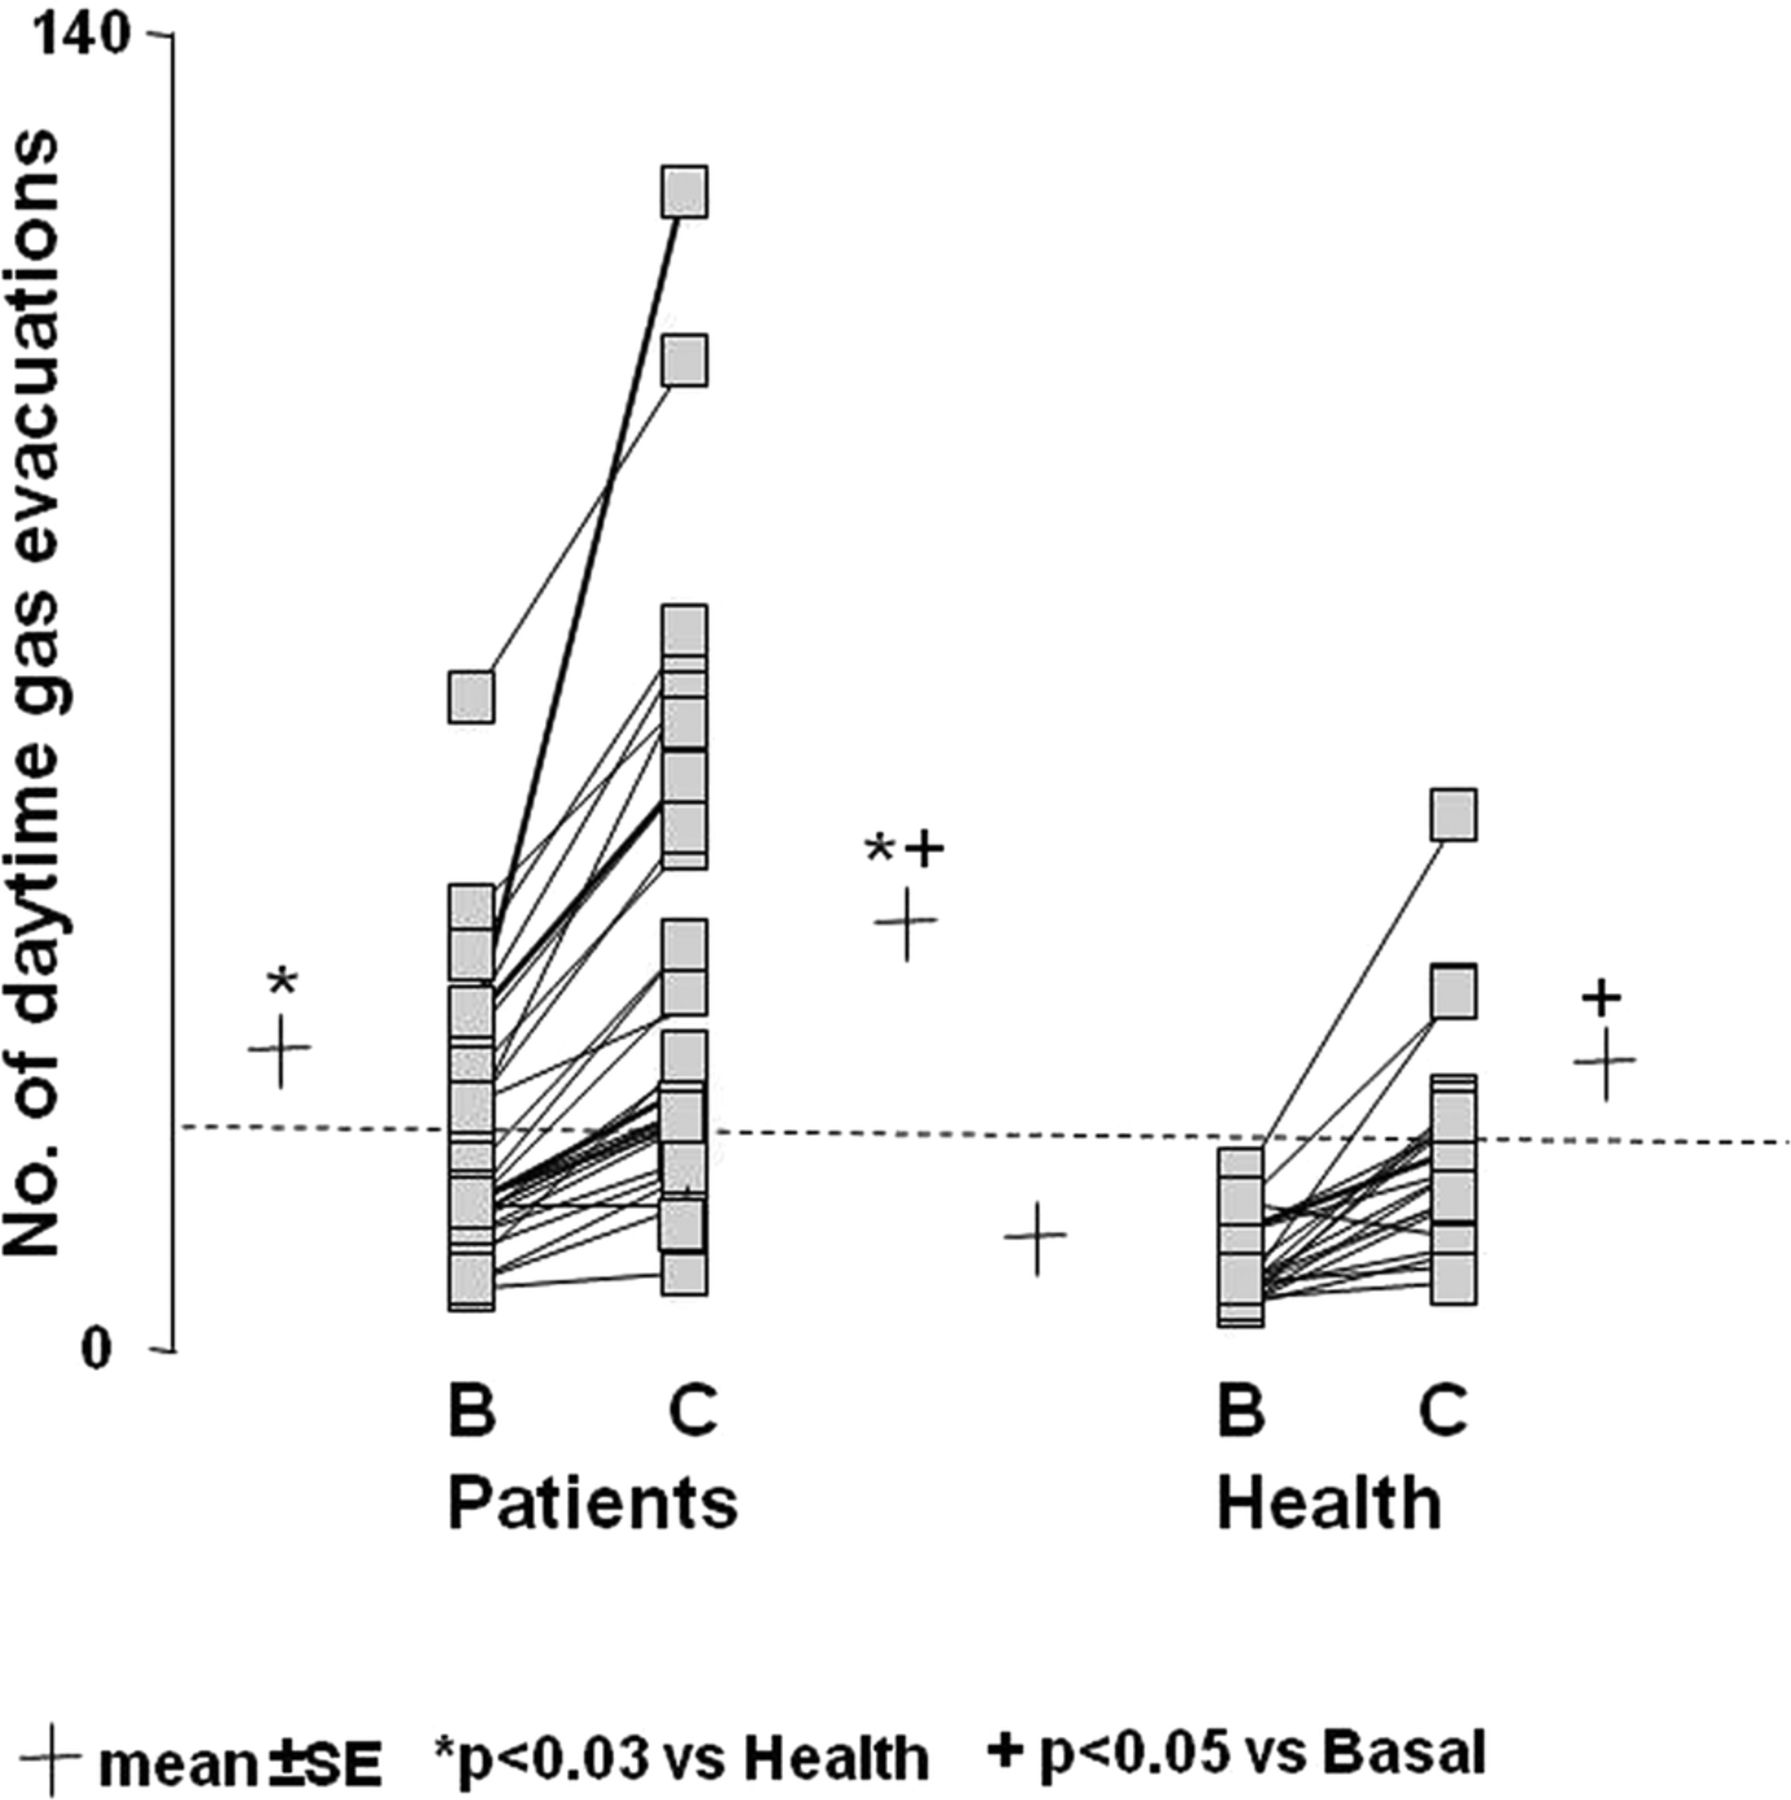
On their current diet, healthy subjects evacuated gas per anus a mean of 7.4±1.0 times during daytime (figure 1). The number of gas evacuations was significantly higher in patients complaining of flatulence (21.9±2.8 evacuations during daytime, p>0.001 vs health), but in 18 of them the number of evacuations was within the normal range (<18 evacuations during daytime) (figure 1).

Effect of diet on the number of daytime anal gas evacuations. Note the higher number in patients than in healthy subjects both during basal (B) and challenge diet (C), and marked increase during challenge diet. Data are individual values (average of three daily measurements during basal phase and last 2 days challenge phase). Dotted line represents upper limit of normal range during basal diet.
Clinical parameters
On their basal diet, healthy subjects experienced virtually no abdominal symptoms and, interestingly, reported a relatively high level of digestive comfort (figure 2). In patients, subjective perception of flatulence was higher than in healthy subjects but, interestingly, they also reported abdominal symptoms and negative gut comfort (figure 2). In patients with abnormal number of gas evacuations, flatulence sensation was higher than in those within the normal range (8.3±0.3 vs 6.7±0.3 score; p<0.001), but overall the correlation of sensation of subjective flatulence and objective number of evacuations was only modest (R=0.64; p<0.001). The severity of other clinical symptoms, including digestive well-being, was not related to the number of evacuations and flatulence sensation. No differences in stool form and frequency were detected between patients (4.2±0.3 Bristol score, 1.8±0.2 daily stools) and healthy subjects (4.2±0.2 Bristol score, 1.4±0.1 daily stools).

Effect of diet on clinical parameters. Symptoms (scored from 0 to 10) and digestive comfort (scored from +5 to −5) on the last day of basal and challenge phases. Data are means±SE.
Volume of gas evacuation
After a normal breakfast, healthy subjects evacuated a mean volume of 269±24 mL gas in 6 h (figure 3 and see online supplementary figure S1). Patients evacuated a similar volume of gas after the standard breakfast (262±22 mL; p=0.943 vs health) (figure 3), despite the higher number of gas evacuations measured in the previous days; the correlation of both parameters (volume evacuated vs number of evacuations in previous days) was poor (R=0.36; p=0.048). The evacuation rate decreased 5 h after breakfast in both groups (figure 3).

Postprandial rectal gas collection. Cumulative data (means±SE) after test meal.
Microbial profiles
The phylogenetic characterisation of samples from healthy subjects uncovered four main bacterial phyla in the following proportions: Firmicutes (50%), Bacteroidetes (46%), Actinobacteria (1.3%) and Proteobacteria (2.3%). Archaebacteria and less abundant bacterial phyla such as Fusobacteria, RF3, Tenericutes and Lentisphaerae were also present. Across all taxa, 61 genera and 547 OTUs, with an average of 131 observed OTUs per sample, were identified. The genera that accounted for 61% of the sequences were: Bacteroides (22%), Prevotella (18%), Faecalibacterium (8%), unknown Lachnospiraceae (7%) and unknown Ruminococcaceae (6.2%). At the species level, an unknown Prevotella (14.6%), Bacteroides uniformis (6%), Bacteroides plebeius (5.6%), two unknown Faecalibacterium (7.1%) and an unknown Roseburia (3.6%) represented the most abundant taxa (37%). Methanobrevibacter smithii was detected as the sole representative of Archaea.
Weighted UniFrac-based principal coordinates analysis did not segregate patient and healthy subject samples into different clusters (see online supplementary figure S2A), suggesting that microbiota of patients and healthy subjects were similar in terms of proportion of the main taxonomic phyla (see online supplementary figure S2B), richness (Chao1 estimation; online supplementary figure S3A) and average number of taxa per individual (131 for healthy subjects and 130 for patients; online supplementary figure S3B). However, differences between patients and healthy subjects involved less abundant microbial groups or taxa. Thus, nine bacterial taxa, which accounted for 4.9% of the overall sequence dataset, were significantly higher (from 2- to 20-fold; p<0.05) in patients than in healthy subjects. These nine taxa belonged to Bacteroidetes, Firmicutes and Actinobacteria phyla and fell within six genera: Clostridium, Phascolarctobacterium, Bacteroides, Coprococcus, Blautia and an uncultured Bifidobacteriales (see supplementary table S1). In addition, seven unknown bacterial taxa were found to be significantly under-represented in patients (2- to 24-fold lower; p<0.05) relative to the healthy group. These taxa belong to five genera: Bacteroides, Oscillospira, uncultured Ruminococcaceae, uncultured Bacteroidales and uncultured Clostridiales.
Challenge phase
The fibre content of the challenge diet was significantly higher than the basal diet both in patients and health subjects (26.3±0.9 and 28.1±1.9 g/day, respectively; p<0.001 vs basal for both), but the caloric content remained similar (1494±37 and 1500±63 kcal/day, respectively).
Number of gas evacuations
The flatulogenic diet effectively increased the number of gas evacuations both in healthy subjects and in patients (0.6±0.1 evacuations/h in healthy subjects and 1.3±0.1 in patients; p<0.048 vs basal for both). The net effect of the diet was similar in both groups (figure 1). The number of gas evacuations on the challenge diet correlated with that on the basal diet (R=0.851; p<0.001).
Clinical parameters
The flatulogenic diet was associated with a significant increase in body weight and girth in healthy subjects (by 780±100 g and 13.0±0.2 mm, respectively; p<0.001 for both) and in patients (by 900±400 g; p=0.020; and 14.0±0.2 mm; p<0.001; respectively; NS vs health). Healthy subjects experienced abdominal symptoms on the flatulogenic diet and reported a decrease in digestive comfort (figure 2). Their symptom profile during the challenge diet became similar to that of patients at baseline. In patients on the challenge diet, abdominal symptoms significantly worsened, and the level of digestive well-being in the comfort/discomfort scale further deteriorated (figure 2). In healthy subjects, with low basal scores, the effect on symptoms became clear after the first day of diet and increased over the following 2 days of diet. In patients the effect of diet on symptom was significant, but limited (less marked than in healthy subjects) because basal scores were already at the top of the scales with small span for worsening (figure 2). Diet did not influence stool frequency and consistency in either patients or healthy subjects (data not shown).
Volume of gas evacuation
The volume of gas evacuated after the flatulogenic test meal was significantly higher than that measured during the basal phase in patients and healthy subjects alike (656±52 and 673±78 mL, respectively; p<0.001 vs basal for both) (figure 3), but the relation of both volumes (basal vs flatulogenic diet) was poor (R=0.477; p=0.001; pooling patients and healthy subjects; online supplementary figure S1). As during the basal diet, the correlation of the volume evacuated and the number of gas evacuations measured the days before was poor (R=0.10; p=0.235; pooling patients and healthy subjects).
Intestinal gas distribution
Total abdominal gas volume in patients was 167±19 mL with 29±6 mL in the stomach, 24±7 mL in the small bowel and 113±17 mL in the colon (28±4 mL right, 28±10 mL transverse, 32±9 mL left and 25±5 mL pelvic colon). No significant differences in total or segmental colonic gas volumes were observed either between patients with a number of gas evacuations within versus above the normal range during the basal phase or between the half of patients with higher versus the half with lower volume of gas evacuated after the test meal (data not shown).
Microbial profiles
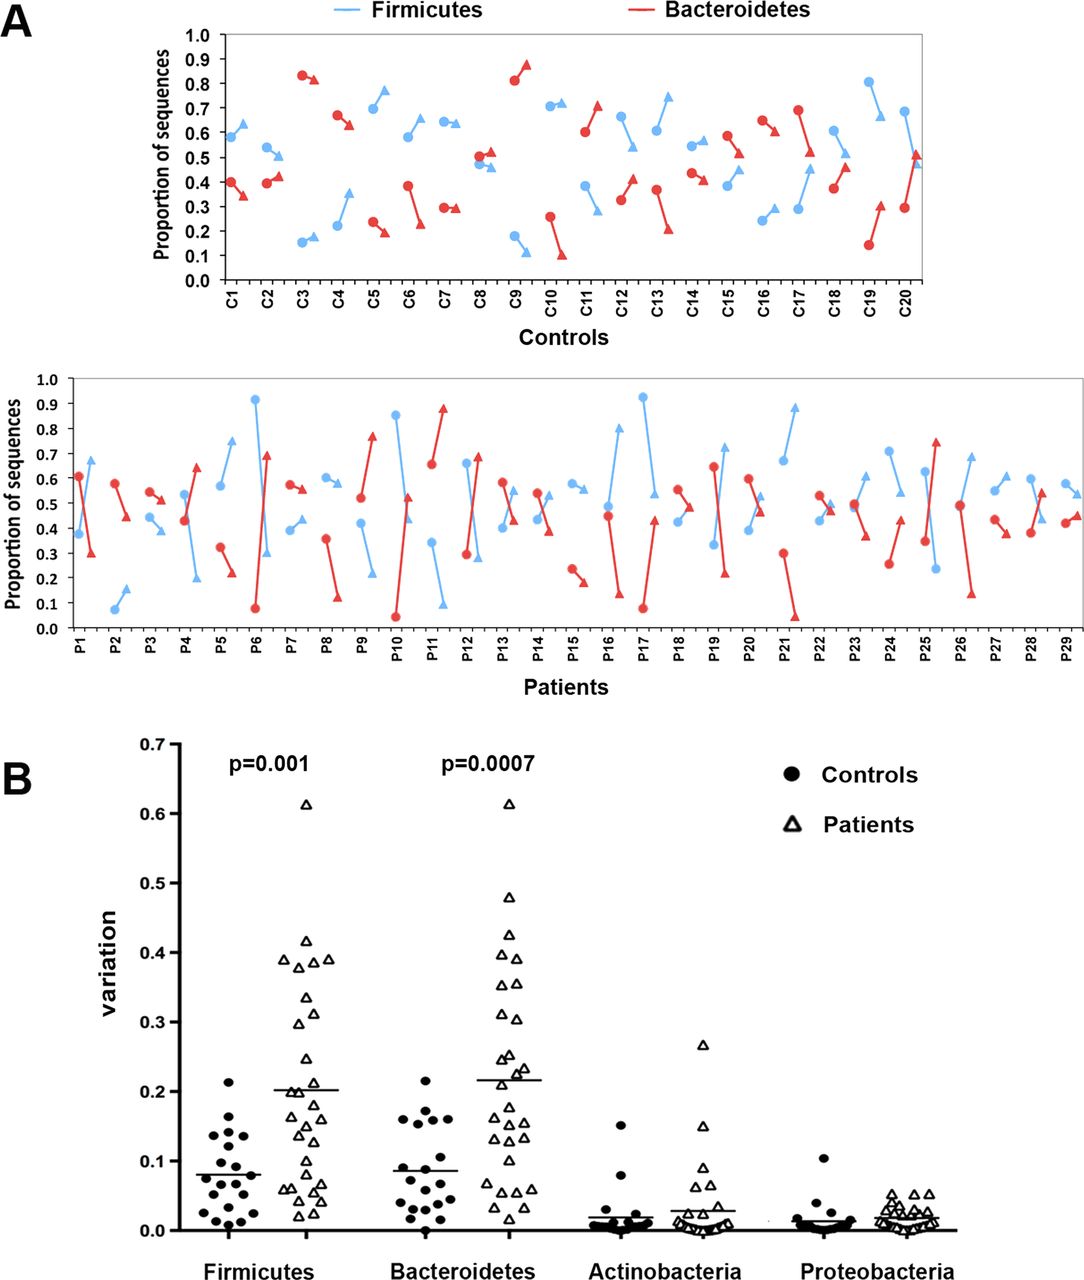
In samples obtained after the flatulogenic diet, the unweighted and weighted UniFrac-principal coordinates analysis did not detect dysbiosis (see online supplementary figure S2A). However, both a reduction of the Chao1 estimator and the number of observed taxa (paired t test, p=0.004 and p=0.007, respectively) indicated an overall lower microbial richness after flatulogenic diet than during the basal phase in patients (see online supplementary figure S3A and S3B, respectively), but not in healthy subjects. In addition to this diet-related reduction of microbial diversity in patients, UPGMA clustering of weighted UniFrac distances revealed that the microbial community of patients was less stable than that of healthy subjects when challenged by the flatulogenic diet, as shown by wider distance between basal and challenge microbiota (branch length of 0.056 for patients vs 0.043 for healthy controls). Taxonomic analysis showed that flatulogenic diet did not change the average proportion of the main bacterial phyla in controls’ and patients’ microbiota (see online supplementary figure S2B). However, when analysed individually, taxonomic analysis showed that the diet had a strong impact on the patients’ microbial composition (figure 4) depicting a higher fluctuation among patients’ samples compared with controls. In comparison with healthy controls, patients changed significantly more in representation of the two main bacterial phyla, Bacteroidetes (p=0.0007) and Firmicutes (p=0.001).

Changes in microbiota at taxonomy level after challenge diet. (A) For each individual (20 healthy subjects and 29 patients) the abundance of Firmicutes (in blue) and Bacteroidetes (in red) during basal (•) and challenge phases (▴) is shown (connected by line). (B) Variations from baseline induced by challenge diet of the four most abundant bacterial phyla (individual data and mean values are shown).
Relation of clinical features and physiological parameters
No differences between patients with more (n=12) versus those with less (n=18) than 18 evacuations per day during basal conditions (upper limit of normal range) were found during basal phase in caloric and fibre content of the diet, abdominal symptoms, volume of gas evacuated, and microbial profiles (data not shown). Physiological parameters were compared among subgroups of patients fulfilling criteria for postprandial distress syndrome, irritable bowel syndrome and functional abdominal pain, and no consistent differences in number of gas evacuations, volume of gas evacuated after the test meal, volume of colonic gas measured in the CT scans and microbiota profile were found either during the basal phase or in response to the challenge diet (variations normalised with baseline).
By contrast, several associations between bacterial taxa and symptoms were found. At baseline, three taxa positively correlated (Pearson correlation, from R=0.56 to R=0.71; p<0.0001; false discovery rate (FDR)<0.01) with the number of gas evacuations: B uniformis, Bacteroides ovatus and Parabacteoides distasonis. Another taxon, Bilophila wadsworthia, positively correlated with volume of gas evacuated (R=0.64; p<0.001; FDR=0.12). An unknown Lachnospiraceae taxon, which was prevalent in all subjects, was negatively correlated with abdominal pain (R=−0.57; p<0.001; FDR=0.19). Finally, after the diet challenge, one bacterial taxon (another unknown Lachnospiraceae) was positively correlated with the occurrence of borborygmi (R=0.57; p<0.002; FDR=0.08).
Discussion
Our data indicate, first, that flatulence is associated with other abdominal symptoms and loss of digestive comfort; second, that the net volume of gas produced by flatulent patients after a standard meal is within the normal range; third, that diet influences gas production and flatulence as well as abdominal symptoms and digestive comfort in healthy subjects and more so in flatulent patients; and fourth, that there are differences in composition and stability of the gut microbial ecosystem between patients with flatulence and healthy subjects.
It has been shown that some food components in the normal diet, such as resistant starch, oligosaccharides and plant fibres, are incompletely absorbed in the small bowel and enter the colon.3–5 20–22 The colon harbours large amount of bacteria that may ferment these products releasing hydrogen and carbon dioxide.23–25 However, other pools of colonic microorganisms, particularly sulfate-reducing bacteria, acetogenic bacteria and methanogenic archaea, consume a large proportion of the gases produced by fermentation. Hypothetically, profiling the whole spectrum of resident colonic bacteria may help in understanding the differences in gas metabolism and evacuation between individuals.
We selected a population of patients whose predominant complaint was flatulence. However, this subjective perception was not objective in a portion of them and, despite their belief, their number of gas evacuations was within the normal range. On the other hand, when specifically questioned, it became clear that flatulence was associated in most instances with other symptoms, particularly abdominal bloating. Interestingly, the volume of gas produced after a test meal by flatulent patients, either with number of evacuations within or above the normal range, was not increased as compared with healthy subjects. Given the almost identical volume evacuated over 6 h after a meal, the difference in number of gas evacuations cannot be secondary to the net amount of gas produced. The obvious possibilities included increased sensitivity and/or reduced compliance of the distal colon and rectum. The alternative possibility of gas being retained within the colon after the test meal was ruled out by careful volumetric analysis of intestinal gas volume based on CT imaging.
Rectal sensitivity was not evaluated in these patients, but previous studies consistently found gut hypersensitivity in patients with functional gut disorders and abdominal bloating.26 ,27 Rectal compliance in patients with functional gut disorders is related to bowel habit; lower compliance has been shown in those with diarrhoea.26 ,27 Differences in gut microbiota between patients and healthy subjects may explain changes in net gas production and theoretically could affect gut function, including sensitivity and tonic motor activity, that is, compliance.28 Indeed, gas evacuation frequency was positively correlated with three bacterial taxa (B uniformis, B ovatus and P distasonis). Among these, B ovatus was found in significantly higher abundance in patients. Remarkably, these three co-occurring taxa of the Bacteroides fragilis group had been found also associated in other studies and to be producers of an enterotoxin.29–31 B ovatus in particular has been associated with a systemic antibody response in inflammatory bowel disease32 and with alterations to epithelial integrity in animal models of chronic intestinal inflammation.33 These species could trigger inflammatory pathways leading to hypersensitivity and poor tolerance of intestinal gas.
Our data on the effect of diet on gas evacuation obtained with a thorough methodology in a fairly large population of healthy subjects confirm previous observations.34 ,35 The effect of the high flatulogenic diet in patients was similar as in healthy subjects, both the number of anal gas evacuations and the volume of gas evacuated consistently increased. Diet increased gas production and evacuation as well as the severity of associated symptoms, and reduced digestive comfort. The deleterious effect of fibre on irritable bowel symptoms has been previously described.36 Interestingly, the high flatulogenic diet in healthy subjects induced symptoms similar to those reported by patients during basal conditions. The mechanism by which diet influenced symptoms seems likely related to the increment in gas production. Furthermore, the flatulogenic high-residue diet conceivably increased intestinal content, and this may explain the increase in body weight.
The taxonomic information presented by the cohort of patients and healthy subjects enrolled in our study is consistent with previous reports in terms of similarity of microbial structure from the phylum to the genus level.37–39 However, at species level, patients showed clear dysbiotic traits. Nine bacterial taxa (5% of the sequences dataset, belonging to Clostridium, Phascolarctobacterium, Bacteroides, Coprococcus, Blautia and an uncultured Bifidobacteriales) were more abundant in patients than in healthy subjects, and seven unknown bacterial taxa (belonging to Bacteroides, Oscillospira, uncultured Ruminococcaceae, uncultured Bacteroidales and uncultured Clostridiales) were found to be under-represented in patients. Moreover, in contrast to healthy controls, the flatulogenic diet revealed an unstable microbial community in patients complaining of flatulence, with dramatic changes at the phylum level. Those microbial changes were temporarily linked with worsening of symptoms, and a remarkable increase in gas evacuations. The volume of gas evacuated was positively correlated with B wadsworthia, a known opportunistic gut pathogen found in numerous anaerobic infections.40 ,41 B wadsworthia, a δ-proteobacteria, could be directly involved in the production of gas; this species is a saccharolytic bacteria that can reduce nitrate to nitrite and occasionally to N2, and is also characterised by a strong catalase activity and production of hydrogen sulfide from sulfur-containing amino acids.41
Our data may help to improve management of patients complaining of flatulence. The diagnosis of these patients should include a systematic evaluation of associated abdominal symptoms and their impact on digestive well-being. Specific challenge diets may allow the patients to identify the most offending foodstuffs. Low robustness of the microbiota in response to dietary challenges seems to be a crucial defect in patients complaining of flatulence. The potential role of microbiota on gut function and food tolerance may open future treatment strategies that may be more practical than restrictive diets for long-range adherence.
Acknowledgments
The authors thank Maite Casaus and Anna Aparici for technical support (physiological studies), Gloria Santaliestra for secretarial assistance, Ricardo Gonzalo, Francisca Gallego and Rosario M Prieto from the Scientific and Technical Support Unit (Vall d'Hebron Research Institute) for their technical assistance (sequencing), and Fidelma Greaves for her assistance with the English corrections.
References
Supplementary materials
Supplementary Data
This web only file has been produced by the BMJ Publishing Group from an electronic file supplied by the author(s) and has not been edited for content.
Files in this Data Supplement:
- Data supplement 1 - Online figure 1
- Data supplement 2 - Online figure 2
- Data supplement 3 - Online figure 3
- Data supplement 4 - Online legends
- Data supplement 5 - Online table
Footnotes
-
Contributors CM, EV and AE acquired the microbiota data; CM, AE, AG, JR, DK, JCC and RK analysed and interpreted the microbiota data; SE conducted the clinical study; CH analysed the clinical data; CM, FA, FG, JRM and DG contributed to study design and data interpretation; AA and JS recruited patients and supervised the clinical study; and CM, FG, FA, JR, JCC and RK produced and revised the manuscript.
-
Funding This work was supported by the FIS PI10/00902 grant (Ministerio de Ciencia e Innovacion, Spain), the Spanish Ministry of Education (Dirección General de Investigación, SAF 2009–07416), Fundació La Marató TV3 (MARATV3_072010), the European Community's Seventh Framework Programme (FP7/2007–2013: IHMS, grant agreement HEALTH.2010.2.1.1-2) and a grant from Danone Research (France). Ciberehd is funded by the Instituto de Salud Carlos III.
-
Competing interests None.
-
Patient consent Obtained.
-
Ethics approval Comite Etico del Institut de Recerca Vall d'Hebron.
-
Provenance and peer review Not commissioned; externally peer reviewed.
-
Data sharing statement Sequences were deposited in Genbank (accession number: SRP023495).
-
Open Access This is an Open Access article distributed in accordance with the Creative Commons Attribution Non Commercial (CC BY-NC 3.0) license, which permits others to distribute, remix, adapt, build upon this work non-commercially, and license their derivative works on different terms, provided the original work is properly cited and the use is non-commercial. See: http://creativecommons.org/licenses/by-nc/3.0/