Article Text

Abstract
Objective To examine the role of hepatocyte myeloid differentiation primary-response gene 88 (MyD88) on glucose and lipid metabolism.
Design To study the impact of the innate immune system at the level of the hepatocyte and metabolism, we generated mice harbouring hepatocyte-specific deletion of MyD88. We investigated the impact of the deletion on metabolism by feeding mice with a normal control diet or a high-fat diet for 8 weeks. We evaluated body weight, fat mass gain (using time-domain nuclear magnetic resonance), glucose metabolism and energy homeostasis (using metabolic chambers). We performed microarrays and quantitative PCRs in the liver. In addition, we investigated the gut microbiota composition, bile acid profile and both liver and plasma metabolome. We analysed the expression pattern of genes in the liver of obese humans developing non-alcoholic steatohepatitis (NASH).
Results Hepatocyte-specific deletion of MyD88 predisposes to glucose intolerance, inflammation and hepatic insulin resistance independently of body weight and adiposity. These phenotypic differences were partially attributed to differences in gene expression, transcriptional factor activity (ie, peroxisome proliferator activator receptor-α, farnesoid X receptor (FXR), liver X receptors and STAT3) and bile acid profiles involved in glucose, lipid metabolism and inflammation. In addition to these alterations, the genetic deletion of MyD88 in hepatocytes changes the gut microbiota composition and their metabolomes, resembling those observed during diet-induced obesity. Finally, obese humans with NASH displayed a decreased expression of different cytochromes P450 involved in bioactive lipid synthesis.
Conclusions Our study identifies a new link between innate immunity and hepatic synthesis of bile acids and bioactive lipids. This dialogue appears to be involved in the susceptibility to alterations associated with obesity such as type 2 diabetes and NASH, both in mice and humans.
- DIABETES MELLITUS
- GLUCOSE METABOLISM
- LIPID METABOLISM
- INTESTINAL BACTERIA
- BILE ACID METABOLISM
This is an Open Access article distributed in accordance with the Creative Commons Attribution Non Commercial (CC BY-NC 4.0) license, which permits others to distribute, remix, adapt, build upon this work non-commercially, and license their derivative works on different terms, provided the original work is properly cited and the use is non-commercial. See: http://creativecommons.org/licenses/by-nc/4.0/
Statistics from Altmetric.com
Significance of this study
What is already known on this subject?
Toll-like receptors and myeloid differentiation primary-response gene 88 (MyD88) have been linked with several metabolic pathways.
Conflicting results exist regarding the role of innate immunity and more precisely MyD88 on host metabolism.
The liver is a key organ targeted by the microbiota and involved in the control of glucose and lipid metabolism.
What are the new findings?
The hepatocyte deletion of MyD88 predisposes to glucose intolerance, inflammation and hepatic insulin resistance independently of body weight and adiposity.
Hepatocyte Myd88 controls the synthesis of bioactive lipids involved in glucose, lipid metabolism and inflammation.
Hepatocyte Myd88 regulates the transcriptional activity of several genes involved in bile acid metabolism.
The hepatocyte deletion of MyD88 under normal diet induces changes of specific gut microbes, genes expression, plasma and liver metabolome that resemble those observed in diet-induced obese and diabetic mice.
Similar to what is seen in hepatocyte Myd88 deleted mice, human obese subjects developing non-alcoholic steatohepatitis (NASH) are characterised by a decreased expression of different cytochromes P450 involved in bioactive lipids synthesis.
How might it impact on clinical practice in the foreseeable future?
We identified novel mechanisms associating the hepatic innate immunity cell signalling through MyD88 and its implication in the onset of diabetes.
We propose a specific pattern of expression of different cytochromes and bioactive lipids in liver tissue of obese patients that may serve as a marker of susceptibility to develop NASH.
Our study takes a step towards the identification of bioactive lipids produced by the liver and metabolites linking immunity and metabolism.
Introduction
The innate immune system and metabolic pathways are functionally intertwined,1 ,2 making them attractive targets for treating obesity and related disorders (ie, diabetes, non-alcoholic fatty liver diseases (NAFL) and cardiometabolic diseases). Growing evidence suggests that the innate immune system acts as a metabolic sensor against nutritional stresses. Multiple innate immune receptors such as toll-like receptors (TLRs), nucleotide oligomerisation domain (NOD) and NOD-like receptor family members have been implicated in the recognition of metabolic stresses and in the onset of inflammatory responses, thereby contributing to the development of metabolic disorders.2 ,3 We and others have shown that low-grade inflammation and insulin resistance may be linked to gut microbiota and are dampened in the absence of specific TLRs.4–6 However, numerous conflicting results exist.7–10 For instance, data suggest that TLR-4 receptor signalling is not directly required for fatty acid-induced hepatic insulin resistance,10 while others show that liver-specific deletion of TLR-4 protects against diet-induced hepatic insulin resistance.11 ,12
Myeloid differentiation primary-response gene 88 (MyD88) is the key signalling adaptor for most TLRs (with the exception of TLR-3), interleukin-1 receptor (IL-1R) and IL-18 receptor. MyD88 has been shown to play a role in obesity and diabetes. Non-obese diabetic mutant mice, which are prone to the development of type 1 diabetes mellitus, are protected from the disease if MyD88 is ablated, and this protection may be transferred following gut microbiota transfer into germfree recipient mice.7 Deleting MyD88 in the central nervous system or intestinal epithelial cells protects against high-fat diet (HFD)-induced weight gain and glucose intolerance.13 ,14 In another context, the deletion of MyD88 has been shown to increase the risk of developing type 2 diabetes and hepatic steatosis under HFD feeding.15–17 Altogether, evidence strongly supports a role of MyD88 signalling in hepatic disturbances associated with obesity; however, the convergent molecular mechanisms and target tissues remain to be clarified.
To evaluate the specific role of hepatocyte MyD88 on metabolism, we generated a mouse model of hepatocyte-specific deletion of Myd88 gene. We next investigated the impact of the deletion under physiological (control diet (CT)) and pathological (HFD-induced obesity) conditions.
Materials and methods
Mice
Generation of Albumin-Myd88 KO mice
Hepatocyte-specific Myd88 deleted mice (liver-specific knockout mice (LKO)) were generated by crossing mice bearing the Cre recombinase expressed under the control of the Albumin promoter (Albumin-Cre) (C57BL/6 background, Jackson Laboratory, Bar Harbor, Maine, USA) with mice harbouring a loxP-flanked Myd88 allele (C57BL/6 background, Jackson Laboratory).
LKO experiments
Cohorts of 8-week-old LKO mice and wild-type (WT) littermates were housed in specific pathogen-free conditions in groups of two mice/cage (filter-top cages) with free access to food and autoclaved water. The WT and LKO mice were fed a CT (10% fat, AIN93Mi, Research Diet, New Brunswick, New Jersey, USA) (WT-CT or LKO-CT) or an HFD (60% fat, D12492i, Research Diet) (WT-HFD or LKO-HFD). Treatment continued for 8 weeks. This experiment was replicated independently three times. The control mice were WT littermates harbouring the Myd88 loxP-flanked allele but not the Cre recombinase. Body weight and food intake were recorded once a week. Body composition was assessed once a week using 7.5 MHz time-domain nuclear magnetic resonance (LF50 Minispec, Bruker, Rheinstetten, Germany).
Additional protocols and procedures are described in the online supplementary method section.
Supplemental material
Statistical analyses
The data are expressed as the mean±SEM. Differences between the groups were assessed using one-way analysis of variance (ANOVA), followed by Newman–Keuls post hoc tests after normalisation by log transformation. A two-way ANOVA analysis with a Bonferroni post test on repeated measurements was performed for the evolution of body weight, fat mass and glycaemia during the oral glucose tolerance test. The data were analysed using GraphPad Prism V.5.00 for Windows (GraphPad Software, San Diego, California, USA). Data with different superscript letters or symbols are significantly different at p<0.05 according to the post hoc ANOVA statistical analysis.
Accession numbers
The GEO accession number for the microarray data reported in this paper is GSE73489. The GEO accession number of the human microarray data set is GSE59045.
Results
Hepatocyte Myd88 deletion does not affect body weight and fat mass gain
To assess the role of hepatocyte MyD88 on metabolism, we generated mice with a conditional hepatocyte-specific deletion of Myd88 gene (LKO mice). We validated the deletion of Myd88 gene in the hepatocyte of LKO mice by quantifying both mRNA (decreased by 50%) and protein levels in the liver of WT and LKO mice (see online supplementary figure S1A, B).
We next assessed whether hepatocyte Myd88 deletion altered host metabolism and phenotype upon either a CT (WT-CT and LKO-CT groups) or an HFD (WT-HFD and LKO-HFD groups). We found that hepatocyte Myd88 deletion did not affect body weight throughout the 8 weeks of treatment compared with WT mice. Both WT and LKO mice gained similar weight during chronic treatment with HFD (figure 1A, C). Body composition analysis using NMR showed that LKO mice gained similar fat mass throughout the experiment as WT mice under either CT or HFD challenge (figure 1B, D). Liver weight and fat pads were not affected by the hepatic Myd88 deletion (figure 1E–H). Mean food intake was similar between groups (figure 1I).

Hepatocyte myeloid differentiation primary-response gene 88 (Myd88) deletion does not affect body weight and fat mass development. (A) Body weight evolution (g). (B) Fat mass evolution (g) measured by time-domain nuclear magnetic resonance (TD-NMR). (C) Total body weight gain (g). (D) Total fat mass gain (g) measured by TD-NMR. (E) Liver weight (mg). (F) Subcutaneous adipose tissue (SAT) weight (mg). (G) Epididymal adipose tissue (EAT) weight (mg). (H) Visceral adipose tissue (VAT) weight. (I) Food intake (g/day/mouse). (J) Total physical activity measured in metabolic chambers (total beam breaks counts). (K) Respiratory exchange ratio (VCO2/VO2). These data (A–H) correspond to the results of at least three independent experiments (n=25–36), (I) (n=10/groups), (J and K) (n=4–6 per groups). Data are presented as mean±SEM. *Significant differences (p<0.05) between high-fat diet (HFD)-treated groups versus control diet (CT)-treated mice. Data with different superscript letters or symbols are significantly different (p<0.05) according to post hoc one-way analysis of variance. LKO, liver-specific knockout mice; WT, wild type.
By using metabolic chambers, we analysed the total physical activity level and the respiratory exchange ratio. We did not find any differences between groups when comparing total physical activity (figure 1J). However, LKO mice under a CT were characterised by a lower respiratory exchange ratio similar to mice fed an HFD, showing the use of fatty acids as preferential energy substrate as found during HFD feeding, thereby suggesting a reduced oxidation of glucose substrates (figure 1K).
Altered glucose metabolism in LKO mice
We next assessed whole-body glucose metabolism and found that hepatocyte Myd88 deletion did not affect oral glucose tolerance under CT, whereas LKO-HFD mice exhibited impaired glucose tolerance compared with WT-HFD mice (figure 2A, B). As expected, HFD feeding significantly increased plasma insulin levels area under the curves after the oral glucose load (figure 2C). Although the glucose profile was not affected in LKO-CT, these mice produced significantly more insulin in response to oral glucose administration to maintain a normal glycaemia, suggesting an insulin resistance state (figure 2C). Under HFD treatment, LKO-HFD mice increased insulin secretion by about 60% compared with WT-HFD mice. These results were supported by an impaired insulin resistance index, with LKO-HFD mice displaying a 70% increase compared with WT-HFD mice (figure 2D). We next assessed insulin tolerance by using an insulin tolerance test. This parameter was moderately but non-significantly affected in LKO-HFD (figure 2E). Insulin resistance index is considered as a surrogate of hepatic insulin resistance.18 In accordance with this assumption, we found a lower hepatic glycogen content (whose synthesis and degradation is controlled by insulin19) in LKO-CT, WT-HFD and LKO-HFD mice compared with WT-CT mice (figure 2F).

Hepatocyte myeloid differentiation primary-response gene 88 (Myd88) deletion alters glucose tolerance, whole-body lipid metabolism and promotes insulin resistance. (A) Plasma glucose (mg/dL) profile after 2 g/kg glucose oral challenge in freely moving mice and (B) the mean area under the curve (AUC) measured between 0 and 120 min after glucose loading. (C) AUC plasma insulin of measured between –30 and 15 min after glucose loading. (D) Insulin resistance index determined by multiplying the AUC of blood glucose by the AUC of insulin. (E) Plasma glucose profile after intraperitoneal insulin injection (0.75 U/kg) in freely moving mice (n=9–10). (F) Liver glycogen (µg of glucose from glycogen/mg of liver) content measured in fasted mice. (G) Total and phosphorylated Akt levels in the liver of mice after intraportal insulin injection and (H) % of phosphorylation of Akt protein (n=3). (I) Visceral adipose tissue CD11c mRNA expression. These data (A–D, F and I) correspond to the results of at least three independent experiments (n=25–36). Data are presented as mean±SEM. Data with different superscript letters or symbols are significantly different (p<0.05) according to post hoc one-way analysis of variance. CT, control diet; HFD, high-fat diet; LKO, liver-specific knockout mice; WT, wild type.
To explore whether LKO mice develop insulin resistance in the liver, we analysed insulin-induced phosphorylation of Akt (p-Akt). We found that phosphorylation of Akt after insulin stimulation was reduced in the liver of LKO-CT mice; this effect was significantly more pronounced in LKO-HFD mice (figure 2G, H). Visceral fat inflammation is associated with a lower glucose tolerance and an increased hepatic insulin resistance.20 Here, we found that LKO mice displayed a significantly increased (about 65%) mRNA expression of the cluster of differentiation 11c (CD11c) subpopulation of macrophages in visceral adipose tissue, which is the primary population of adipose tissue macrophages in obesity and insulin resistance (figure 2I).21 ,22 This parameter was increased by 2.3-fold in WT-HFD and even more so 3.5-fold in LKO-HFD mice (figure 2I).
Hepatic function and lipid content in LKO mice
We next assessed whether hepatic Myd88 deletion had an influence on transaminase levels reflective of liver inflammation. We found that plasma alanine aminotransferase (ALT) levels were mostly increased in HFD-treated mice, whereas aspartate aminotransferase (AST) levels were increased by about 30% in LKO-CT mice and HFD-fed mice but did not reach significance (figure 3A, B). We found that liver lipid content is significantly changed upon HFD feeding with a 50% increase in WT-HFD and 65% increase in LKO-HFD hepatic triglycerides content (figure 3C). These results were further confirmed by using histological analyses and steatosis score (figure 3D, E). Inflammatory score was significantly increased following HFD feeding but not affected by the Myd88 deletion (figure 3F). Fibrosis score was similar between groups (figure 3G).

Hepatocyte myeloid differentiation primary-response gene 88 (Myd88) deletion and hepatic parameters. (A) Plasma ALT activity. (B) Plasma AST activity. (C) Hepatic triglycerides (nmol/mg of protein) (n=20–27). (D) Representative histological liver oil red O staining, scale bar=100 µm. (E) Hepatic steatosis score (arbitrary units). (F) Inflammation score (arbitrary units). (G) Fibrosis score (% of area). Data are presented as mean±SEM. These data (A–C) correspond to the results of at least three independent experiments (n=23–38), scores obtained in (E) and (F) have been obtained following the analysis of at least five fields per animal (n=8–11 per groups) and by three independent blinded investigators. Data with different superscript letters or symbols are significantly different (p<0.05) according to post hoc one-way analysis of variance. CT, control diet; HFD, high-fat diet; LKO, liver-specific knockout mice; WT, wild type.
Gene expression profile in the liver of LKO mice
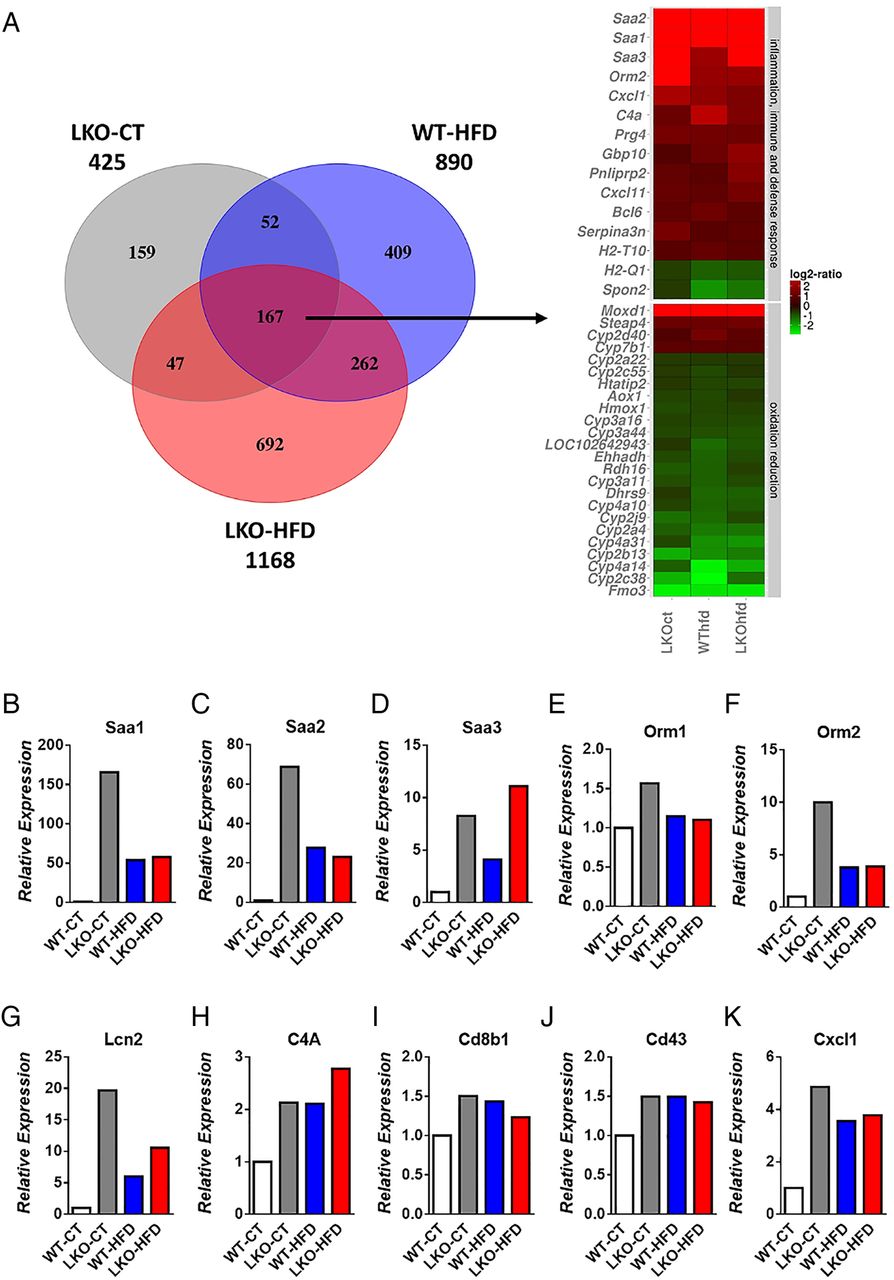
To understand the mechanisms involved in the development of hepatic steatosis and insulin resistance, we performed a global gene expression analysis by using microarrays. These microarrays revealed the increased expression of a large number of genes involved in acute phase response and inflammatory pathways, lipid metabolism and the decreased expression of numerous genes related to cytochrome P450-mediated oxidation and reduction (figure 4A). The significance of these pathways was obtained by analysing gene ontology using the bioinformatics tools DAVID and TFactS23–25 (Document S1 DAVID and online supplementary figure S2). Figure 4A represents genes that were downregulated or upregulated 1.5-fold in LKO-CT, LKO-HFD and WT-HFD mice versus WT-CT mice. Heat maps of selected genes similarly affected between different conditions were used to compare the expression of the same genes in the three conditions matched with the WT-CT group. We found that numerous important pathways were modified following hepatic Myd88 deletion under both CT and HFD treatment (figure 4A). We discovered that 425 genes were significantly affected in LKO-CT mice, whereas HFD feeding induces the modification of 890 genes and 1168 genes significantly modified in LKO-HFD compared with WT-CT mice (figure 4A). Among these changes, 167 genes were significantly and similarly affected in the three conditions LKO-CT, WT-HFD and LKO-HFD (see figure 4A and online supplementary table S1). Several genes involved in inflammation and acute phase response such as Saa1, Saa2, Saa3, Orm1 and Orm2 were significantly and strongly induced in LKO-CT compared with WT-CT mice, and even at a higher level than in the HFD-fed mice (figure 4B–F). Lcn2, a gene involved in innate immunity, was significantly increased in hepatocyte MyD88 deleted mice under both CT and HFD conditions (figure 4G). Genes involved in immunity and defence such as Cd43, C4A, Cd8b1 and Cxcl1 were significantly increased in LKO-CT, WT-HFD and LKO-HFD mice compared with WT-CT (figure 4H–K).

Hepatocyte myeloid differentiation primary-response gene 88 (Myd88) deletion changes gene profile and transcriptional activity in the liver. (A) Heat map from microarray analysis and transcriptional factors representing selected genes involved in inflammation, innate immunity, host defence, oxidation and reduction pathways. This list contains the list of genes significantly downregulated or upregulated 1.5-fold in liver-specific knockout (LKO)-control diet (CT), wild type (WT)-high-fat diet (HFD), LKO-HFD mice versus WT-CT mice (p<0.05). Expression of markers involved in acute phase response (B) Saa1, (C) Saa2, (D) Saa3, (E) Orm1 and (F) Orm2; genes involved in innate immunity and defence (G) Lcn2, (H) C4A, (I) Cd8b1, (J) Cd43, (K) Cxcl1 measured by microarrays.
Supplementary table 1
Surprisingly, numerous genes involved in oxidation and reduction (ie, cytochrome P450) pathways were decreased in LKO-CT mice and the HFD-treated groups (figure 4A). Among these genes, decreased both by hepatocyte MyD88 deletion and HFD, we found several cytochromes involved in long-chain fatty acid metabolism and, more specifically, in the synthesis of epoxyeicosatrienoic acids (EETs), hydroxyepoxyeicosatrienoic (HETEs) and dihydroxyepoxyeicosatrienoic (DHETs) acids family.26 These lipids have been shown to regulate glucose, lipid and inflammatory processes. For instance, EETs, HETEs and DHETs reduce liver lipids and inflammation,27 they act as insulin sensitisers,29 anti-inflammatory molecules30 and reduce metabolic syndrome markers.31 Strikingly, EETs are also reported as peroxisome proliferator activator receptor-α (PPAR-α) agonists.32 ,33 Liver transcription factor PPAR-α activation has been shown to modulate numerous pathways such as lipid metabolism (eg, fatty acid synthesis, fatty acid oxidation, bile acid synthesis). By using TFactS analyses, we found that LKO mice exhibited a strong and significant inhibition of PPAR-α, NR1H3 and NR1H2 (liver X receptors (LXR)α and LXRβ, respectively) (p<0.0005), whereas STAT3 was significantly activated (p=0.01) (see online supplementary figure S2). The inhibition of PPAR-α is in line with the phenotype observed, which is an increased inflammation, hepatic steatosis and altered insulin sensitivity. Interestingly, the downregulation of fibroblast growth factor 21 (Fgf21) has been associated with the activation of STAT3, which induces higher hepatic glucose production and glycogenolysis.34 Here, we found that Fgf21 expression was decreased by 50% in LKO mice and 80% in both WT-HFD and LKO-HFD mice, thereby leading to STAT3 activation and lower glycogen content in these three groups (figure 5A). The downregulation of LXR may also contribute to change in immunity, bile acids, glucose and lipid metabolism.35
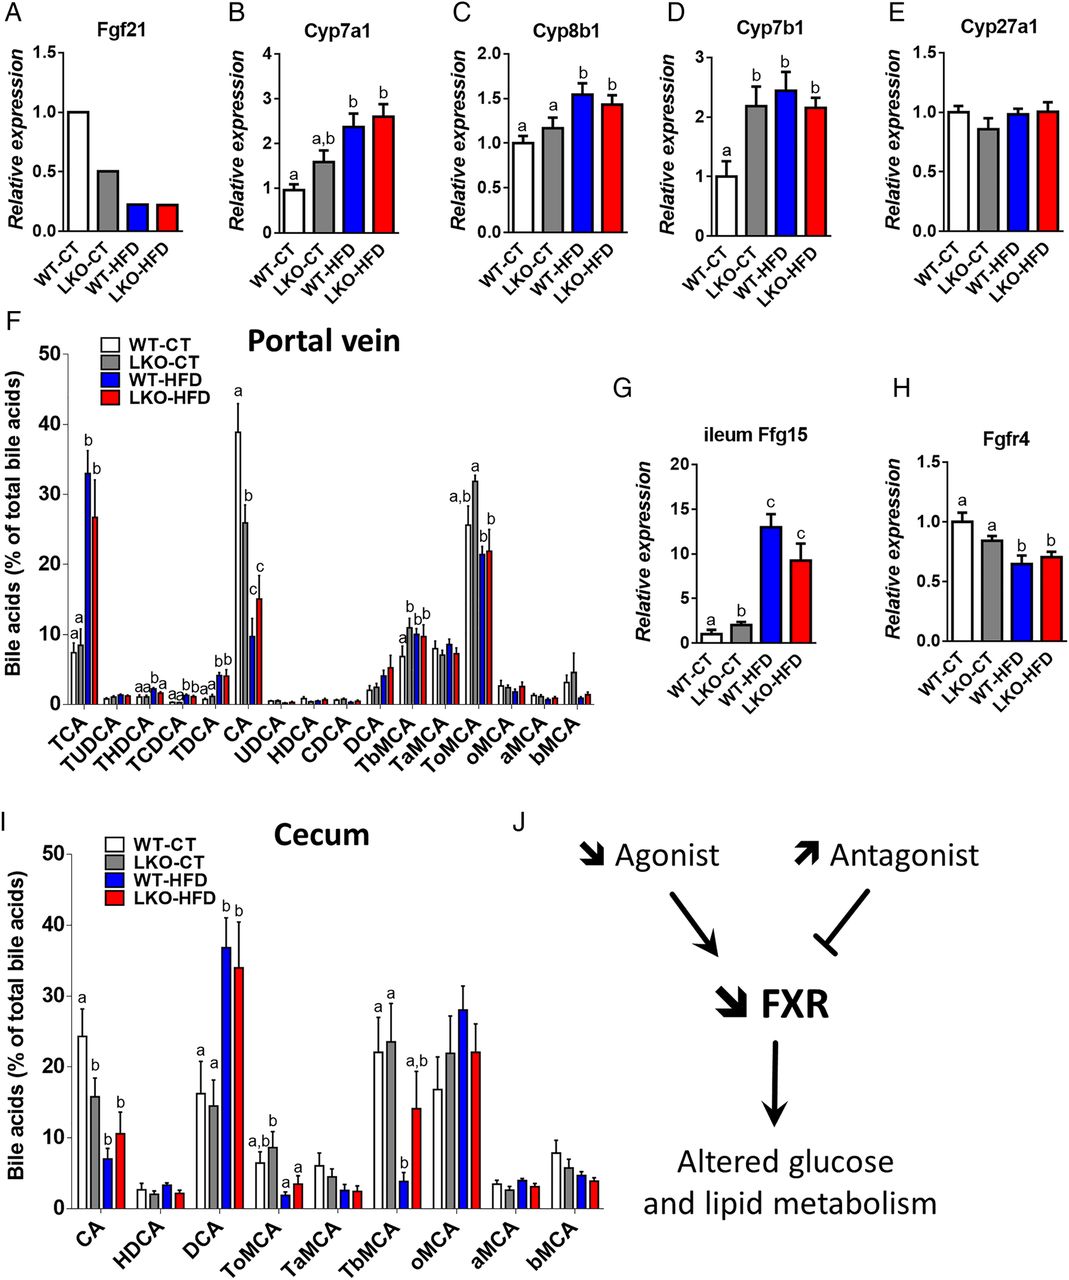
Hepatocyte myeloid differentiation primary-response gene 88 (Myd88) deletion increases mRNA expression of genes involved in bile acid synthesis and signalling and affects plasma bile acid profile. (A) Fgf21 expression issued from the microarray analysis, (B) Cyp7a1 mRNA, (C) Cyp8b1 mRNA, (D) Cyp7b1 mRNA and (E) Cyp27a1 mRNA levels measured by qPCR in the liver of wild type (WT)-control diet (CT), liver-specific knockout (LKO)-CT, WT-high-fat diet (HFD) and LKO-HFD mice. These data correspond to the results of at least two independent experiments (n=12–20). Data are presented as mean±SEM. Data with different superscript letters are significantly different (p<0.05) according to post hoc one-way analysis of variance (ANOVA). (F) Plasma bile acids content (% of total bile acids), TCA, TUDCA, THDCA, TCDCA, TDCA, CA, UDCA, HDCA, CDCA, DCA, TbMCA, TaMCA, ToMCA, oMCA, aMCA, bMCA. Data are presented as mean±SEM (n=9–10). (G) Fgf15 mRNA in the ileum (n=12) and (H) Fgfr4 mRNA (n=10–20) in the liver of WT-CT, LKO-CT, WT-HFD and LKO-HFD. (I) Caecum bile acids content (% of total bile acids). Data are presented as mean±SEM (n=9–10). (J) Graphical summary: impact of a decreased abundance of FXR agonist and an increased abundance of FXR antagonist, leading to a decreased FXR activity and altered glucose, lipid metabolism. Data with different superscript letters are significantly different (p<0.05) according to post hoc one-way ANOVA. CA, cholic acid; CDCA, chenodeoxycholic acid; DCA, deoxycholic acid; HDCA, hyodeoxycholic acid; LCA, lithocholic acid; MCA, muricholic acid; T, taurine; UDCA, ursodeoxycholic acid. a, alpha; b, beta; o, omega conjugated species.
Changes in bile acid metabolism and profile in LKO mice
Among the cytochromes affected by the hepatocyte Myd88 deletion, we found that mRNA levels of Cyp7a1, Cyp8b1 and Cyp7b1, key cytochromes involved in bile acids synthesis, were increased in LKO-CT, WT-HFD and LKO-HFD mice (figure 5B–D). The expression of Cyp27a1, which is mostly involved in the alternative pathway of bile acid synthesis, was not affected (figure 5E). Fgf15 is produced in the ileum and signals through Fgfr4 in hepatocytes to inhibit expression of the major cytochromes involved in bile acid synthesis.36 Strikingly, we found that the expression of Fgf15 in the ileum was doubled in LKO-CT mice compared with WT-CT and increased by about 10-fold to 12-fold under HFD feeding (figure 5G), whereas WT-HFD and LKO-HFD mice exhibited a significantly lower mRNA expression of Fgfr4 (figure 5H), thereby suggesting the existence of an altered negative feedback loop of bile acid synthesis from the gut to the hepatocytes.
Several markers of bile acid metabolism pointed towards a putative modulation of the bile acid profile. Therefore, we quantified more than 20 different bile acids in the portal vein and in the caecum (see figure 5F, I and online supplementary figure S3). We found that HFD feeding affected both primary and secondary bile acids such as CA, TbMCA, TCA, THDCA, TCDCA and TDCA, whereas others were unaffected (see figure 5F, I and online supplementary figure S3). Interestingly, hepatic Myd88 deletion mimicked HFD feeding with the major bile acid CA significantly decreased in the plasma and the caecum of both LKO-CT and WT-HFD mice compared with WT-CT mice (figure 5F, I). Conversely, in the plasma, TbMCA levels were significantly increased in LKO-CT reaching the same levels as those observed in HFD-fed mice (figure 5F). We next measured markers of bile acid metabolism in the liver and in the intestine. More precisely, we quantified factors involved in bile acid conjugation (Bal, Bat, Hnf4a1) (figure 6A), in the export of bile acids from the liver (Abcb11, Abcb4, Ostb) (figure 6B) and in the reabsorption of bile acids (Ntcp, Otap1b2) (figure 6C). In addition, we measured markers of bile acid reabsorption in the ileum (Osta, Ostb, Ibabp, Asbt) (figure 6D). Most of these markers were not affected by the absence of MyD88 and tend to be affected by the dietary treatment (ie, Bal, Osta and Ibabp).

Markers of bile acids metabolism in the liver and in the ileum. (A) Bile acids conjugation (Bal, Bat and Hnf4a1 mRNA). (B) Bile acids export (Abcb11, Abcb4, Ostb) mRNA. (C) Bile acids reabsorption (Ntcp and Otap1b2) mRNA in the liver of wild type (WT)-control diet (CT), liver-specific knockout (LKO)-CT, WT-high-fat diet (HFD) and LKO-HFD mice. (D) Bile acids reabsorption (Osta, Ostb, Ibabp, Asbt) mRNA in the ileum of WT-CT, LKO-CT, WT-HFD and LKO-HFD mice (n=10–12). Data are presented as mean±SEM. Data with different superscript letters are significantly different (p<0.05) according to post hoc one-way analysis of variance.
Importantly, CA and TbMCA are known to regulate FXR activity.37 ,38 Thus, these results strongly suggest that the decrease in the main agonist CA and the increase in the antagonist TbMCA in LKO mice reduce the activity of FXR (figure 5J), thereby contributing to the observed changes on both glucose and lipid metabolism. In accordance with this hypothesis, we found that expression flavin mono oxygenase 3, a gene regulated by FXR,39 was the most reduced in LKO-CT, WT-HFD and LKO-HFD mice (figure 4A), further supporting a link between the gene profile, FXR and bile acid metabolism.
Deletion of hepatocyte Myd88 affects specific gut bacteria
Bile acids, HFD feeding and FXR have been associated with changes in gut barrier functions, insulin resistance and gut microbes.40–43 In the present study, we investigated different markers of gut barrier function in the jejunum and in the ileum. We found that the expression of the antimicrobial peptide RegIIIγ (regenerating islet-derived 3 gamma, encoded by Reg3g) was strongly decreased in WT-HFD and even more in LKO-HFD in the jejunum and to a lower extent in the ileum (see online supplementary figure S4A, C). The other markers of tight-junction proteins (claudin 1 and 3, zonula occludens 1 and occludin) were weakly affected (see online supplementary figure S4B, D).
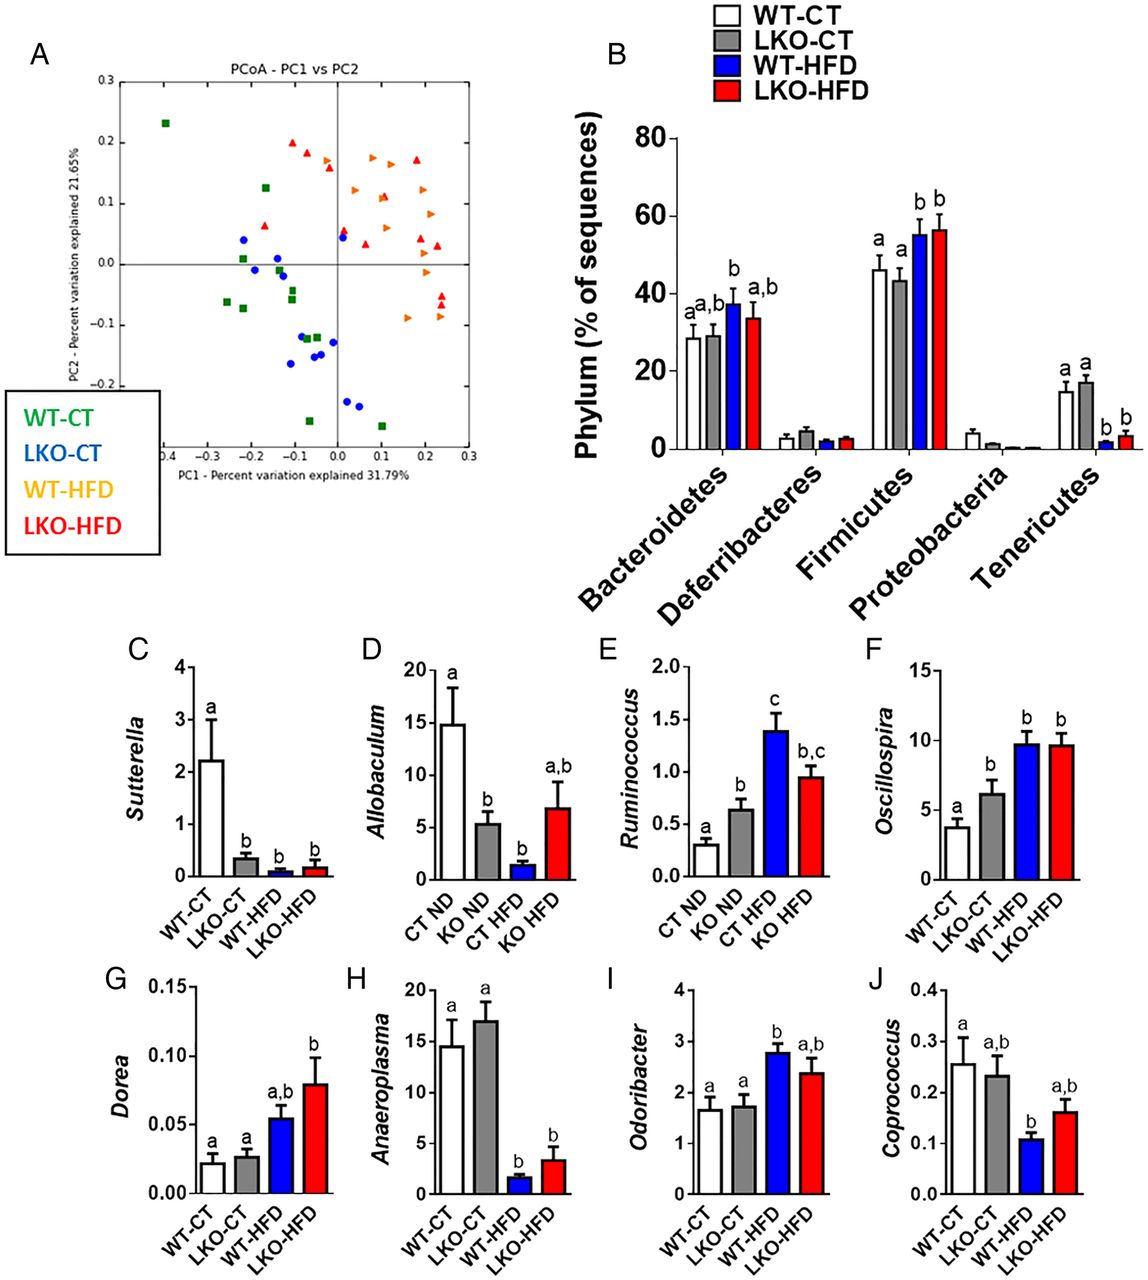
Bile acids are metabolised by different microbes. Because we found a clear change in the bile acid profile upon both genetic deletion of Myd88 and HFD feeding, we investigated whether this observation might be associated with changes in gut microbiota composition. Consistent with previous studies,5 ,14 ,44 ,45 HFD feeding significantly changed gut microbiota composition compared with WT-CT mice (see figure 7A, B and online supplementary table S2). The deletion of Myd88 did not significantly affect the major phyla (figure 7B) nor the number of operational taxonomic units (OTUs) (see online supplementary figure S5A). A total of 43 881 OTUs were identified by the QIIME pipeline, represented by at least one sequence in one sample. Samples were then grouped by treatment, and the median number of sequences in each group was calculated for each OTU. In total, 1852 OTUs have a median abundance superior to 0 in at least one treatment group, with 191 OTUs accounting for 90% of the sequences. In total, 1113 OTUs have a median abundance superior to 0 in either the LKO-CT or WT-CT groups, and 751 in both groups. Also, 172 OTUs had a cumulated median of abundance in both LKO-CT and WT-CT groups superior to 10, representing 89.26% of the total sequences. These OTUs are represented in online supplementary figure S5B as the core microbiome of the control treatment group. The OTUs are divided into five phyla: Firmicutes, Bacteroides, Proteobacteria, Tenericutes and Deferribacteres. The core microbiome of the mice in the experiment is actually represented by a relatively limited number of OTUs: <10% of the OTUs with a median abundance superior to 0 account for almost 90% of the total number of sequences. The phylotype richness estimated according to the bias-corrected Chao1 were similar between groups (see online supplementary figure S5BC), whereas Shannon diversity index was increased in treated groups (see online supplementary figure S5D).

Hepatocyte myeloid differentiation primary-response gene 88 (Myd88) deletion changes gut microbiota composition. (A) PCoA based on the unweighted UniFrac analysis on operational taxonomic units (OTUs) (n=12). Each symbol representing a single sample is coloured according to the group. (B) Composition of abundant bacterial phyla identified in the gut microbiota (n=12). (C–J) Relative abundances (percentage of 16S rRNA sequences) of the various bacterial genera in each sample among each group of mice. Data are presented as mean±SEM (n=9–10). Data with different superscript letters are significantly different (p<0.05) according to post hoc one-way analysis of variance. See also online supplementary tables S2 and S3. CT, control diet; HFD, high-fat diet; LKO, liver-specific knockout mice; WT, wild type.
Supplementary table 2
At a lower taxonomic level, we found that the abundance of Sutterella and Allobaculum was strongly and significantly decreased in LKO-CT and, to a similar extent, as observed during HFD feeding (see online supplementary table S3 and figure 7C, D). We also established that Ruminococcus and Oscillospira were significantly augmented in LKO-CT (about 60–100% increase) compared with WT-CT mice, whereas HFD feeding further increased these two genera (figure 7E–F). Other genera such as Dorea, Anaeroplasma, Odoribacter and Coprococcus were mainly affected by the HFD treatment (figure 7G–J). Among the 16 genera that were significantly modified under HFD, 4 of them were also similarly affected in LKO-CT mice (ie, Sutterella, Allobaculum, Ruminococcus and Oscillospira). Therefore, these observations are in line with the different metabolic markers and bile acid profile showing that LKO-CT mice exhibited a phenotype, which is close to HFD-fed mice.
Supplementary table 3
Deletion of hepatocyte Myd88 affects serum and liver metabolome
In addition to the impact of gut microbes and bile acids on metabolism, evidence suggests that numerous microbial metabolites may contribute to host metabolism.46 ,47 1H NMR spectroscopy was carried out on liver and portal vein blood. Metabolite assignments were based on previously published data.48 ,49
A total of 45 metabolites in liver and 33 metabolites in blood serum that originate from protein, amino acids, lipids, carbohydrate and microbial metabolism were identified (see online supplementary table S4, S5). HFD-fed mice exhibited higher levels of fatty acids both in liver and in serum, lower levels of albumin and higher levels of isoleucine in serum and lower levels of glycogen and creatine phosphate in liver. The numbers of N-acetyl groups of protein glycans (NAC2) in liver were also increased under HFD treatment. Interestingly, the deletion of Myd88 produced more metabolomic differences in liver than in serum and under CT than under HFD. The liver of LKO animals contained lower levels of acetoacetate but higher levels of glutamate and arginine. LKO animals under CT showed unique liver metabolomic features that are not present in LKO-HFD animals, including changes in cholesterol, total visible fatty acids, alanine, citrate, creatinine, choline, trimethylamine N-oxide (TMAO), taurine, proline, glycine, total glutathione and tyrosine. Similarly, these animals exhibited marked lower levels of branched chain amino acids (isoleucine, leucine and valine) and methylamines.
Supplementary table 4
Supplementary table 5
Supplementary table 6
We performed chemometric analysis on the data for better understanding of the metabolic similarities between groups. As expected, the major modulator of host metabolism is the type of diet (figure 8A, B). Similarly to what we observed in the individual metabolic levels, the genetic deletion has a minor impact in serum metabolome and a moderate impact in liver metabolome. As found for the gut microbiota composition, the genetic deletion causes the liver metabolomes of CT diet to resemble those of HFD-fed mice. To further explore the metabolomic relationships between genetic deletion and diet, we built separated PLS-DA models for the discrimination of LKO versus WT under CT or HFD treatment.

Hepatocyte myeloid differentiation primary-response gene 88 (Myd88) deletion changes the metabolomic profile of the serum and the liver. PCoA based on the nuclear magnetic resonance (NMR) metabolomic profile of serum (A) and liver tissue (B). Each symbol represents a single sample coloured according to the group. See also online supplementary tables S4 and S5. NMR integrals for metabolic regions most significant relative to the wild type (WT)-control diet (CT) average. (C) Cholesterol in serum. (D) Cholesterol in liver. (E) Arachidonic acid in liver. (F) Linoleic acid in liver. (G) Isoleucine in serum. (H) Trimethylamines in serum. (I) Trimethylamine oxide (TMAO) in liver. (J) Total glutathione in liver. (K) N-Acetyl groups of protein glycans in liver. (L) l-Arginine in the liver. HFD, high-fat diet; LKO, liver-specific knockout mice.
PLS-DA score plots show a stronger separation between LKO and WT in the liver under both CT and HFD treatment than in the serum (scores plots in online supplementary figure S6). We also found that the number of discriminant metabolites was higher in the liver than in the serum (VIP scores in online supplementary figure S6). The quality of our models was validated by evaluation with coefficient of variation and permutation tests for the models (see quality parameters in legend of online supplementary figure S6). In accordance with metabolic parameters and microarrays, several markers such as cholesterol, long-chain fatty acids, branched chain amino acids (leucine, isoleucine and valine), markers of oxidation and reduction contribute to discrimination between groups (see figure 8C–L, online supplementary figure S6 and tables S4, S5). The metabolites discriminating genetic deletion in CT diet were different and more numerous than those in HFD (VIP scores in online supplementary figure S6). HFD groups overlapped with LKO samples when projected onto the CT treatment model scores plots (see online supplementary figure S6A, S6B). Conversely, CT groups overlapped with WT when projected onto the HFD liver model scores plot (see online supplementary figure S6E) but overlapped with the LKO when projected onto the HFD serum model (see online supplementary figure S6G).
Changes in molecular pathways between obese and non-alcoholic steatohepatitis patients
To further investigate whether specific observations made in rodents were reliable in humans, we compared the expression pattern of genes in the liver of obese humans undergoing bariatric surgery, which were comparable with regard to body mass index and age but stratified based on the severity of liver disease into NAFLD and non-alcoholic steatohepatitis (NASH).22 We found consistent results compared with what was observed in our rodent model. To understand the differences in molecular processes in the liver, we introduced the differentially expressed genes, identified from the microarray into the STRING program.50 This program weights and integrates information from numerous sources, including experimental repositories, computational prediction methods and public text collections, thus acting as a metadatabase that maps all interaction evidence onto a common set of genomes and proteins. In addition to a graphic representation of the predicted interactions, the program generates a list of the most relevant gene-to-gene interactions. The complexity of the interactions can be visualised where a blue line represents a reported relationship between the two genes and the thickness of the line represents the confidence (more literature results show a thicker line). The results are shown in online supplementary figure S7. The 10 most significant Kyoto Encyclopedia of Genes and Genomes (KEGG) pathways and 10 most significant biological processes as computed by this program are shown in online supplementary table S7. Important to note is that most of the observations made in the MyD88 model are also seen in patients. The most significant pathways and the biological processes are located in the right and top sections of the figure.
Supplementary table 7
Discussion
In the present study, we demonstrate that hepatocyte Myd88 deletion induces profound changes in glucose and lipid metabolism. Among the mechanisms, we found that hepatocyte Myd88 deletion modifies transcriptomic profile of genes involved in both inflammation and metabolic pathways. These modifications were associated with an altered bile acid profile and pointed towards modifications of several bioactive lipids and transcriptional factors involved in both glucose and lipid metabolism (ie, PPAR-α, FXR, LXR and STAT3). In addition to these alterations, mice display an altered gut microbiota composition and metabolomic profile. We found that this phenotype already occurred under normal chow diet, suggesting an HFD-like metabolic phenotype, since only a few other parameters were worsened under HFD. Strikingly, the absence of hepatic MyD88 did not alter diet-induced body weight gain and fat mass development. This surprising finding is not in accordance with several other studies, suggesting that mice lacking MyD88 in the brain or in the gut are protected against both diet-induced obesity and insulin resistance.11–14 Therefore, our data strongly suggest that MyD88 differentially contributes to the regulation of energy and glucose homeostasis depending on the targeted organ. This also partially explains the quantity of conflicting data existing when investigating whole-body Myd88 deletion and its impact of obesity and related disorders.15–17
We showed that LKO mice had a normal glucose tolerance on CT diet. However, in this dietary condition, LKO mice already exhibited significantly lower hepatic glycogen content and a higher insulin secretion after oral glucose stimulation. They had a trend to a lower insulin-induced phosphorylation of Akt, and higher liver lipid content and a higher visceral adipose tissue inflammation, suggesting that LKO mice develop an early hepatic insulin resistance and have an altered metabolism. In accordance with this hypothesis, we discovered that LKO mice develop marked visceral adipose tissue inflammation, glucose intolerance and insulin resistance during HFD feeding. To better explain the phenotype observed in hepatic Myd88 deleted mice, we performed a transcriptional analysis of the liver by microarrays. These revealed that several genes were significantly different between LKO-CT and WT-CT mice, and that these genes were similarly upregulated or downregulated in HFD-CT and HFD-LKO mice, corroborating the fact that lacking hepatocyte Myd88 triggers an HFD-like phenotype in this set of mice. Although these data have been obtained by using a microarray approach using one set of mice, we have confirmed most of the variations of gene expression by using quantitative PCR in the same set of mice. More importantly, we found similar data by using two other sets of independent experiments, thereby reinforcing the results observed with the microarray. Hepatic insulin resistance has been widely associated with higher inflammatory tone.2 ,5 ,51 ,52 In this study, we found that several genes involved in acute phase response, innate immunity and defence were significantly increased in mice lacking hepatocyte MyD88, and this was observed under both normal diet and HFD conditions. Surprisingly, numerous cytochrome P450 implicated in the metabolism of long-chain fatty acids were downregulated, with the exception of cytochromes involved in the biosynthesis of bile acids (see figure 4 and online supplementary data). These genes are involved in the synthesis of bioactive lipids that belong to the arachidonic and linoleic acid metabolism, which are EETs, HETEs and DHETs. These lipids have been associated with both glucose metabolism and lipid metabolism. They have also been shown to reduce hepatic steatosis and inflammation27 ,28 ,30 ,53 and were proposed as insulin sensitisers.29 ,31 Therefore, our data demonstrate a putative novel molecular link between the innate immune system and synthesis of bioactive lipids that contributes to regulate inflammation, glucose and lipid metabolism.
TFactS analysis revealed a strong and significant inhibition of PPAR-α and LXRs in mice lacking hepatocyte MyD88 gene. This observation is in line with the role of PPAR-α in controlling various pathways of fatty acid synthesis, oxidation and bile acid production. Interestingly, EETs, which are potentially decreased in LKO mice, are known PPAR-α agonists.30 ,53 The increased inflammation, hepatic steatosis and altered insulin sensitivity observed in our model are in accordance with the inhibition of PPAR-α and the observed phenotype. The potential downregulation of LXR may also contribute to the modulation of immunity, bile acids, glucose and lipid metabolism. In accordance with the transcriptional analyses, we found that hepatocyte Myd88 deletion profoundly changes several bile acids levels. Among these, two well-described bile acids controlling FXR activity were modified, that is, CA and TbMCA. The FXR agonist CA was decreased, whereas the FXR antagonist TbMCA was increased in LKO and HFD-fed mice. This important finding suggests that FXR activity is decreased in LKO mice and therefore validates the link with the phenotype observed on glucose, lipid metabolism and inflammation (figure 5F, I, J).38 ,54 Among the different bile acids, we found that primary bile acids were mostly affected by the genetic deletion (CA and TbMCA), whereas specific secondary bile acids such as deoxycholic acid and lithocholic acid were increased by the dietary intervention in the portal vein blood and in the caecal content, thereby reflecting a putative implication of gut microbes. Our data pointed towards an impaired FXR signalling in the liver (figure 5J) since we found an apparent decrease in abundance of a major FXR agonist and a significant increase of a FXR antagonist, CA and TbMCA, respectively. Haeusler et al55 noted that a relative deficiency of CA in mice contributes to a diabetic lipid phenotype through impaired FXR signalling.
Importantly, we have been able to translate some of our data observed in mice into human-relevant observations. In addition to the different pathways depicted in online supplementary figure S7 and table S7A, B, we found more specifically that markers were discriminant between NASH versus non-NASH patients. Cyp4z1, Cyp1b1, Cyp4a22 and Cyp2c19 were significantly decreased in patients with NASH. All these CYP450 are involved in the synthesis of bioactive lipids that belong to the EETs, HETEs and DHETs family.56–58 Thus, our human results suggest that increased inflammatory markers (eg, Saa1, Saa2, Cxcl1) characterising patients with NASH are independent of the obesity status and are also associated with a putative defect in the production of anti-inflammatory lipids. Strikingly, Saa1/2 and Cxcl1 are also markers that are highly expressed in LKO mice and in HFD-fed mice.
However, whether a specific MyD88-dependent mechanism is involved in the phenotype observed in humans warrants further investigation. Nevertheless, data from the literature have shown that TLR5 polymorphism protects from obesity but predisposes to diabetes.59 In addition, TLR4 and IRF3 expression (MyD88 pathway) appear to be upregulated in the liver of patients suffering from NASH versus NAFLD, which is associated with increased lipopolysaccharides (LPS) and fatty acid levels.60
In accordance with the bile acid profile, we found that specific bacterial genera were different between LKO and WT mice during normal chow diet. Sutterella and Allobaculum were decreased in LKO-CT mice and HFD-fed mice. It is worth noting that Allobaculum is abundant and represents around 20% of the taxa found in CT mice. More importantly, most of the previous studies have demonstrated that HFD feeding reduces the presence of these taxa, whereas dietary interventions that improve host metabolism (ie, insulin sensitivity, inflammation) such as prebiotics or berberine, increase the abundance of Sutterella and Allobaculum.14 ,45 ,61 ,62 Le Roy et al have also shown that Allobaculum was higher in mice that resist to HFD-induced metabolic disorders.63 Conversely, the abundance of two other genera (Ruminococcus and Oscillospira) was doubled in hepatocyte MyD88 deleted mice, and even more increased upon HFD feeding. Interestingly, prebiotic treatment that improves host metabolism upon HFD feeding decreases both Ruminococcus and Oscillospira in diet-induced obese mice.61 The other major modifications of the gut microbiota were mainly due to the dietary intervention. In addition, consistent with our previous studies,61 ,64 we found that altered metabolism and liver function observed during HFD feeding were associated with a reduced expression of Reg3g in both the jejunum and the ileum. However, other markers of gut barrier function were only mildly affected (Supplementary figure 3B, D).
Metabolomic analysis of both blood and liver compartment shows that LKO mice segregate from WT-CT mice, both by chemometrics and by the amount of the metabolites. However, the LKO mice exhibited major metabolomic changes under CT treatment and very small differences under HFD treatment. Most of the changes induced by LKO in CT mice were very similar to those induced by an HFD treatment. Interestingly, among the metabolites, several discriminant markers have been previously associated with diabetes and hepatic steatosis. Long-chain fatty acids, branched chain amino acids (leucine, isoleucine and valine), markers of oxidation and reduction (taurine, carnosine and total glutathione) were discriminant between groups. Previous data have shown an association between branched amino acids profile, but also several other metabolites, and the onset of insulin resistance and type 2 diabetes.65 ,66 Our results show that LKO under CT induces changes in many metabolites related to branched chain amino acid synthesis and metabolism (oxovalerates and aminobutyrates). Among them, NAC2, which recently have been reported as markers of inflammation and have been related to type 2 diabetes and cardiovascular disease,67 are affected by both the LKO and the HFD treatment. Choline, TMA and TMAO,68 which also were discriminant between groups, associate with diabetes, hepatic steatosis and furthermore cardiovascular disease. Although the connection among all these elements is extremely complex, our data suggest a new role of MyD88 in the development of glucose intolerance and hepatic steatosis.
In conclusion, our study identifies novel mechanisms linking hepatic innate immunity and metabolism. We show, both in mice and humans, that the expression of different cytochromes involved in bile acid and bioactive lipid synthesis may serve as a marker of susceptibility to develop metabolic disorders associated with obesity including type 2 diabetes and NASH.
Acknowledgments
The authors would like to thank A. Barrois, A. Bever, T. Pringels and H. Danthinne for technical assistance. They also thank R.M. Goebbels for histological assistance. They thank also M. Osto for the help in generating the Albumin-Myd88 KO mice and the western blot of MyD88 protein.
References
Footnotes
Correction notice This article has been corrected since it published Online First. The affiliation for Jos van Pelt has been corrected.
Twitter Follow Patrice Cani at @MicrObesity
Contributors VG and MVH contributed equally. PDC conceived, supervised the project and designed experiments, interpreted all the results and wrote the manuscript. TD, HP, VGM, AE, MS, SM, LG, MVH, MMP-T, CD, JVP, SM, FB, DM, AE and PDC have acquired data. NMD, JBD provided facilities and participated in discussions. TD, HP, VGM, AE, MS, SM, LG, MVH, MMP-T, CD, J-BD, JVP, SM, FB, DM, AE and PDC have analysed and interpreted the data. PDC and AE wrote the manuscript. All the authors reviewed the manuscript.
Fundings PDC is a research associate at FRS-FNRS (Fonds de la Recherche Scientifique), Belgium. TD has been financially supported (1 year) by the FRM (Fondation pour la recherche medicale, France). HP is a research fellow at FRS-FNRS, Belgium. DM is supported by grant from the Ministerio de Economia y Competitividad of the Spanish Government (SAF2014-52875R). AE is a postdoctoral researcher at FRS-FNRS, Belgium. ND is the recipient of grants from FNRS (convention CDR J.0122.15) and from the Walloon Region (Excellence project FOOD4GUT). PDC is the recipient of grants from FNRS (convention J.0084.15, convention 3.4579.11), PDR (Projet de Recherche, convention: T.0138.14), FRM (Fondation Recherche Medicale) and ARC (Action de Recherche Concertée—Communauté française de Belgique convention: 12/17-047). PDC is a recipient of an ERC Starting Grant 2013 (European Research Council, Starting grant 336452-ENIGMO). This work was supported by the Fonds de la Recherche Scientifique—FNRS for the FRFS-WELBIO under grant: WELBIO-CR-2012S-02R. This work was supported in part by the Funds InBev-Baillet Latour (grant for Medical Research 2015).
Competing interests None declared.
Patient consent Obtained.
Ethics approval All mouse experiments were approved by and performed in accordance with the guidelines of the local ethics committee for animal care of the Health Sector of the Université catholique de Louvain under the supervision of Prof. F. Lemaigre and Prof. JP Dehoux and under the specific agreement numbers 2010/UCL/MD/022 and 2013/UCL/MD/25. Housing conditions were specified by the Belgian Law of May 29, 2013 regarding the protection of laboratory animals (agreement number LA1230314).
Provenance and peer review Not commissioned; externally peer reviewed.