Article Text

Abstract
Objective Oesophageal cancer is the seventh most common cause of cancer-related death worldwide. Disease relapse is frequent and treatment options are limited.
Design To identify new biomarker-defined therapeutic approaches for patients with oesophageal cancer, we integrated the genomic profiles of 17 oesophageal tumour-derived cell lines with drug sensitivity data from small molecule inhibitor profiling, identifying drug sensitivity effects associated with cancer driver gene alterations. We also interrogated recently described RNA interference screen data for these tumour cell lines to identify candidate genetic dependencies or vulnerabilities that could be exploited as therapeutic targets.
Results By integrating the genomic features of oesophageal tumour cell lines with siRNA and drug screening data, we identified a series of candidate targets in oesophageal cancer, including a sensitivity to inhibition of the kinase BTK in MYC amplified oesophageal tumour cell lines. We found that this genetic dependency could be elicited with the clinical BTK/ERBB2 kinase inhibitor, ibrutinib. In both MYC and ERBB2 amplified tumour cells, ibrutinib downregulated ERK-mediated signal transduction, cMYC Ser-62 phosphorylation and levels of MYC protein, and elicited G1 cell cycle arrest and apoptosis, suggesting that this drug could be used to treat biomarker-selected groups of patients with oesophageal cancer.
Conclusions BTK represents a novel candidate therapeutic target in oesophageal cancer that can be targeted with ibrutinib. On the basis of this work, a proof-of-concept phase II clinical trial evaluating the efficacy of ibrutinib in patients with MYC and/or ERBB2 amplified advanced oesophageal cancer is currently underway (NCT02884453).
Trial registration number NCT02884453; Pre-results
- Oesophageal Cancer
- Molecular Biology
This is an open access article distributed in accordance with the Creative Commons Attribution Non Commercial (CC BY-NC 4.0) license, which permits others to distribute, remix, adapt, build upon this work non-commercially, and license their derivative works on different terms, provided the original work is properly cited and the use is non-commercial. See: http://creativecommons.org/licenses/by-nc/4.0/
Statistics from Altmetric.com
Significance of this study
What is already known on this subject?
Oesophageal cancer is the seventh leading cause of cancer-related mortality and represents an area of unmet clinical need.
Additional targeted approaches to treating this disease are urgently required, particularly in patients who progress after first-line therapy.
Genomic profiling of oesophageal cancers has highlighted the presence of amplifications in oncogenes including CCND1, ERBB2 and MYC, and efforts are required to exploit this information to identify therapeutic targets that could be used to treat biomarker-selected groups of patients with oesophageal cancer
What are the new findings?
By analysing large-scale in vitro functional genomic profiling data and drug data from tumour cell models of oesophageal cancer and integrating this with genomic profiling of these models, we have identified a series of candidate genetic vulnerabilities associated with cancer driver gene alterations common in oesophageal cancers.
One of the most profound effects identified was an addiction to the kinase BTK in MYC amplified oesophageal tumour cells, which could be elicited with the kinase inhibitor ibrutinib and which also targeted oesophageal tumour cells with ERBB2 amplification.
How might it impact on clinical practice in the foreseeable future?
As the result of the observations made in this study, a proof-of-concept phase II clinical trial evaluating the efficacy of ibrutinib in patients with MYC and/or ERBB2 amplified advanced oesophageal cancer is currently underway (NCT02884453).
Introduction
Oesophageal carcinoma is the seventh leading cause of cancer-related mortality and represents an area of unmet clinical need.1 Over 450 000 people worldwide are affected with this disease, and the incidence of oesophageal adenocarcinoma (EAC) continues to rise rapidly, although oesophageal squamous cell carcinoma (ESCC) is the most common histology.2 Integrated genomic characterisation of oesophageal carcinoma has revealed a separation between EAC and ESCC. This is demonstrated by a closer resemblance of genomic sequencing data from ESCC with squamous cell carcinomas of other anatomical sites than when compared with genomic profiles from primary EAC.3 EAC and ESCC are also distinct in terms of their aetiology in that EAC may originate from Barrett’s oesophagus, a premalignant condition that arises as a complication of chronic gastro-oesophageal reflux disease,4 whereas ESCC does not. Overall, 5-year survival rates over the past 30 years have improved from 5% to 19%. However, the prognosis for patients diagnosed with oesophageal cancer remains poor.5 6 Patients with EAC frequently present with advanced, inoperable disease, but even in those patients with operable disease the frequency of disease recurrence after surgery remains high.2 Treatment options for patients with oesophageal cancers are extremely limited. Platinum-based chemotherapy remains the mainstay of treatment for EAC in the perioperative and metastatic setting,7–11 and although taxanes and camptothecin analogues have been introduced into treatment regimens, these have not delivered large improvements in median survival.12–14 A small number of targeted therapeutic approaches exist for patients with EAC; these include the antivascular endothelial growth factor receptor 2 (anti-VEGFR2) therapeutic antibody ramucirumab, used in patients who progress after fluoropyrimidine or platinum-containing chemotherapy,15 16 and the Erb-B2 receptor tyrosine kinase (ERBB2) antibody, trastuzumab, used in combination with platinum-based chemotherapy as a first-line therapy in patients whose tumours exhibit ERBB2 oncogene amplification and/or overexpression.17 However, there are no licensed targeted therapies for patient with ESCC. Therefore, there is a clear need to identify additional targeted approaches to treating this disease, particularly in those patients who progress after first-line therapy.
One approach to this problem has been to define the molecular make-up of the disease, with the ultimate aim of using this information to inform the design of novel biomarker-stratified therapeutic approaches. For example, genomic profiling of oesophageal cancers has defined the mutational landscape of the disease.3 18–24 This work has highlighted the presence of a number of recurrent somatically occurring mutations in the disease, including amplifications of several well-known oncogenes including cyclin D1 (CCND1 15% in EAC3 and 46% in ESCC23), ERBB2 (32% in EAC3 and up to 11% in ESCC25) and MYC (32% in EAC and 23% in ESCC3). Building on this work, efforts are now required to exploit this information to identify therapeutic targets that could be used to treat biomarker-selected groups of patients with oesophageal cancer. Here, we describe an analysis of large-scale in vitro functional genomic profiling of tumour cell models of oesophageal cancer. Integrating this functional profiling with genomic profiling of these models, we identify a series of candidate genetic vulnerabilities associated with cancer driver gene alterations common in oesophageal cancers. One of the most profound effects identified in this way was an addiction to the kinase BTK in MYC amplified oesophageal tumour cells; this addiction could be exploited with the kinase inhibitor ibrutinib, which also targeted oesophageal tumour cells with ERBB2 amplification, suggesting a novel candidate therapeutic approach in EAC and ESCC.
Results
Identification of genetic dependencies in oesophageal tumour cell lines that are associated with cancer driver gene alterations
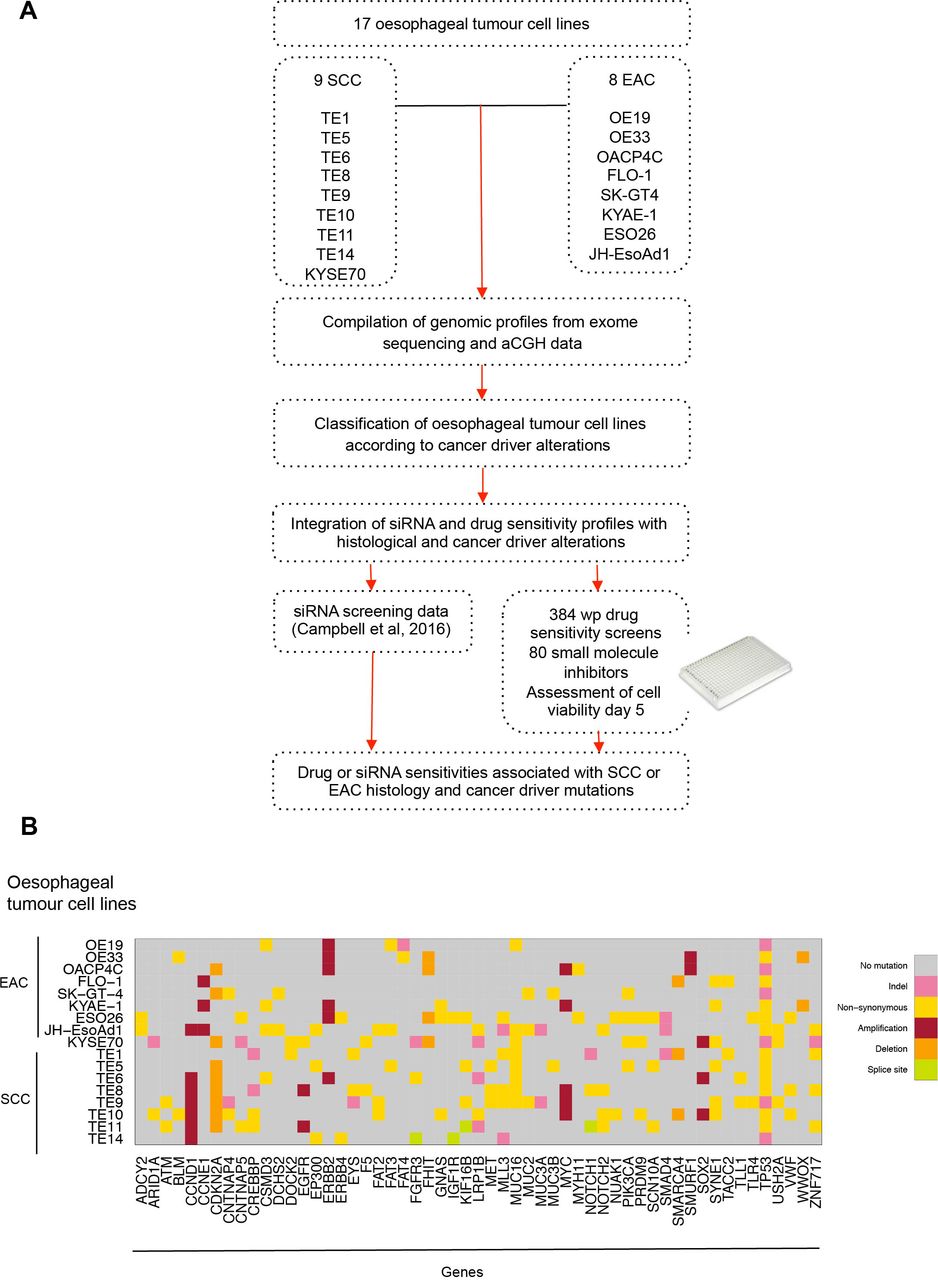
We aimed to identify genetic dependencies (GD) (ie, gene addiction and synthetic lethal effects) in oesophageal cancer that are associated with the presence of alterations in known oncogenic driver genes. To do this, we (1) compiled copy number and mutation profiles of 17 oesophageal tumour-derived cell lines using array comparative genomic hybridisation (aCGH) and exome sequencing data; (2) used these data to classify tumour cell lines according to the presence or absence of alterations in specific cancer driver genes, and then (3) interrogated recently described RNA interference (RNAi) screen data for the same tumour cell lines26 to identify RNAi reagents that selectively targeted oesophageal tumour cell lines with cancer driver gene alterations. In addition, we carried out small molecule inhibitor drug sensitivity profiling in the same oesophageal tumour cell line panel, and by integrating these data with the genomic profiles of the tumour cell lines identified drug sensitivity effects associated with alterations in specific cancer driver genes (figure 1A).

Identifying candidate genetic dependencies in oesophageal tumour cell lines. (A) Schematic of compilation of genomic profiles of 17 oesophageal tumour-derived cell lines using array comparative genomic hybridisation and exome sequencing. Oesophageal tumour cell lines were classified according to histology (SCC vs EAC) and cancer driver alterations. The 17 oesophageal cancer cell lines were screened in 384-well plate format using a small molecule drug library of compounds in late drug development or clinical trials. These drug data and high-throughput siRNA screening data (714 siRNA targeting kinase and kinase related genes26) from the same cell lines were interrogated and integrated with histological and cancer driver alterations to identify drug or siRNA sensitivities associated with SCC or EAC histology and cancer driver mutations. (B) Graph annotating predicted DNA coding mutations and copy number alterations present in two or more of 17 oesophageal cancer cell lines (8 EAC and 9 SCC) that are also to be found recurrently mutated in primary oesophageal tumours. aCGH, array comparative genomic hybridisation; EAC, oesophageal adenocarcinoma; SCC, squamous cell carcinoma.
Genomic profiling of oesophageal tumour cell lines
We selected 17 tumour cell lines, eight of which were derived from EAC (OE19, OE33, OACP4C, FLO-1, SK-GT-4, KYAE-1, ESO26 and JH-EsoAd1) and nine of which were derived from ESCC (KYSE70, TE1, TE5, TE6, TE8, TE9, TE10, TE11 and TE14; table 1). We used in-house aCGH data (32K based array CGHarray platform27) and publicly available single nucleotide polymorphism genotyping data (http://cancer.sanger.ac.uk/cosmic,https://portals.broadinstitute.org/ccle/home; online supplementary tables 1–17) to determine the copy number profile of each tumour cell line and used publicly available exome sequencing data to identify coding sequence variants in each model. We then cross-referred these tumour cell line genomic profiles to those from primary oesophageal tumours3 21 23 24 28–34 to annotate tumour cell lines in the panel according to the presence or absence of mutations in genes known to be recurrently mutated, amplified or deleted in primary oesophageal tumours. Cancer driver genes harbouring coding mutations or copy number alterations in two or more oesophageal tumour cell lines are illustrated in figure 1B and online supplementary table 18.
Oesophageal tumour cell lines used for high-throughput siRNA and drug screening
Consistent with the mutational spectrum of the clinical disease, we found that mutations in genes such as TP53 (mutated in 72% of primary EAC19 and 83% of ESCC23) were highly prevalent in the oesophageal tumour cell line panel. Six cell lines (OE19, OACP4C, SK-GT-4, KYSE70, TE9 and TE14) were predicted to have premature truncating TP53 mutations and 11 cell lines were predicted to have missense TP53 mutations (OE33, FLO-1, KYAE-1, ESO26, JHEsoAd1, TE1, TE5, TE6, TE8, TE10 and TE11). The SYNE1 gene (spectrin repeat containing nuclear envelope protein 1 gene), mutated in approximately 25% of primary treatment-naïve EAC tumours,19 was mutated in six oesophageal cell lines (FLO-1, KYAE-1, KYSE70, TE5, TE9 and TE10). Nine out of the 17 oesophageal tumour cell lines harboured homozygous copy number deletion of CDKN2A (cyclin-dependent kinase inhibitor 2A, p16/p14 gene), found to be deleted in 76% of EAC and ESCC of the oesophagus.3 In addition, 35% of the tumour cell line panel exhibited ERBB2 amplification events, a frequency comparable to the ERBB2 amplification rate in primary EACs.3 Furthermore, amplification of CCND1 (Cyclin D1 gene) was present in seven oesophageal models (JHEsoAd1, TE6, TE8, TE9, TE10, TE11 and TE14), and MYC amplification was present in five oesophageal cancer cell lines (OACP4C, KYAE-1, TE8, TE9 and TE10); in the clinical disease CCND1 amplification events are found in 15% of primary EAC3 and 46% of primary ESCC23 cases, whereas MYC is amplified in 23% in EAC and 32% in ESCC.3 In total, we identified 35 genes that were recurrently mutated in primary oesophageal tumours that were also mutated in at least 3 out of 17 oesophageal tumour cell line models.
Small molecule drug sensitivity profiling and integration with genomic profiles of oesophageal tumour cell lines
Using a 384-well plate screening approach, we assessed the sensitivity of each oesophageal tumour cell line to an in-house curated library of 80 drugs that are currently used for the treatment of cancer or which are in late-stage development (online supplementary table 19). Each drug in this library was present in four different concentrations (1, 10, 100 and 1000 nM). Each tumour cell line was plated in 384-well plates containing tissue culture media plus library small molecules and then cultured for a further 5 days, at which point cell viability was estimated using CellTiter-Glo reagent (figure 2A). Each tumour cell line was screened in triplicate, with 15 of the 17 tumour cell lines generating highly reproducible data (median correlation coefficients of >0.9 between replicates; online supplementary figure 1) and suitable dynamic range quality control criteria (estimated by Z′ calculations). The cell viability measurements for each drug titration (online supplementary table 19) were used to generate area under the curve (AUC) dose response data for each tumour cell line, illustrated as a heatmap in figure 2A and in online supplementary table 20.
Supplementary file 1

Small molecule drug sensitivity profiling and integration with genomic profiles of oesophageal tumour cell lines. (A) Heatmap displaying AUC measurements for each of the 80 small molecule inhibitors in the high-throughput drug screen and for each of the oesophageal cancer cell lines that passed quality control. Box and whisker plots of AUC values illustrating preferential sensitivity of SCC oesophageal cell lines to (B) dasatinib (p=0.032, MP test), (C) BI-2536 (p=0.033, MP test), (D) gefitinib (p=0.034, MP test) and (E) canertinib (p=0.038, MP test). (F) Box and whisker plots of AUC values illustrating preferential sensitivity of ERBB2 and EGFR amplified oesophageal cancer cell lines to lapatinib (p=0.038, Mann-Whitney U test). (G) Box and whisker plots of AUC values illustrating preferential sensitivity of oesophageal tumour cell lines harbouring PIK3CA mutations and BEZ235 (p=0.018, MP test) and (H) vinorelbine (p=0.032, MP test). AUC, area under the curve; MP, median permutation; SCC, squamous cell carcinoma.
We found the vast majority of oesophageal tumour cell lines to be sensitive to conventional cytotoxic agents including gemcitabine, camptothecin and paclitaxel, as well as the HSP90 inhibitor 17-AAG, the polo-like kinase 1 (PLK1) inhibitor BI2536, the cyclin-dependent kinase modulator flavopiridol and the P21 activated kinase 4 inhibitor, PF03758309 (figure 2A and online supplementary table 20). We then assessed if drug sensitivity effects differed according to whether tumour cell lines were derived from EAC or ESCC (online supplementary table 21) and found that ESCC cell lines were more sensitive to four drugs including dasatinib (p=0.032, median permutation (MP), t-test, figure 2B), a multitarget tyrosine kinase inhibitor and Src family tyrosine kinase inhibitor, and BI2536 (p=0.033, MP test, figure 2C), a small molecule inhibitor of PLK1. Compared with EAC cell lines, the ESCC cell lines were more sensitive to the epidermal growth factor receptor (EGFR) small molecule inhibitor, gefitinib (p=0.034, MP test, figure 2D), a finding that was consistent with data from a subgroup analysis of the cancer oesophagus gefitnib (COG) trial that revealed an HR in favour of gefitinib treatment in patients with ESCC.35 In addition, ESCC cell lines were found to be more sensitive to the pan-ErbB inhibitor, canertinib (p=0.038, MP test, figure 2E), compared with EAC cell lines.
We integrated the data from the small molecule inhibitor screen with the genomic profiles of the tumour cell line panel to identify drug sensitivity effects associated with likely cancer driver gene alterations (figure 1A, online supplementary table 22). As expected, this analysis indicated that ERBB2 or EGFR amplified tumour cell lines were preferentially sensitive to the Erb-family kinase inhibitor lapatinib (p=0.038, Mann-Whitney U test, figure 2F), providing proof of principle that this approach could identify drug sensitivities associated with molecularly defined subgroups of oesophageal cancer. We also noted that oesophageal tumour cell lines that harbour missense mutations predicted to result in amino acid changes in the PIK3CA helicase domain exhibited the greatest sensitivity to the PI3-kinase/AKT signalling pathway inhibitor BEZ235 (p=0.018, MP test, figure 2G). Oesophageal tumour cell lines harbouring mutations within the PIK3CA helicase domain also exhibited preferential sensitivity to the 3-phosphoinositide-dependent protein kinase 1 inhibitor GSK-2334470A (p=0.021, MP test) and vinorelbine (p=0.032, MP test, figure 2H).
Integration of genomic profiles with siRNA data
Using a similar data integration scheme as for the drug sensitivity data, we cross-referred the genomic profiles of the tumour cell line panel to in-house generated data describing the sensitivity of each of the 17 oesophageal tumour cell line models and an additional 103 tumour cell lines to siRNAs designed to target a panel of 714 genes encoding kinases and kinase-related proteins (the ‘Campbell et al data set’26) as a means to identify candidate GDs in oesophageal cancers (online supplementary figure 2 and supplementary table 23). As kinases represent a pharmacologically tractable family of enzymes, we reasoned that doing so might also identify targetable vulnerabilities associated with molecularly defined subsets of the disease (figure 1A).
Supplementary file 2
Initially, we used this integrated analysis to identify those kinases that when targeted with siRNA selectively targeted the oesophageal tumour cell lines, as opposed to the other 103 tumour cell lines that we also profiled by siRNA screening in our data set.26 This analysis suggested that, compared with non-oesophageal tumour cell lines, those derived from oesophageal cancers exhibited dependencies on NEK9 (p=0.00026, MP test), PACE1 (p=0.00027, MP test), MGC42105 (p=0.0003, MP test) and CDKN2C (p=0.00058, MP test) (figure 3A and online supplementary table 24). When ESCC-derived cell lines were compared with EAC-derived cell lines, we found EGFR to be the most profound GD associated with ESCC histology (p=0.000006, MP test, figure 3B and online supplementary table 25). This observation confirms the enhanced sensitivity of ESCC cell lines to the EGFR small molecule inhibitor, gefitinib, and the pan-ErbB inhibitor, canertinib, seen in the small molecule drug screen (figure 2E). When using the genomic profiles of the oesophageal tumour cell lines to identify GD associated with alterations in specific cancer driver genes (online supplementary table 26), we found that, as expected, siRNA designed to target ERBB2 itself preferentially targeted ERBB2 amplified oesophageal tumour cell lines (p=0.019, MP test, figure 3D,E), supporting the hypothesis that ERBB2 amplification can lead to an oncogene addiction effect.17 We found that ERBB2 amplified oesophageal tumour cell lines also exhibited GDs on members of the mitogen-activated protein kinase family that signal downstream of ERBB236 including MAPK2K2 (p=0.0073, MP test, figure 3D), MAP2K3 (p=0.0082, MP test, figure 3F) and MAPK6 (p=0.0082, MP test, figure 3D).

Integration of genomic profiles with siRNA data. (A) Radar plot showing key genetic dependencies associated with oesophageal tumour cell lines compared with tumour cell lines from other histologies.26 The concentric circles indicate the degree of statistical significance and depth of colour indicates separation of Z scores. Radar plots showing key genetic dependencies associated with (B) oesophageal SCC histology and (C) EAC histology. (D) Radar plot showing key genetic dependencies associated with ERBB2 amplification. Box and whisker plots of Z score values showing that targeting of (E) ERBB2 (p=0.019, MP test) and (F) MAP2K3 (p=0.0082, MP test) is selectively lethal in ERBB2 amplified oesophageal cancer cell lines. (G) Radar plot showing key genetic dependencies associated with MYC amplification. (H) Box and whisker plots of Z score values showing that targeting of BTK (p=0.017, MP test) and (I) ALK (p=0.008, MP test) is selectively lethal in MYC amplified oesophageal cell lines. (J) Radar plot showing key genetic dependencies associated with copy number deletions in SMARCA4 in oesophageal cancer cell lines. (K) Box and whisker plots of Z score values showing that targeting BRD4 (p=0.022, MP test) is selectively lethal in oesophageal tumour cell lines harbouring SMARCA4 copy number loss. (L) Radar plot showing key genetic dependencies associated with CCND1 amplification. (M) Box and whisker plots of Z score values showing that targeting ROCK1 (p=0.0056, MP test) is selectively lethal in CCND1 amplified oesophageal cancer cell lines. EAC, oesophageal adenocarcinoma; MP, median permutation; SCC, squamous cell carcinoma.
MYC is amplified in 23% of EAC and 32% of ESCC.3 We found MYC amplified oesophageal tumour cell lines to exhibit GDs on CLK1 (Cdc2-like kinase gene, p=0.02, MP test, figure 3G), BTK (Bruton agammaglobulinaemia tyrosine kinase gene, p=0.017 MP test, figure 3H), ALK (anaplastic lymphoma receptor tyrosine kinase gene, p=0.008 MP test, figure 3I) and PRKCA (protein kinase C alpha gene, p=0.028 MP test, figure 3G). Among other GDs identified in this way, we observed a relationship between SMARCA4 copy number loss and a GD on BRD4 (p=0.022, MP test, figure 3J,K), a member of the BET (bromodomain and extra terminal domain) family. CCND1 amplified oesophageal tumour cell lines exhibited GD on TYK2 (tyrosine kinase 2) tyrosine kinases (figure 3L). Other GDs identified in the CCND1 amplified oesophageal tumour cell lines included FLT1 (which encodes VEGFR1, p=0.0054, MP test), ROCK1 (rho-associated, coiled–coil-containing protein kinase gene, p=0.0056 MP test, figure 3M) and TGFBR1 (TGFβ receptor1 gene, p=0.013, MP test, figure 3L).
Ibrutinib sensitivity in MYC and ERBB2 amplified oesophageal cancer
Analysis of the oesophageal kinase dependency profiles revealed that one of the most profound associations was between MYC amplification and sensitivity to BTK siRNA (p=0.017, MP test, figure 3H). Although BTK has been most studied within the context of B cell malignancies37 and comprises a key component downstream of BCR signalling,38 BTK isoforms are also present in epithelial tumours including breast,39 prostate,40 colon41 and gastric cancers.42 We assessed BTK protein and mRNA expression across the panel of oesophageal tumour cell lines and found that canonical BTK is expressed in these models, although at low levels (figure 4A,B). We also confirmed that a splice variant, BTK-C, is expressed in the oesophageal tumour models (figure 4C,D).

BTK expression in oesophageal tumour cell lines. (A) Western blot showing expression of BTK across a panel of oesophageal cancer cell lines. (B) Graph illustrating BTK mRNA expression relative to TE10. (C) Agarose gel electrophoresis of BTK-C PCR products showing presence of the BTK-C splice variant in a panel of oesophageal cancer cell lines. (D) Graph illustrating BTK-C mRNA expression relative to KYSE70. (E) Bar chart showing decreased cell viability in parental TE8 after transfection with individual siBTK oligonucleotides compared with siAllstar. Normalised percentage inhibition = (negative control median − cell viability value) / (negative control median − positive control). (F) Bar chart showing decreased cell viability in TE8 with BTK overexpression after transfection with individual siBTK oligonucleotides compared with siAllstar. (G) Western blot showing decreased BTK protein expression following transfection with individual siBTK in TE8 with BTK overexpression (lentiviral transduction). (H) Bar chart showing decreased cell viability in TE8 after transfection with siBTK-C oligonucleotides. (I) Bar chart showing decreased BTK-C mRNA expression following transfection with siBTK-C oligonucleotides.
We validated the BTK/MYC synthetic lethal interaction in MYC amplified oesophageal tumour cell lines using multiple, different BTK-targeting siRNAs (figure 4E,F,G), suggesting that this was unlikely to be an off-target effect. In addition, we observed decreased cell viability (figure 4H) and a reduction of BTKC mRNA expression after transfection with individual siRNAs specifically targeting BTK-C (figure 4I and online supplementary figure 3), suggesting that the BTK-C isoform is essential in oesophageal tumour models. To investigate whether small molecule inhibition of BTK could mimic these effects, we exposed the panel of oesophageal tumour cell lines to increasing concentrations (0.1–10 µM) of the clinical BTK inhibitor ibrutinib, a drug that has durable single-agent efficacy in relapsed mantle cell lymphoma, Waldenstrom’s macroglobulinaemia and chronic lymphocytic leukaemia.43 44 While ibrutinib is a potent BTK inhibitor, it also directly inhibits ERBB2.45 46 Consistent with this, our analysis of ibrutinib sensitivity in oesophageal tumour cell lines revealed that there was preferential sensitivity to ibrutinib in both MYC amplified and/or ERBB2 amplified oesophageal tumour cell lines (p=0.018, Mann-Whitney U test, figure 5A,B).

Ibrutinib sensitivity in MYC and/or HER2 amplified oesophageal tumour cell lines. (A) Box plot depicting area under the curve values for ibrutinib. Preferential sensitivity to ibrutinib is observed in oesophageal cancer cell lines harbouring MYC and/or ERBB2 amplification. (B) Ibrutinib drug sensitivity curves across the panel of oesophageal tumour cell lines. Cell lines that are not MYC or ERBB2 amplified are depicted in black, MYC and ERBB2 amplified in purple, MYC amplified alone in blue and ERBB2 amplified alone in red. (C) Western blots showing decreased expression of cMYC in MYC amplified KYAE-1 tumour cell line after exposure to 1 µM ibrutinib. (D) Western blot showing decreased expression of cMYC in MYC amplified TE8 tumour cell line after exposure to 1 µM ibrutinib. (E) Bar chart showing decreased cell viability in KYAE-1 (MYC and ERBB2 amplified) following transfection with siMYC oligonucleotides. (F) Western blot showing decreased protein expression of cMYC following transfection of siMYC oligonucleotides in KYAE-1 (MYC and ERBB2 amplified). (G) Cell cycle analysis after 24 and 48 hours of ibrutinib exposure in KYAE-1 (MYC and ERBB2 amplified), (H) TE8 (MYC amplified) and (I) JHEsoAd1 (MYC and ERBB2 non-amplified) tumour cell lines. Prolongation of the G1 phase is observed with increasing doses of ibrutinib in cell line harbouring MYC amplification. G1 arrest was not observed in JHEsoAd1 (MYC and ERBB2 non-amplified) cell line. (J) Western blot showing decreased expression of p-Rb, Rb and cyclin D1 following ibrutinib exposure in KYAE-1 (MYC and ERBB2 amplified). (K) Western blot showing decreased expression of cyclin D1 following ibrutinib exposure in TE8 (MYC amplified). (L) Western blot showing no change in protein expression of p-Rb, Rb and cyclin D1 following ibrutinib exposure in JHEsoAd1 (MYC and ERBB2 non amplified). (M) Bar chart showing the apoptotic cell fraction (percentage of annexin-positive cells) after exposure to increasing doses of ibrutinib (24 and 48 hours). An increase in apoptosis is observed in KYAE-1 (MYC and ERBB2 amplified) that is not seen in JHEsoAd1 (MYC and ERBB2 non-amplified). (N) Western blot showing expression of cleaved PARP1 after ibrutinib exposure in the KYAE-1 (MYC and ERBB2 amplified). Cleaved PARP1 is not seen in JHEsoAd1 after ibrutinib exposure (MYC and ERBB2 non-amplified).
We wanted to examine the mechanism of ibrutinib sensitivity in MYC amplified oesophageal cell lines. We found that MYC protein levels were reduced by ibrutinib exposure in both KYAE-1 (MYC amplified) and TE8 (MYC and ERBB2 amplified) oesophageal tumour cell lines (figure 5C,D). Transfection of siRNA targeting MYC confirmed that these tumour cell lines were addicted to MYC (figure 5E,F). Ibrutinib exposure also caused an increased G1 fraction in MYC amplified and MYC/ERBB2 coamplified oesophageal tumour cell lines (figure 5G,H) but not in tumour cell lines without these amplification events (figure 5I). In MYC amplified and also MYC/ERBB2 coamplified oesophageal tumour cell lines, ibrutinib exposure caused a reduction in phosphorylated Rb, total Rb and cyclin D1 protein levels (figure 5J,K) not seen in non-amplified tumour cell lines (figure 5L), consistent with the increased G1 fraction. Ibrutinib exposure also increased annexin V and cleaved PARP1 levels in sensitive tumour cells (figure 5M,N), suggesting that the G1 arrest caused by ibrutinib might eventually drive an apoptotic response.
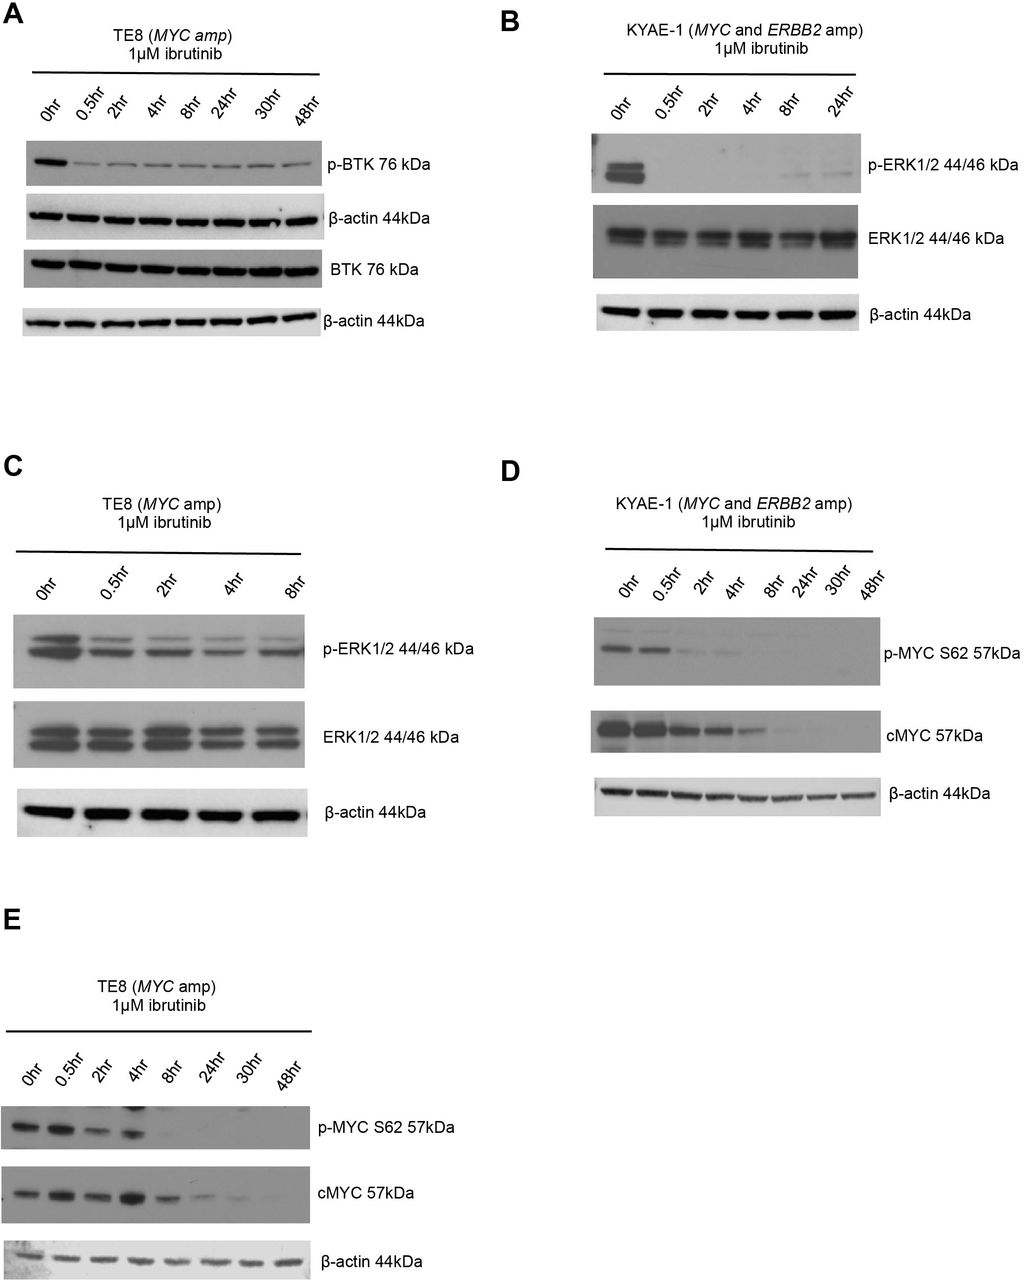
ERK1/2 is downregulated by ibrutinib
BTK is known to signal via the ras/mitogen-activated protein kinase (RAS-RAF-MEK-ERK) pathway.41 To investigate whether this contributed to the ibrutinib-dependent reduction of MYC protein levels in oesophageal tumour cells, we evaluated changes in p-ERK protein expression after ibrutinib exposure. We observed a reduction in p-BTK (figure 6A), indicating decreased catalytic activity of BTK and p-ERK levels (figure 6B,C) after ibrutinib exposure. As ERK is a known mediator of MYC phosphorylation at serine 62,47 we assessed changes in p-MYC S62 protein expression after exposure to ibrutinib and observed a decrease in p-MYC S62 levels in oesophageal tumour cell lines that were either MYC amplified or MYC/ERBB2 coamplified (figure 6D,E). Phosphorylated MYC at serine 62 (p-MYC S62) is required for stabilisation of MYC protein levels.48 Consistent with this, we observed a reduction in MYC protein levels (figure 6D,E). Taken together, these results suggested that exposure to ibrutinib resulted in a reduction in MYC in oesophageal tumour models by reduction of BTK-dependent, ERK-mediated, MYC phosphorylation.
![[SP1.jpg]](https://gut.bmj.com/content/gutjnl/67/10/1780/DC1/embed/inline-supplementary-material-1.jpg?download=true)
![[SP2.jpg]](https://gut.bmj.com/content/gutjnl/67/10/1780/DC2/embed/inline-supplementary-material-2.jpg?download=true)
ERK1/2 is downregulated by ibrutinib. (A) Western blot showing decreased p-BTK protein expression in BTK overexpressed (lentiviral transduction) TE8 cell line (MYC amplified) following ibrutinib exposure. (B) Western blot showing decreased p-ERK protein expression in KYAE-1 tumour cell line (MYC and ERBB2 amplified) and (C) TE8 cell line (MYC amplified) following ibrutinib exposure. (D) Western blots showing that ibrutinib exposure results in downregulation of p-MYC S62 and total cMYC in KYAE-1 (MYC and ERBB2 amplified) and (E) TE8 (MYC amplified) oesophageal tumour cell lines.
Discussion
In this study, we show how integration of functional genomic profiling data with genotypic data from oesophageal cancer tumour cell lines may be used to identify candidate GDs. By undertaking high-throughput small molecule drug screening, we provide a public resource for the identification of biomarker driven therapies in a disease that currently has very limited treatment options.
By interrogating drug and siRNA data with copy number profiling data, we identified an addiction to BTK in MYC amplified oesophageal tumour cell line models that may represent an induced essentiality where the gain of MYC function induces a dependency on BTK.49 We exploited this addiction with the small molecule inhibitor ibrutinib that targets both BTK and ERBB2, and found increased sensitivity in MYC and/or ERBB2 amplified oesophageal tumour models to ibrutinib. Ibrutinib exposure also resulted in downregulation of cMYC. Mechanistically, one model that is consistent with these data might be that BTK and ERBB2 inhibition with ibrutinib results in downregulation of cMYC, likely via deregulation of ERK signalling. The use of ibrutinib in this context exemplifies how molecular and functional profiling data might be used to design novel therapeutic approaches for patients with oesophageal cancer.
Ibrutinib already has Food and Drug Administration approval for the treatment of patients with Waldenstrom’s macroglobulinaemia,50 mantle cell lymphoma44 and chronic lymphocytic leukaemia43 based on the demonstration of durable responses in single-arm multicentre clinical studies that enrolled patients with previously treated disease. Considering the known safety profile of ibrutinib, we have initiated a proof-of-concept single-arm phase II trial of ibrutinib in patients with advanced oesophagogastric cancer harbouring MYC and/or ERBB2 amplifications (ibrutinib in MYC amplified oesophageal cancer (iMYC)trial — NCT NCT02884453) who have progressed after first-line treatment. Patients recruited to the iMYC trial undergo prescreening for MYC and ERBB2 amplification by fluoresence in situ hybridisation criteria. The role for ibrutinib in ERBB2 amplified EAC may be clinically relevant as there are currently no approved anti-ERBB2 therapies in the second-line setting; approximately half of patients with advanced EAC have de novo resistance to first-line trastuzumab, and the median time to progression following initial response to chemotherapy and trastuzumab is only 7.1 months.17 Exploratory molecular and functional imaging biomarker analyses have been incorporated into the iMYC trial where serial tumour biopsies and blood samples are retrieved at screening, during treatment and at progression. Whole exome sequencing and RNA sequencing of serial tumour samples will be undertaken to assess genetic determinants of response and resistance to ibrutinib. Sequential tumour samples will be evaluated for expression of phosphorylated kinases in the ERBB2, AKT and RAS-RAF-MEK-ERK-MYC signalling pathways as part of pharmacodynamic biomarker assessment. In addition, we will assess the expression of phosphorylated proteins that signal downstream of BTK, including 1-phosphatidylinositol-4,5-bisphosphonate phosphodiesterase gamma and protein kinase C. Given that we observed greatest sensitivity to ibrutinib in MYC/ERBB2 coamplified models (4% of EAC3) and that ERBB2 amplification only occurs in up to 11% of ESCC25 compared with up to 32% in EAC,3 it is likely that a therapeutic approach utilising ibrutinib will be clinically relevant to a larger proportion of patients with EAC within the context of this study.
Our aim in providing these data and illustrating its potential utility is to present testable hypotheses for future work that require orthogonal validation. We recommend that subsequent work based on the siRNA analysis incorporates the use of individual siRNAs designed to target a gene, CRISPR-Cas9-mediated gene targeting or small molecule inhibitors given the well-documented off-target effects associated with RNAi reagents.51 We are also mindful of the limitations of using tumour cell lines in terms of modelling the human disease and would recommend that future work relating to oesophageal cancer should be validated using patient-derived tumour organoids (PDTOs) and xenografts (PDXs). PDXs, where surgically resected tumour samples are engrafted directly into immunocompromised mice, offer many advantages over standard cell-line xenograft models, including the preservation of the molecular heterogeneity frequently observed in human oesophageal tumours, and represent a genomically characterised platform with which to analyse drug sensitivity in relation to driver mutations for the purposes of biomarker discovery. In addition to commercially available PDX collections, patient-derived in vitro and in vivo models have also been propagated through academic collaboration.52 Going forward, it would be important to use such platforms to identify the dynamic response to ibrutinib in relevant oesophageal cancer PDTOs and PDXs as a route to identifying mechanismsof resistance to BTK inhibition that might emerge. Finally, candidate predictive biomarkers identified from drug screening should be evaluated in oesophageal tumour tissues within the context of prospective clinical studies utilising targeted therapies and correlated with clinical outcome.
Supplementary tables
All online supplementary tables have been made publicly available and can be accessed using the following link: https://doi.org/10.5281/zenodo.826575.
Materials and methods
Cell lines
Tumour cell lines were obtained from the American Type Culture Collection, European Collection of Cell Cultures and Deutsche Sammlung von Mikroorganismen und Zellkulturen, and maintained as per the supplier’s instructions. Short tandem repeats (STR) geno typing of 10 loci was performed using the GenePrint 10 system (Promega) and used to confirm the identity of cell lines prior to storage. At monthly intervals, mycoplasma testing was carried out using MycoAlert Mycoplasma Detection Kit (Lonza).
Array comparative genomic hybridisation
All cell line and tumours were subjected to aCGH (Breakthrough Breast Cancer Research Centre) 32K BAC array platform and profiled as previously described.27 siRNA screening and processing 17 oesophageal cancer cell lines were optimised for siRNA screening conditions by titrating cell number and transfection lipid. Each cell line was transfected with a plate-arrayed siRNA library targeting 714 kinases and kinase-related genes (Dharmacon in a 384-well plate format) as described in Campbell et al. 26
Association testing
An MP test was used to identify associations between specific features (histotype or driver gene mutation) and sensitivity to specific siRNAs. For each kinase we compared the observed difference between the median Z score of the interest group (mutant, tissue of interest or other grouping variable) and the median Z score of the ‘other’ group (wild-type, non-tissue of interest or inverse of other grouping variable) to that expected based on random permutation.
Small molecule kinase inhibitor growth assays
The compound screens comprised an in-house library of 80 small molecule inhibitors (0.5, 1, 5, 10, 50, 100, 500 and 1000 nM). Five hundred cells were seeded in 384-well plates. Twenty-four hours post seeding, drug treatment was initiated and cells were continuously exposed to the drugs (6 days), at which point cell viability was estimated using CellTiter-Glo (Promega). Luminescence values were normalised to the median of the per-plate dimethyl sulphoxide (DMSO) negative control wells and the dose–response relationships modelled using three-parameter logistic regression provided by the drc R package. AUC scores are represented as a proportion of the maximum area under curve (calculated as: log10(500000) − log10(500)=3).
BTK and BTK-C PCR
RNA was extracted from untreated cells using RNeasy Mini Kit (Qiagen). One microgram of RNA was converted to cDNA using reverse transcriptase with the iScript cDNA synthesis kit (BioRad) as per manufacturer’s instructions. The cDNA was used to detect BTK or BTK-C with the following primers: BTK forward 5'-GGGGTTTGCTCAGACTGTCC-3', BTK-C forward 5'-AATGAAGGGGTCCTCCACCT-3' and BTK/BTK-C reverse 5'-AATCACTGCGGCCATAGCTT-3'. PCR was performed using Platinum Green Hot Start PCR 2x Master mix (Thermo Fisher) as per manufacturer’s instructions.
BTK and BTK-C real-time PCR
RNA was extracted and converted to cDNA. Real time PCR was carried out using PowerUp SYBR Green Master mix (Thermo Fisher) and 20x PrimePCR primers for BTK and Actin (BioRad). For BTK-C, the primers used were those described by Eifert et al (Genes, Chromosomes and Cancer, 2013) and actin primers were forward 5'-CCCTGGCACCCAGCAC-3' and reverse 5'-GCCGATCCACACGGAGTAC-3'.
Reverse transfections and cell viability assay
Fifteen microlitres of each siRNA species were mixed with 750 µL of optimum and incubated at RT (10 min). Fifty microlitres of RNAiMax (Invitrogen) were incubated with 2.5 mL optimum (10 min). Two hundred fifty microlitres of transfection mix were added to the siRNA mix and incubated at RT (30 min). Of the transfection/siRNA mix, 17.5 µL was plated in triplicate in 96-well plate format, then 80 µL cells/well (0.025×10⁶ cells/mL) were then seeded. After 5 days, 35 µL CellTiter-Glo was added per well. The de-convoluted siRNA target sequences used are as follows:
siMYC1 AACGUUAGCUUCACCAACA siMYC2 GGAACUAUGACCUCGACUA siMYC3 GAACACACAACGUCUUGGA siMYC4 CUACCAGGCUGCGCGCAAA siBTK1 GCUAUGGGCUGCCAAAUUU siBTK2 GAAAGCAACUUACCAUGGU siBTK3 GGUAAACGAUCAAGGAGUU siBTKC1 GGUUAUUGGAUGCCCAUUAUU siBTKC2 GGGAGAGCACACAGGUGAAUU
Apoptosis assay
Apoptotic cells were identified using an FITC Annexin V Kit (BD Bioscience). Cells were plated and treated the following day with ibrutinib for 48 or 72 hours, trypsinised, washed in phosphate-buffered saline (PBS) and resuspended in 1x Annexin binding buffer. Five microlitres of FITC Annexin V and 5 µL propidium iodide (PI) and 400 µL of 1x Annexin binding buffer were added. Data were analysed on a BD LSRII flow cytometer.
Cell cycle assay
Cells were plated and treated the following day with ibrutinib for 24 or 48 hours. Cells were trypsinised, washed in PBS and fixed in 70% ethanol, then treated with 50 µg/mL RNase A. PI was added (50 µg/mL) and data were analysed on a BD LSRII flow cytometer.
Western blotting
Cell lysates were separated using 4%–12% sodium dodecyl sulfate-polyacrylamide gel electrophoresis (SDS-PAGE) Bis-Tris gel, transferred to nitrocellulose membrane, blocked in 5% milk and blotted with antibodies (table 2).
Genetic dependencies in oesophageal cancer: Chong et al
BTK overexpression in MYC amplified oesophageal cancer cell lines
BTK was overexpressed using a lentiviral vector containing the BTK ORF (Source Bioscience). Five micrograms of this plasmid with 4 µg psPAX2 packaging plasmid and 1.5 µg pMD2.G envelope plasmid were combined with Lipofectamine 3000 and P3000 (Thermo Fisher) and used to transfect 2×1 06 293 T cells.
Acknowledgments
This work was funded by a Cancer Research UK programme grant to CJL (grant number C347/A8363) and Janssen and Pharmacyclics Pharmaceuticals as part of a sponsored research agreement with IYC. AA is funded by a Department of Defence grant. We acknowledge NHS funding to the NIHR Royal Marsden Hospital Biomedical Research Centre. We thank the Thornton Foundation, Cadogan Foundation and the Royal Marsden Cancer Charity for their financial support.
References
Footnotes
Contributors Data generation and analysis: IYC, LA, HB, AG, JC, RE, AR, MBL, PW, CJL. Data interpretation: IYC, LA, HB, SP, JSRF. Obtained funding: IYC, DC, IC, AA, CJL. Manuscript drafting: IYC, LA, SP, MD, IC, DC, AA, CJL. Approval of final manuscript: All authors.
Disclaimer IYC has received research funding from Janssen and Pharmacyclics as part of a sponsored research agreement. DC accepts research funding from the following institutions: Amgen, AstraZeneca, Bayer, Celgene, Merrimack, Medimmune, Merck Serono and Sanofi Oncology. IC is on the Advisory Board for Sanofi Oncology, Eli Lilly, Bristol Myers Squibb, MSD, Roche and Five Prime Therapeutics, accepts research funding from Janssen-Cilag, Sanofi Oncology, Merck Serono and Novartis, and has received honorarium from Taiho, Pfizer, Amgen, Eli Lilly and Gilead Science.
Competing interests IYC has received research funding from Janssen and Pharmacyclics as part of a sponsored research agreement. IC accepts research funding from Janssen-Cilag.
Provenance and peer review Not commissioned; externally peer reviewed.
Data sharing statement There are no additional unpublished data from this study available.