Article Text

Abstract
Objective Anti-tumour necrosis factor (TNF) antibodies are successfully used for treatment of Crohn’s disease. Nevertheless, approximately 40% of patients display failure to anti-TNF therapy. Here, we characterised molecular mechanisms that are associated with endoscopic resistance to anti-TNF therapy.
Design Mucosal and blood cells were isolated from patients with Crohn’s disease prior and during anti-TNF therapy. Cytokine profiles, cell surface markers, signalling proteins and cell apoptosis were assessed by microarray, immunohistochemistry, qPCR, ELISA, whole organ cultures and FACS.
Results Responders to anti-TNF therapy displayed a significantly higher expression of TNF receptor 2 (TNFR2) but not IL23R on T cells than non-responders prior to anti-TNF therapy. During anti-TNF therapy, there was a significant upregulation of mucosal IL-23p19, IL23R and IL-17A in anti-TNF non-responders but not in responders. Apoptosis-resistant TNFR2+IL23R+ T cells were significantly expanded in anti-TNF non-responders compared with responders, expressed the gut tropic integrins α4β7, and exhibited increased expression of IFN-γ, T-bet, IL-17A and RORγt compared with TNFR2+IL23R− cells, indicating a mixed Th1/Th17-like phenotype. Intestinal TNFR2+IL23R+ T cells were activated by IL-23 derived from CD14+ macrophages, which were significantly more present in non-responders prior to anti-TNF treatment. Administration of IL-23 to anti-TNF-treated mucosal organ cultures led to the expansion of CD4+IL23R+TNFR2+ lymphocytes. Functional studies demonstrated that anti-TNF-induced apoptosis in mucosal T cells is abrogated by IL-23.
Conclusions Expansion of apoptosis-resistant intestinal TNFR2+IL23R+ T cells is associated with resistance to anti-TNF therapy in Crohn’s disease. These findings identify IL-23 as a suitable molecular target in patients with Crohn’s disease refractory to anti-TNF therapy.
- crohn’s disease
- tnf
- apoptosis
- intestinal T cells
- mucosal immunology
This is an open access article distributed in accordance with the Creative Commons Attribution Non Commercial (CC BY-NC 4.0) license, which permits others to distribute, remix, adapt, build upon this work non-commercially, and license their derivative works on different terms, provided the original work is properly cited and the use is non-commercial. See: http://creativecommons.org/licenses/by-nc/4.0/
Statistics from Altmetric.com
Significance of the study
What is already known on this subject?
Anti-tumour necrosis factor (anti-TNF) antibodies are effectively used for treatment in many patients with Crohn’s disease.
Approximately 40% of patients are refractory to anti-TNF therapy or will lose response to treatment.
The mechanistic reasons for anti-TNF refractory Crohn’s disease are still unknown, but it has been shown that inhibition of IL-23 was particularly effective in anti-TNF non-responsive patients.
What are the new findings?
Patients with Crohn’s disease responding to anti-TNF therapy display a significantly higher expression of TNF receptor 2 (TNFR2) on mucosal T cells than non-responders prior to the initiation of therapy.
During anti-TNF therapy, there is significant upregulation of mucosal IL-23p19, IL23R and IL-17A in anti-TNF refractory patients, but not in responders.
IL-23 derived from CD14+ macrophages abrogates anti-TNF-induced apoptosis in mucosal T cells and activates intestinal TNFR2+IL23R+ T cells.
TNFR2+IL23R+ T cells express the gut-tropic integrins α4β7
Apoptosis-resistant TNFR2+IL23R+ T cells expand in anti-TNF refractory patients and perpetuate mucosal inflammation.
How might it impact on clinical practice in the foreseeable future?
IL-23 is centrally involved in mediating resistance to anti-TNF therapy in patients with Crohn’s disease and thereby represents a suitable molecular target in anti-TNF refractory disease.
Introduction
Crohn’s disease (CD) is a chronic relapsing inflammatory disorder that is characterised by an uncontrolled mucosal immune reaction.1 Aberrant production of inflammatory cytokines, in particular tumour necrosis factor (TNF), has been implicated as a critical contributor in perpetuating intestinal inflammation in CD.2 3 Its functional relevance is highlighted by the clinical efficacy of anti-TNF antibodies, which have become an integral part in the treatment of patients with CD.4–6
Although anti-TNF therapy is often highly effective, it however fails to show therapeutic efficacy in a relevant subgroup of patients with CD. Approximately one-third of treated patients with CD do not have a response to initial anti-TNF therapy (primary non-response) and are also unlikely to benefit from another TNF antagonist.7 Moreover, 30%–50% eventually lose response to treatment (secondary non-response).8 Immunogenicity has been primarily made responsible for the loss of response in secondary non-responders,9 but switching to a second anti-TNF antagonist has likewise shown only diminished response rates compared with anti-TNF-naive patients.10 Apart from neutralising antibodies against anti-TNF agents, lack of response has so far been mainly explained by insufficient serum drug levels.9 Nevertheless, a recent study identified a large subgroup of patients with secondary non-response to anti-TNF treatment that had adequate anti-TNF antibody serum trough levels and no detectable neutralising antibodies.11 These findings strongly indicate that apart from pharmacodynamic factors, alternative mechanistic reasons must be made responsible for the observed variable response to anti-TNF treatment in subgroups of patients with CD.
The exact mechanism of action of anti-TNF antibodies in CD is still a matter of uncertainty, but it is general consensus that one of their main therapeutic properties is mediated by binding to membrane-bound TNF (mTNF) bearing immune cells.12 13 Specifically, anti-TNF agents may bind to mTNF-expressing macrophages, thereby inducing apoptosis in TNFR2-expressing mucosal T cells lacking mTNF-dependent costimulation.14 The mTNF/TNFR2 signalling pathway is thus a crucial regulator in mediating resistance to intestinal T-cell apoptosis and may contribute to the perpetuation of mucosal inflammation.
How the mucosal immune system may escape the immunosuppressive and apoptosis-inducing effects of anti-TNF agents is poorly understood. However, it is known that cytokine networks in the inflamed mucosa of patients with CD are subject to change, influenced by varying cytokine production patterns that occur in the course of disease.3 For example, a transition from a Th1 to a mixed Th1/Th17 response has been described in CD.15 Additionally, the heterogeneity in disease pathobiology, independent of the TNF signalling pathway, and the existence of alternative TNF-independent cytokine signalling pathways might also contribute to the development of resistance to anti-TNF treatment. Indeed, apart from TNF, various studies have implicated the proinflammatory cytokine IL-23 in the pathogenesis of IBD.16–18 Polymorphisms in genes encoding the IL23R have been identified in genome-wide association studies and were linked to IBD pathogenesis.19 20 Functional studies in preclinical models of IBD underlined a regulatory role of IL-23 in gut inflammation. It was identified as the essential factor for development and perpetuation of chronic intestinal inflammation.21 22 Heightened mucosal expression of IL-23 was also demonstrated in patients with IBD, suggesting an important TNF-independent role in disease pathogenesis.23 24
Although the proinflammatory cytokine IL-23 has been associated to CD pathogenesis, the context-dependent functions of IL-23-mediated signalling in anti-TNF refractory mucosal inflammation have not been resolved yet. However, recently published data demonstrate that treatment with the selective IL-23 inhibitors risankizumab or MEDI2070 lead to markedly high response rates in the cohort of patients with CD that failed previous anti-TNF therapy.25 26 These findings suggest an important role for IL-23 in TNF-refractory intestinal inflammation. The aim of the current study was to characterise the functional role of IL-23 in this context. Specifically, we characterised the mucosal cytokine pattern and phenotype of intestinal T cells during anti-TNF therapy in CD. Our findings identify an involvement of apoptosis-resistant IL23R+TNFR2+ T cells in non-response to anti-TNF therapy in patients with CD.
Materials and methods
Patients
Intestinal biopsies or gut resections from patients with Crohn’s disease or controls were used for microarray, cell culture, RNA isolation or immunofluorescence studies. A total of 154 patients with CD (69 male, 85 female; age 18–82) and 18 control patients (13 male, 5 female; age 18–89) were included. Patients with CD were classified as responders to anti-TNF therapy, if they had ongoing anti-TNF therapy (infliximab or adalimumab) for over 3 months and a Simple Endoscopic Score for Crohn’s Disease (SES-CD)27 28 <5 during the endoscopic examination where the biopsy was taken. Non-response was defined by a SES-CD ≥5 to ongoing anti-TNF therapy (over 3 months), or if the surgical intestinal specimen used had a segmental SES-CD ≥5. The currently most accepted definition for endoscopic response in clinical trials is a reduction ≥50% of the SES-CD score.29 We were not able to apply this definition in our study as our patients often did not have an endoscopic examination prior to the initiation of anti-TNF therapy, as our analyses were not embedded in a controlled clinical trial setting. We could therefore not assess response based on the development of the SES-CD score during anti-TNF therapy. We instead had to take a SES-CD threshold to differentiate between responders and non-responders during ongoing anti-TNF therapy. As validated cut-off values for response are missing and as it has not yet been defined in how far SES-CD score changes represent clinically meaningful outcomes, we selected the CES-CD score of 4 as our threshold for response. In our opinion, this cut-off reflects the lowest level of acceptable mild endoscopic inflammation, which we would estimate to be a good indicator for therapeutic response on an endoscopic level. If clinical response to anti-TNF therapy was additionally defined as an evaluation criterion, the respective condition is stated in the text. Concomitant medication of the patients included 5-aminosalicylates, budesonide, corticosteroids, methotrexate, 6-mercaptopurine or azathioprine.
Peripheral blood mononuclear cells (PBMCs) were isolated from 62 patients with CD (27 male, 35 female; age 19–82) and 11 control patients (10 female, 1 male; age 29–54). Clinical and endoscopic characteristic of the analysed patients are described in online supplementary table 1.
Supplemental material
Samples were included in the study after obtaining prior written informed consent from each patient and sample collection was previously approved by the ethical committee and the institutional review board of the University of Erlangen-Nürnberg.
Isolation of RNA and quantitative real-time PCR
RNA was isolated from intestinal biopsies using the Nucleo Spin II kit (Macherey-Nagel, Düren, Germany). One microgram of RNA was reverse transcribed into cDNA (iScript; BioRad, München, Germany) according to the manufacturer’s instructions. For quantitative expression analysis, quantitect primers (Qiagen, Venlo, Netherlands) were used. The primer sequence for BATF has been described elsewhere.30 Data were normalised to the housekeeping gene Hprt and compared with a control group without mucosal inflammation in figure 1, or to the respective expression levels prior to the initiation of therapy within the same patient in figure 3.

Mucosal expression level of several cytokines, cytokine receptors and cytokine-inducing transcription factors in patients with Crohn’s disease (CD) prior to the initiation of anti-tumour necrosis factor (TNF) therapy. (A) Intestinal biopsies of the most inflamed area were taken from anti-TNF-naive patients with CD prior to initiation of anti-TNF therapy and qPCR was performed. Patients were stratified as responders (n=8) or non-responders (n=9–11) according to their subsequent clinical (Crohn’s Disease Activity Index reduction of >100 points at week 12) and endoscopic response (Simple Endoscopic Score for Crohn’s Disease <5 on follow-up endoscopy) to anti-TNF therapy with adalimumab. Data were normalised to the housekeeping gene Hprt and compared with a control group without mucosal inflammation. Every symbol represents a single patient. Median value is indicated as a line. **P≤0.01. Responders and non-responders did not show any significant differences in histological inflammatory activity prior to initiation of anti-TNF therapy. (B) Representative immunofluorescence staining for TNFR2, CD3 and isotype controls on intestinal cryosections from anti-TNF responders (n=8) and non-responders (n=7) before initiation of anti-TNF therapy. Scale bars represent 10 µm. Statistical analyses of the staining. 4–6 high power fields (HPFs) of each sample were analysed. Data represent mean values±SEM. *P≤0.05.

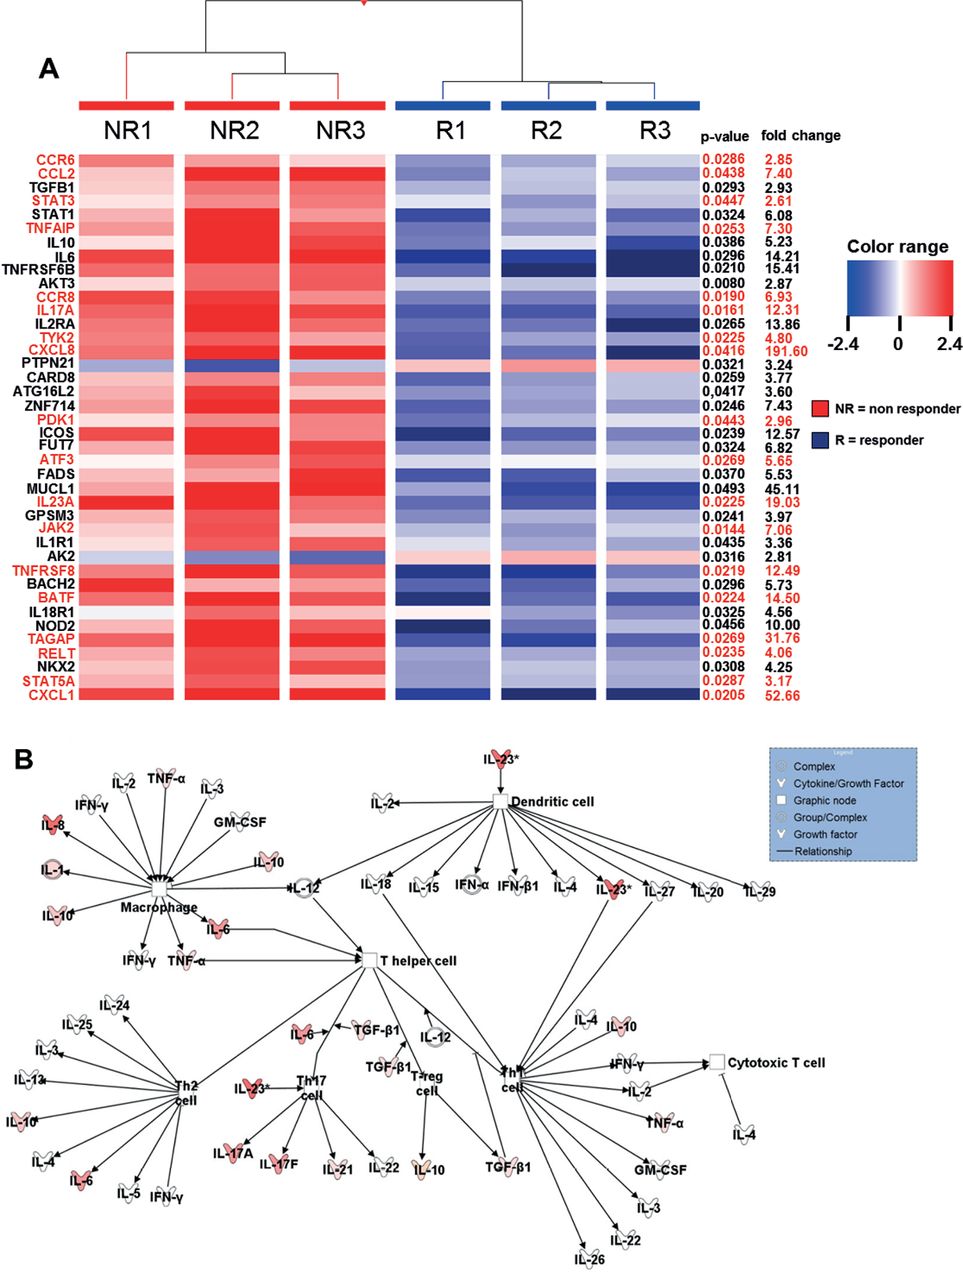
Heatmap of genes showing microarray based differential expression of IBD susceptibility and IL23R associated pathway genes during ongoing anti- TNF therapy (A) Gene expression profiles of isolated LPMCs from responders (n=3) and non-responders (n=3) to anti-TNF therapy in CD patients. Shown as a heat map are expression patterns of 40 IBD susceptibility genes and some genes which are additionally involved in IL23R signaling (in red) from microarray data, with the corresponding hierarchical clustering of the experimental conditions (responder or non-responder to anti-TNF therapy in CD patients). Results were corrected for multiple testing with the Benjamini-Hochberg correction. Pearson and Ward were used to compute hierarchical clustering of the experimental conditions. Expression data for each gene/row were normalized to the median expression value of the respective gene across all six samples. (B) Ingenuity Pathway Analysis of CD anti-TNF responders and non-responders during ongoing anti-TNF therapy showing the role of cytokines mediating communication between immune cells. The intensity of the color indicates the level of upregulation (red) or downregulation (green) of the respective cytokines in anti-TNF non-responders compared to anti-TNF responders.
Microarray experiments
RNA from intestinal biopsies of patients with CD was isolated as described before. Its integrity was verified using a Nano Chip (RNA 6000; Agilent Technologies) on a BioAnalyzer (vB.02.03 BSI307; 2100; Agilent Technologies) as recommended by the manufacturer’s protocol (RNA 6000 Nano Assay Protocol2). Sample labelling and preparation for microarray hybridisation was performed according to a standard protocol.31 The RNA replicates of three patients with CD with endoscopic response or non-response to anti-TNF therapy were each hybridised onto a 4×44 K array (design-ID 026652; Agilent Technologies). Data were extracted with the feature extraction software package (V.11.7.1; Agilent Technologies) using a standard protocol. The text files generated by the feature extraction software were imported into GeneSpring GX (V.12.5; Silicon Genetics). Data were log2 transformed followed by normalisation to the 75th percentile and corrected to the median of all samples. Features passing the quality check (flags detected in at least one condition) and showing changes in expression levels equal or more than twofold were selected for further analysis. A volcano plot was applied to identify statistically significant (p>0.05), more than twofold differentially expressed genes, between two conditions, including the Benjamini-Hochberg multiple test correction. Pearson and Ward were used to generate hierarchical clustering of the experimental conditions (responder or non-responder to anti-TNF therapy in patients with CD). The collected data are deposited in the Gene Expression Omnibus database under the accession number GSE111761.
Immunofluorescence
Cryo-frozen intestinal cross-sections were fixed with 4% paraformaldehyde (PFA) and stained using the TSA plus kit (Perkin Elmer, Baesweiler, Germany) according to the manufacturer’s instructions. Alternatively, slides were fixed with methanol at −20°C for 10 min, blocked with 10% fetal calf serum (FCS)/1% bovine serum albumin (BSA) for 1 hour and incubated overnight at 4°C with the primary antibody. Paraffin-embedded tissues were deparaffinised and antigen unmasking was performed using citrate buffer. After blocking, slides were incubated with TNFR2 (R&D, Minneapolis, Minnesota, USA), pSTAT3 (Cell Signalling, Leiden, Netherlands), CD3 (BD Biosciences, Heidelberg, Germany), Ki-67 (eBioscience, Frankfurt, Germany) or CD14 (Abcam, Cambridge, UK) antibodies. From each sample, 3–6 high power fields (HPF) per patient were analysed using ×10 objective magnification. For staining of active Caspase, the CaspACE FITC-VAD-FMK In Situ Marker (Promega, Mannheim, Germany) was used. TUNEL staining of PBMCs was performed with the TUNEL kit (Roche Diagnostics, Mannheim, Germany). Analysis of images was done with a fluorescence microscope (BZ-8100 or BZ-9000; Keyence, Neu-Isenburg, Germany) or a confocal microscope (LSM; Leica Microsystems, Wetzlar, Germany).
Isolation of human mononuclear cells from peripheral blood and lamina propria
Blood from patients with CD or controls was collected and PBMCs were isolated using density gradient centrifugation. Lamina propria mononuclear cells (LPMCs) from intestinal biopsies or gut specimen were isolated using the lamina propria kit (Miltenyi Biotec, Bergisch Gladbach, Germany) as previously described.14 CD4+ T cells were isolated with magnetic beads according to the manufacturer’s instructions (Miltenyi Biotec).
Cell culture and flow cytometry
Cells were cultivated in the presence of gentamycin and in some settings stimulated with anti-CD3/28 antibodies (BD Biosciences), 13 µg/mL infliximab (Centocor; Malvern, USA), 1.3 µg/mL anti-IL23p19 (R&D) or 13 ng/mL IL-23 (eBioscience). For IL-23 stimulation, cells were incubated with 1 µg/mL LPS (Sigma-Aldrich, Taufkirchen, Germany), 100 U/mL IFN-γ (eBioscience) and 0.001% heat-fixed Staphylococcus aureus cells (SACs) (Merck Millipore, Schwalbach, Germany). For apoptosis detection, the Annexin V/propidium iodide kit (eBioscience) was used. Prior to intracellular staining, cells were treated with a stimulation cocktail containing phorbol myristate acetate (PMA), Golgi-Stop and Ionomycin (eBioscience) for 4 hours at 37°C. Cells were fixed and permeabilised using a transcription factor buffer set (BD Biosciences). Cells were stained for TNFR2, RORγt (BD), CD4 (BD Biosciences or Miltenyi Biotec), CD15, CD11c, CD14, IL-10 (BioLegend), IL-17A, FoxP3, IFN-γ, Tbet (ebioscience), CD14, CD16, CD11c, CD15 (Miltenyi Biotec), Integrin α4 (MACS Miltenyi), Integrin β7 (BioLegend), IL-23p19 or IL23R (R&D) and respective isotype controls. FACS analysis was performed with FACS Calibur (BD Biosciences). Cells were analysed using the FlowJo single cell analysis software (TreeStar Ashland, USA). In some experiments, cells were stimulated for 72 hours with IL-23 (20 ng/mL), IL-6 (25 ng/mL) and/or TGF-β (10 ng/mL) (BD Biosciences), IL-12 (10 ng/mL) (Immunotools), IL-17 (10 ng/mL) (Immunotools), TNF (10 ng/mL) (eBioscience) and IL-21 (50 ng/mL) (eBioscience).
Intracellular signalling for activated STAT3
PBMCs were isolated as described before and erythrocytes were depleted. Next, CD4+ T cells were isolated with magnetic beads according to the manufacturer’s instructions (Miltenyi Biotec). CD4+ T cells were incubated in RPMI 1640 Glutamax (Gibco) supplemented with 100 µM β-mercaptoethanol (Life Technologies) for 60 min 37°C and then stained extracellularly for CD4. Afterwards, 1×10⁶ cells were taken up in 500 µL prewarmed RPMI 1640 GlutaMax (Gibco), supplemented with 100 U/mL penicillin/streptavidin (Gibco) and 10% FCS (Sigma) and incubated either with or without 20 ng/mL IL-23, 20 µg/mL anti-IL6 (BD Biosciences) and 2 µg/mL anti-IL22 (R&D) for 5 min at 37°C. Stimulation was stopped and cells were fixed by addition of cold 4% paraformaldehyde in phosphate buffered saline (PBS) and incubated for 10 min at room temperature. After a single wash with PBS, cells were permeabilised in 70% ice-cold methanol in PBS for 30 min on ice. The cells were then stained intracellularly for 30 min at room temperature with an antibody specific for phosphorylated STAT3 (pSTAT3) (BD Biosciences no. 557815) and analysed by flow cytometry.
In vitro intestinal organ culture
Intestinal biopsies (three per experimental procedure) from patients with CD were cultivated for 24 hours in a 24-well plate with 250 µL RPMI 1640 GlutaMax (Gibco) supplemented with 100 U/mL penicillin/streptavidin (Gibco) and 10% FCS (Sigma) per well. Biopsies were left untreated or 25 µg/mL infliximab (Centocor) or 25 µg/mL infliximab (Centocor) and 20 ng/mL IL-23 (eBioscience) were added. The 24-well plate with the biopsies were placed in an organ culture chamber (Billups Rothenberg) at 37°C with 95% O2/5% CO2 atmosphere. After the incubation period of 24 hours, LPMCs from the biopsies were isolated as described before and stained for IL23R (R&D), CD4 and TNFR2 (BD Biosciences) for flow cytometry analysis.
ELISA
ELISA was performed using the IL-23 ELISA kit (eBioscience). For determination of apoptosis, the cell death detection ELISA Plus kit (Roche Diagnostics) was used and sample results were calculated relatively to the unstimulated controls.
Statistical analysis
Statistical analysis was performed using GraphPad Prism (GraphPad Software, La Jolla, California, USA). After testing for normal distribution with the Shapiro-Wilk normality test, significant differences between samples were calculated using the unpaired Student’s t-test or the Mann-Whitney U rank test (*p≤0.05; **p≤0.01; ***p≤0.001). After testing for normal distribution, Spearman correlation was used to determine correlations of different markers (<0.2 corresponds to very low, <0.5 corresponds to low, <0.7 corresponds to medium, <0.9 corresponds to high and >0.9 corresponds to very high correlations). *p≤0.05; **p≤0.01; ***p≤0.001.
Results
CD responders to anti-TNF therapy display significantly higher expression of TNFR2+ intestinal T cells than non-responders prior to the initiation of therapy
To identify potential molecular markers for prediction of clinical response to anti-TNF therapy, we prospectively determined the expression of several cytokines, cytokine receptors and cytokine-inducing transcription factors by qPCR in mucosal biopsies from anti-TNF-naive patients with CD with clinically (CDAI >220) and endoscopically (SES-CD ≥5) active disease prior to the initiation of anti-TNF therapy. Patients were subsequently stratified into clinical responders, if their Crohn’s Disease Activity Index (CDAI) decreased ≥100 points after 12 weeks of anti-TNF therapy.8 Responders, moreover, had to have a SES-CD <5 in a follow-up endoscopy during ongoing anti-TNF therapy (3–23 months). As shown in figure 1A, anti-TNF responders had significantly increased mucosal TNFR2 mRNA expression compared with non-responders prior to therapy. Other markers, including markers of Th17 cells, did not differ between responders and non-responders (figure 1A). Blinded histopathological analysis showed no statistical differences regarding mucosal inflammation between responders and non-responders, excluding the possibility that increased TNFR2 expression in the former group was due to differences in inflammatory activity. Immunofluorescence staining of mucosal biopsies from the above patients confirmed significantly heightened TNFR2 expression on CD3+ T cells in anti-TNF responders as compared with non-responders before initiated anti-TNF therapy (figure 1B). In summary, these findings suggest TNFR2 expression on mucosal T cells as predictor of response to subsequent anti-TNF therapy.
IL23R signalling-dependent genes are significantly upregulated in CD non-responders compared with responders during ongoing anti-TNF therapy
We performed an array analysis regarding the differentiated gene regulation profiles in intestinal biopsies of endoscopic non-responders compared with responders during ongoing anti-TNF therapy in patients with CD. Response to anti-TNF therapy was defined as a SES-CD <5.
Within the cohort of CD-susceptible genes, there was a significant upregulation of genes that are associated with IL23R-dependent signalling pathways in anti-TNF non-responders compared with responders (figure 2A). Next, Ingenuity Pathway Analysis of the results was done regarding the expression profile of cytokines that mediate immune cell interaction. The intensity of the colour in the analysis diagram indicates the level of upregulation (red) or downregulation (green) of the respective cytokines in anti-TNF non-responders compared with responders during ongoing anti-TNF therapy. However, IL-23 could be identified as one of the most upregulated cytokines acting on T lymphocytes (figure 2B). Nevertheless, there was also an upregulation of various other cytokines in anti-TNF non-responders, indicating that further molecules and complex signalling pathways might be involved in mediating non-response in anti-TNF-treated patients.
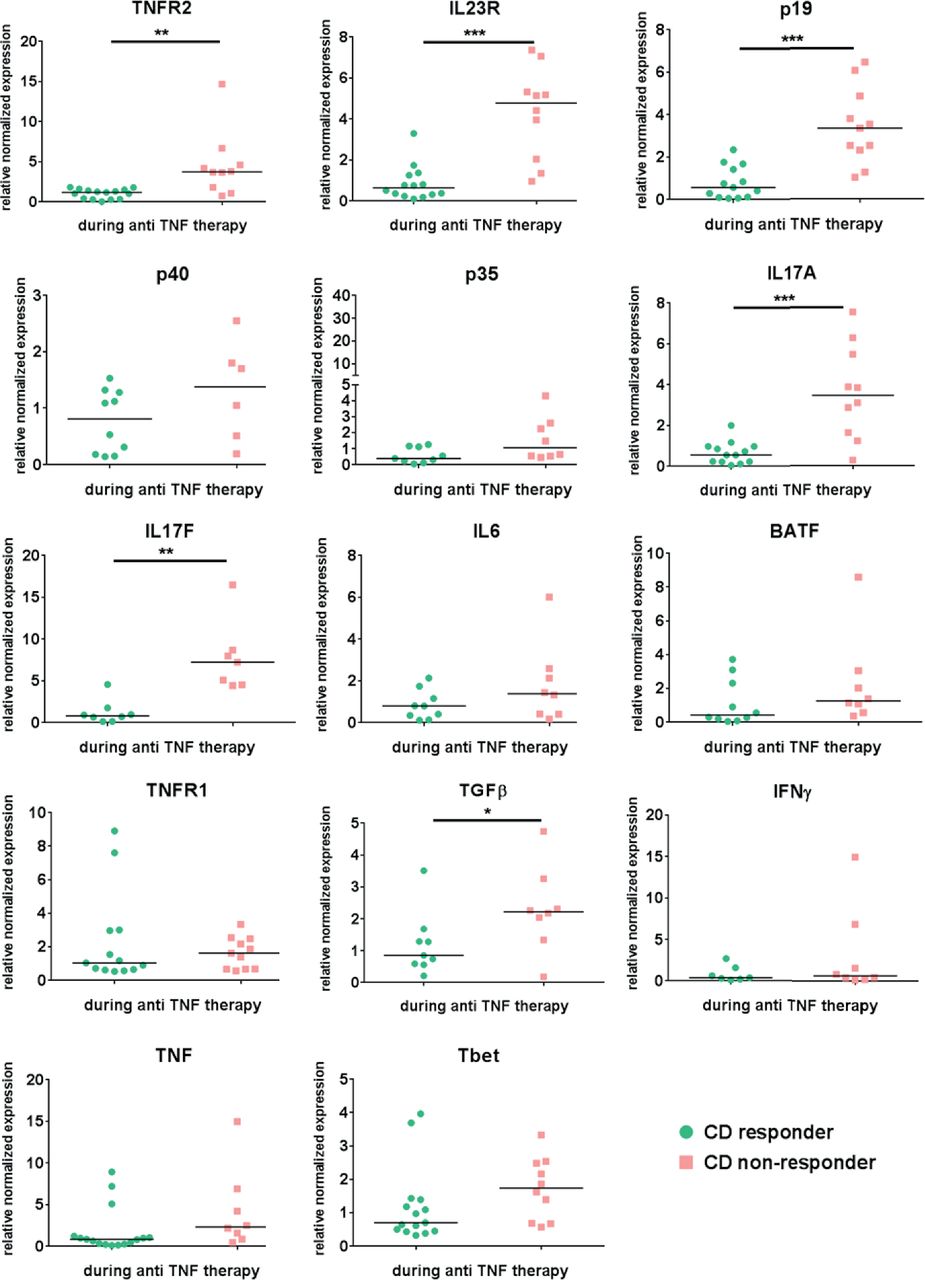
Next, we characterised the expression profiles of cytokines, cytokine receptors and cytokine-inducing transcription factors by qPCR in mucosal biopsies taken prior and during anti-TNF therapy in the same patient with CD. Patients were defined as responders or non-responders according to endoscopic criteria, as described above. This enabled analysis of paired data (baseline and maintenance) in the same cohort of responders and non-responders. In this context, anti-TNF-resistant patients showed significant upregulation of median mucosal TNFR2, IL23p19, IL23R and IL17A and TGFβ mRNA expression levels compared with responders during anti-TNF treatment (figure 3).

Mucosal expression level of several cytokines, cytokine receptors and cytokine-inducing transcription factors in Crohn’s disease patients during ongoing anti-TNF therapy Mucosal biopsies were taken from the same CD patient prior and during initiated anti- TNF. Response to anti-TNF therapy was defined as a SES-CD <5 during the endoscopic examination where the biopsy was taken under ongoing anti-TNF treatment. Quantitative RT-PCR analysis of the intestinal biopsies from responders (n=7-16) and non-responders (n=6-11) was performed. Data were normalized to the housekeeping-gene Hprt and compared to the respective expression level prior to the initiation of anti-TNF therapy in each single patient. Gene expression is shown as fold induction. Every symbol represents a single patient. Median value is indicated as a line *P≤0.05.; **P≤0.01, ***P≤0.001.
TNFR2 and IL23R as well as IL17A and IL23R levels correlated significantly with each other in both responders and non-responders but higher in the group of non-responders. There was a significant correlation between the subunits p19 and p40 as well as p19 and IL17A in both groups, although correlation between p19 and IL17A was higher in non-responders (online supplementary figure 1).
Supplemental material
Intestinal TNFR2+IL23R+ T cells display a mixed Th1/Th17-like phenotype in patients with CD
To further characterise the role of TNFR2 and IL23R on mucosal T cells, we performed a comparative analysis of control and inflamed tissue from patients with CD. This analysis revealed that TNFR2 expression was significantly higher in CD, whereas IL23R was not (figure 4A). Intestinal TNFR2+ cells displayed significantly heightened expression of IL23R, IFN-γ and IL-17A compared with TNFR2− cells on T-cell-enriched mucosal cells of patients with CD (figure 4B). Consistently, TNFR2+IL23R+ T cells displayed significantly higher co-expression of IFN-γ and IL-17A (figure 4C left panel), and of Tbet and RORγt (figure 4C right panel) compared with TNFR2-IL23R− T-cell subtypes, indicating that TNFR2+IL23R+ cells display a mixed Th1/Th17-like phenotype in patients with CD. Altogether, these findings suggest that IL23R is expressed on a subpopulation of mucosal TNFR2+ T cells that is characterised by dual production of IFN-γ and IL-17A.

Molecular characterisation of mucosal TNFR2+IL23R+ cells in patients with Crohn’s disease (CD). (A) Flow cytometric analysis of TNFR2 and IL23R cell expression in lamina propria mononuclear cells from intestinal tissue of control patients (CON; n=7) and patients with CD with active mucosal inflammation (CD; n=9–14). (B) Quantitative expression analysis of IL23R, IFN-γ and IL-17A in TNFR2+ and TNFR2− intestinal cells from patients with CD (n=22–33). Isolated mucosal cells were analysed by flow cytometry using a lymphocyte gate. (C) Flow cytometric expression analysis of intestinal cells from patients with CD, which express IFN-γ+IL17-A+ or Tbet+RORγt+ cells within T cells that showed expression of either TNFR2, IL23R, both or none of these receptors (n=9–10). Representative FACS plots of the analyses of the above-described expression profiles of intestinal cells from patients with CD are shown. Data represent mean values±SEM. *p≤0.05; **p≤0.01; ***p≤0.001.
Accumulation of TNFR2+IL23R+ T cells in the mucosa of anti-TNF-resistant patients with CD
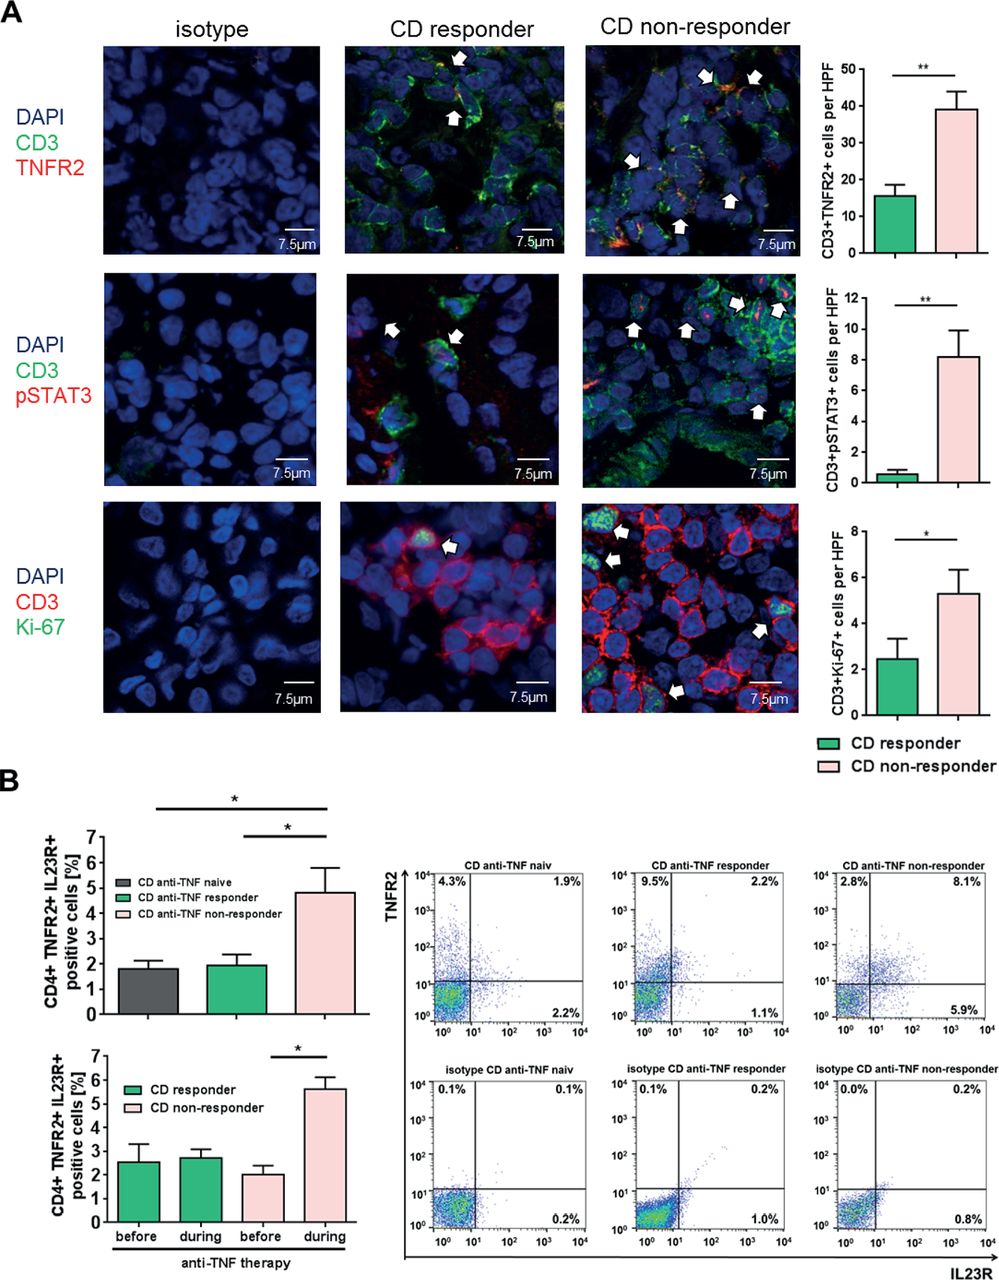
To quantify the number of TNFR2+ and IL23R+ T cells in anti-TNF endoscopic non-responders and responders, we performed immunofluorescence staining and FACS analysis of intestinal biopsies from patients with CD. Patients with CD refractory to ongoing anti-TNF treatment exhibited significantly increased numbers of TNFR2+CD3+ mucosal T cells as compared with anti-TNF responders (figure 5A). Furthermore, there was a significant increase of intestinal T cells expressing activated pSTAT3 in anti-TNF non-responders as compared with responders. There was also a significant elevation of Ki-67-expressing T cells, indicative of heightened T-cell proliferation in non-responders compared with responders (figure 5A).

Expression of TNFR2, IL23R, pSTAT3 and Ki-67 in anti-tumour necrosis factor (TNF)-treated patients with Crohn’s disease (CD). (A) Immunofluorescence staining for TNFR2, pSTAT3, Ki-67 and CD3 was performed with cryosections from intestinal biopsies of responders (n=8) and non-responders (n=10–12) to anti-TNF therapy in patients with CD. Scale bars represent 7.5 µm. Positive cells were counted in 4–6 high power fields (HPFs) per slide. Statistical analyses of double-positive cells are shown. (B) Flow cytometric analysis regarding the expression of mucosal TNFR2+IL23R+CD4+ lymphocytes in the intestinal tissue of anti-TNF-naive patients with CD with mucosal inflammation (n=14), as well as responders (n=13) and non-responders (n=16) to anti-TNF therapy patients (upper left panel). Frequencies of TNFR2+IL23R+ T cells before and during anti-TNF treatment in the same patient for anti-TNF responders (n=3) and non-responders (lower left panel). Representative FACS plot images are shown for anti-TNF responders, non-responders and naive patients and the respective isotype control. CD4+ cells were gated and the rate of TNFR2+IL23R+ cells assessed (right panel). Data represent mean values±SEM. *p≤0.05; **p≤0.01.
To test whether the increase of pSTAT3 expressing T cells might be associated with elevated levels of IL-23, CD4+ PBMCs from patients with CD were treated with IL-23 and pSTAT3 was analysed via FACS. IL-23-stimulated CD4+ T blood cells from patients with CD showed a significant upregulation of activated pSTAT3 in comparison to untreated cells. To rule out the possible influence of other cytokines on our experimental setting, we additionally applied antibodies against IL-6 and IL-22 to the IL-23-treated cells. We were able to show that inhibition of IL-6 or IL-22, as well as IL-6 and IL-22 together, could not downregulate the heightened pSTAT3 expression of IL-23-treated peripheral blood cells (online supplementary figure 2). Nevertheless, this analysis does not rule out that other cytokines in the milieu might also be involved in the observed overexpression of pSTAT-3.
Finally, FACS analysis revealed a significant increase of mucosal TNFR2+IL23R+ expressing CD4+ T cells in anti-TNF non-responders as compared with anti-TNF responders and anti-TNF-naive patients with CD (figure 5B upper panel). We next analysed if there is an expansion of these cells in anti-TNF non-responders. The frequency of TNFR2+IL23R+ T cells was therefore analysed prior and during anti-TNF therapy in the same patient. We were able to demonstrate that there was a statistically significant increase of TNFR2+IL23R+ T cells only in anti-TNF non-responders, but not in responders. These results suggest that TNFR2+IL23R+ T cells selectively expand and accumulate in the mucosa of anti-TNF non-responders on anti-TNF treatment (figure 5B lower panel). Additional analysis indicated that the increase of TNFR2+IL23R+ T cells was independent of primary or secondary non-response to therapy (online supplementary figure 3a), or infliximab versus adalimumab treatment (online supplementary figure 3b). There was no statistical difference in the meantime of exposure to anti-TNF therapy between responders and non-responders (online supplementary table 1).
Supplemental material
Expansion of IL-23 mediated gut-tropic IL23R+TNFR2+CD4+ T cells in patients with CD
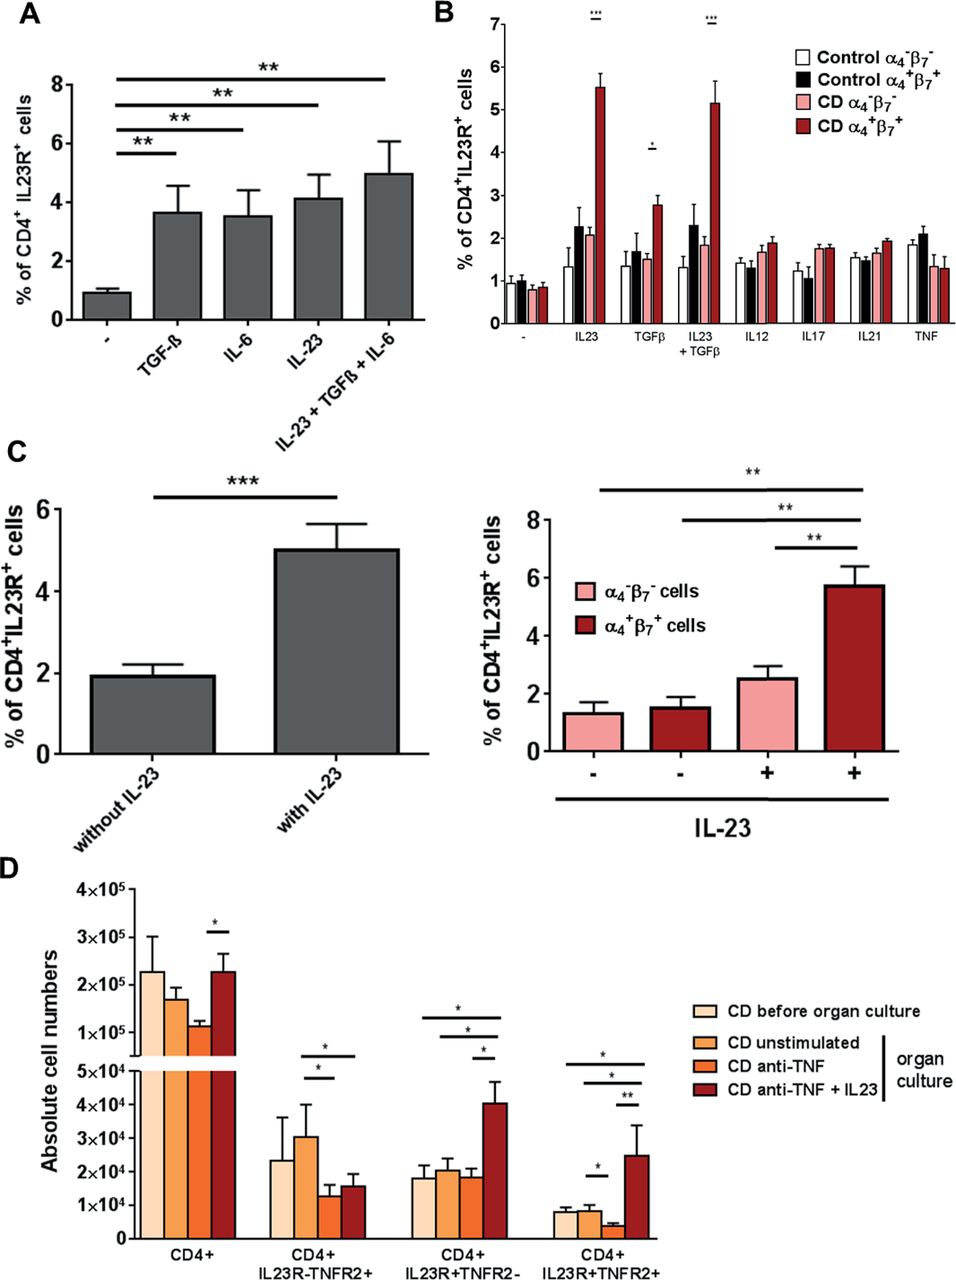
We then explored the functional role of IL-23 in intestinal T cells in CD. We first investigated the possibility that IL-23 might induce IL23R expression in mucosal CD4+ T cells, as IL-23 was found to induce IL23R in human blood T cells.32 We therefore stimulated LPMCs of patients with CD with TGF-β, IL-6 or IL-23 or a combination of all three cytokines, and analysed IL23R expression by FACS. Stimulation with TGF-β, IL-6 or IL-23 alone or simultaneously led to a significantly higher expression of IL23R compared with unstimulated cells (figure 6A).

Significant upregulation of gut-tropic α4+β7+CD4+IL23R+ T cells on IL-23 application. (A) CD4+ lamina propria mononuclear cells from patients with Crohn’s disease (CD) (n=10) were isolated with magnetic beads and left untreated or stimulated for 72 hours with TGF-β, IL-6 or IL-23 or a combination of all three cytokines. Expression of the IL23R on CD4+ cells was determined by FACS analysis. (B) CD4+ peripheral blood mononuclear cells from healthy controls (n=6) or patients with CD (n=13) were isolated with magnetic beads and left untreated or stimulated for 72 hours with TGF-β, IL23, a combination of both cytokines, IL12, IL17, IL21 or TNF. Expression of the IL23R on CD4+ cells among α4−β7− or α4+β7+ cells was determined by FACS analysis. (C) Whole intestinal biopsies from patients with CD were cultivated for 24 hours in an organ culture chamber at 37°C with 95% O2/5% CO2 atmosphere. Biopsies were untreated (n=10) or stimulated with 20 ng/mL IL-23 (n=10). Expression of the IL23R on CD4+ cells among α4−β7− or α4+β7+ cells was determined via flow cytometry. (D) Whole intestinal biopsies from patients with CD were cultivated for 24 hours in an organ culture chamber at 37°C with 95% O2/5% CO2 atmosphere. Biopsies were untreated, stimulated with 25 µg/mL anti-TNF antibody or 25 µg/mL anti-TNF antibody plus 20 ng/mL IL-23. Expression of CD4, IL23R and TNFR2 was determined via flow cytometry. Data represent mean values±SEM. *p≤0.05; **p≤0.01; ***p≤0.001.
We next analysed whether the heightened expression of IL23R on CD4+ T cells after above-described cytokine stimulation is restricted to patients with CD and in how far this process is gut and cytokine specific. CD4+ PBMCs from healthy controls or patients with CD were stimulated with various cytokines and IL23R expression on CD4+ blood T cells was analysed by FACS. Cells were additionally stained for the expression of the gut-specific integrins α4β7. Analysis revealed that α4+β7+CD4+ T cells showed significant higher expression of IL23R only after stimulation with IL-23 or TGF-β or simultaneous application of both in patients with CD. These significant changes of IL23R expression in patients with CD could not be observed in blood cells that did not express the gut-specific integrins α4β7 or in any blood cells from healthy controls. Furthermore, stimulation with IL-12, IL-17, IL-21 or TNF did not change the IL23R expression in any of the analysed settings. Significant upregulation of IL23R could therefore only be found after application of IL-23 or TGF-β, as well as IL-23 and TGF-β in gut tropic T cells from patients with CD (figure 6B).
To further evaluate whether augmented levels of IL-23 led to expansion of IL23R on mucosal CD4+ T cells of patients with CD, we administered IL-23 to intestinal organ cultures. Again, a significant higher expression of IL23R on CD4+ T cells compared with unstimulated controls could be observed (figure 6C left panel). Expression was also gut tropic as only α4+β7+CD4+ T cells showed significantly increased IL23R expression after stimulation with IL-23 (figure 6C right panel).
Next, the effects of IL-23 administration regarding the expression of CD4+IL23R+TNFR2+ T cells in intestinal organ cultures from patients with CD were tested in the setting of anti-TNF antibody application. Mucosal biopsies from patients with CD were treated with an anti-TNF antibody alone or in combination with IL-23 or left untreated. Application of anti-TNF together with IL-23 led to a significant increase in the absolute cell number of CD4+TNFR2+IL23R+ and CD4+TNFR2−IL23R+ cells. There was no accumulation of CD4+ T cells that were negative for IL23R. Moreover, CD4+TNFR2+IL23R− showed significant reduced absolute cell numbers after anti-TNF treatment (figure 6D). Administration of IL-23 to anti-TNF antibody treated mucosal organ cultures from patients with CD therefore led to an expansion of CD4+IL23R+TNFR2+ mucosal cells.
CD14+ intestinal macrophages are the main producers of IL-23 in patients with CD refractory to anti-TNF therapy
To explore potential mechanisms of activation of TNFR2+IL23R+ cells, we analysed production of IL-23 in patients with CD. We were initially able to show that IL-23 production could be induced by LPS, SAC and IFN-γ in cultured PBMCs from patients with CD (figure 7A). Furthermore, cultivated LPMCs from patients with CD exhibited significantly higher IL-23 production than those from control patients (figure 7B), indicating that differences in IL-23 production were present in the mucosal immune compartment.

IL-23 production of blood and intestinal cells of patients with Crohn’s disease (CD). (A) Peripheral blood mononuclear cells from patients with CD (n=16) were untreated or stimulated overnight with LPS, IFN-γ and SAC. IL-23p19 levels were assessed in the supernatant of the cultivated cells. (B) IL-23p19 concentration in the supernatant of cultured lamina propria mononuclear cells (LPMCs) of controls (n=10) and patients with CD (n=7). (C) Quantitative analyses of IL-23p19 expressing CD14+ LPMCs of controls (n=8), anti-tumour necrosis factor (TNF)-naive patients (n=6), anti-TNF responders (n=8) or anti-TNF non-responders (n=10) in patients with CD (upper left panel). Quantitative analyses of IL-23p19 expressing CD16+, CD11c+ and CD15+ LPMCs of controls (n=8), anti-TNF responders (n=8) or anti-TNF non-responders (n=10) in patients with CD (lower left panel). Representative FACS analysis images of intestinal CD14+ macrophages from controls, responders and non-responders that express IL-23p19 (right panel). (D) Representative immunofluorescence staining for CD14 and isotype controls on intestinal paraffin-embedded sections from CD anti-TNF responders (n=5) and non-responders (n=7) before initiation of anti-TNF therapy. 3–6 high power fields (HPFs) of each sample were analysed using ×40 objective magnification. Scale bars represent 5 µm. Statistical analyses of the staining data represent mean values±SEM. *p≤0.05; **p≤0.01; ***p≤0.001.
Further analysis demonstrated that intestinal CD14+ macrophages express significantly more IL-23p19 in CD endoscopic non-responders in comparison to responders of ongoing anti-TNF therapy, anti-TNF-naive patients or controls (figure 7C upper panel). In comparison, we could not observe that CD16+, CD11c+ or CD15+ cells from anti-TNF non-responders were likewise able to express higher levels of IL-23p19 in comparison with controls or anti-TNF responders (figure 7C lower panel).
In addition, we detected a significantly higher amount of CD14+ macrophages in anti-TNF non-responders compared with responders in intestinal biopsies taken prior to the initiation of anti-TNF therapy (figure 7D). Response was defined by a decreased CDAI ≥100 points after 12 weeks of anti-TNF therapy and a SES-CD <5 in a follow-up endoscopy during ongoing treatment (3–23 months).
IL-23 inhibits anti-TNF-induced apoptosis in lamina propria T cells from patients with CD
As the previous experiments demonstrated that patients with anti-TNF refractory CD have an accumulation of IL23R+TNFR2+ expressing T-cell populations in the mucosa, we analysed the functional relevance of IL-23 in anti-TNF-induced mucosal cell apoptosis. Accordingly, T-cell-enriched LPMCs from patients with CD were cultivated with or without IL-23 and antibodies against TNF and IL-23, followed by FACS analysis. Administration of anti-TNF or anti-IL23p19 antibodies induced apoptosis after 72 hours. Moreover, addition of recombinant IL-23 abrogated anti-TNF-induced apoptosis and also resulted in significantly less apoptotic cells compared with untreated LPMCs (figure 8A). Further analysis indicated that addition of IL-23 was able to significantly reduce the percentage of apoptotic blood CD4+ T cells in vitro as well (figure 8B). Titration studies showed that IL-23 concentrations of 10–50 ng/mL were capable to reduce CD4+ T-cell death (figure 8C).

Influence of anti-tumour necrosis factor (TNF) and IL-23 treatment on the induction of apoptosis in blood and mucosal cells. (A) CD4+ lamina propria mononuclear cells (LPMCs) from patients with CD (n=15) were isolated, stimulated for 72 hours with anti-CD3/28 antibodies and treated with an anti-TNF or anti-IL23p19 antibody or an anti-TNF antibody in combination with recombinant IL-23. Cell apoptosis was analysed via flow cytometry analysis and CD4+ Annexin V-positive/propidium iodide-negative cells were used for analysis of apoptosis cells. Representative FACS images of treated LPMCs are shown. (B) CD4+ blood cells from patients with CD (n=15) were untreated or treated with IL-23 for 24 hours. Cell apoptosis was determined using TUNEL staining. TUNEL-positive cells per 100 cells were quantified and 5 high power fields (HPFs) per sample were analysed. Scale bars represent 10 µm. (C) CD4+ peripheral blood mononuclear cells from patients with CD were isolated (n=6) and the cells were untreated or treated with IL-23 in various concentrations (10–50 ng/mL) for 24 hours. Cell apoptosis was analysed using the cell death ELISA detection kit. (D) Cryosections of intestinal biopsies from patients with CD under ongoing anti-TNF therapy were stained for CD4 and active Caspase and the double-positive cells among CD4+ T cells were determined. Patients were stratified as responders (n=7) or non-responders (n=14) according to their Simple Endoscopic Score for Crohn’s Disease during ongoing anti-TNF therapy. 4–5 HPFs per slide were analysed. Scale bars represent 10 µm. Data represent mean values±SEM. *p≤0.05; **p≤0.01; ***p≤0.001.
In a final series of studies, we analysed apoptosis rates of intestinal CD4+ T cells in patients under ongoing anti-TNF therapy. Biopsies from patients with CD were histologically stained for CD4 and active caspase and the ratio of double-positive cells among CD4+ T cells was determined. These studies revealed that the apoptosis rate of mucosal CD4+ T cells was significantly higher in the group of endoscopic anti-TNF responders as compared with non-responders (figure 8D).
Discussion
Despite its remarkable therapeutic capacities, anti-TNF therapy is effective in subgroups of patients with CD only.7 In this study, we characterised underlying molecular mechanisms that lead to anti-TNF-resistant patients with CD. We observed that mucosal TNFR2-expressing CD4+ T cells may overcome anti-TNF-induced apoptosis through co-expression of the IL23R, which is activated by upregulated IL-23 production of mucosal CD14+ macrophages. Mucosal CD4+ T cells express the activated anti-apoptotic protein pSTAT3 after IL-23 stimulation and produce marked amounts of both Th1 and Th17 cytokines. They accumulate in the mucosa of patients with anti-TNF refractory CD where they perpetuate chronic intestinal inflammation through IL-23 stimulation (figure 9). These findings identify IL-23 as a promising molecular target for therapy in anti-TNF refractory patients with CD.

Model of IL-23-mediated resistance to apoptosis of mucosal CD4+ T cells in anti-tumour necrosis factor (TNF) refractory Crohn’s disease (CD). In responders to therapy, anti-TNF antibodies bind to mTNF-expressing CD14+ macrophages, thereby inhibiting activation of the TNFR2 on mucosal CD4+ T cells. The resulting blockade of TNFR2-dependent signalling pathways finally leads to the indirect induction of apoptosis in intestinal CD4+ T cells in CD. In anti-TNF refractory patients, TNFR2 bearing gut CD4+ T cells additionally express the IL23R. Heightened production of IL-23 from CD14+ macrophages leads to binding to the IL23R on CD4+TNFR2+ T cells and induction of STAT3 activation, thereby augmenting T-cell resistance to apoptosis that overcomes the induction of apoptosis by anti-TNF antibodies.
Although various studies have addressed potential mechanisms of action of anti-TNF antibodies in IBD, the molecular pathways that may drive anti-TNF resistance are still poorly understood.14 33 34 Regarding immunological markers, a pharmacogenomic apoptotic index has been proposed as predictor to anti-TNF response in CD.35
In our experiments, we were able to show that heightened pretreatment TNFR2 expression in mucosal T cells is associated with higher response rates to following anti-TNF therapy. TNFR2 on mucosal T cells is activated by mTNF to suppress T-cell apoptosis and is therefore suggested to be crucial for the subsequent therapeutic effects of anti-TNF antibodies.14 36–38 The observed relevance of TNFR2 expression in intestinal T cells is in line with a report that shows that TNFR2 overexpression in T cells aggravates experimental colitis and with the observation that mucosal TNFR2+CD4+ T cells are key targets for efficient anti-TNF therapy.14 39 Finally, the presence of mTNF on mucosal cells by in vivo imaging was shown to predict clinical response to subsequent anti-TNF therapy in CD, further implying that the mTNF/TNFR2 signalling pathway represents a crucial target of anti-TNF therapy.40 Although the regulators of TNFR2 expression in the mucosa remain to be determined, it has so far been described that cytokines and components of the microflora are involved in the tight regulation of TNFR2 expression.41–43
To better understand the underlying inflammatory mechanisms in anti-TNF refractory patients with CD, previous studies determined cytokine levels in the inflamed mucosa. A study using whole-genome transcriptional analysis showed increased expression of IL1B, IL17A and S100A8 in anti-TNF non-responsive patients with CD, but also suppression of IL-6 and IL-23p19 levels in all anti-TNF-treated patients, regardless of their response to therapy. The regulation of these genes in non-responders supports the possibility of a redundant role of these mediators in maintaining inflammation, at least in anti-TNF non-responders.44 Another recent publication indicated upregulated expression of oncostatin M during anti-TNF therapy in non-responsive patients with UC,45 and we were able to confirm these data in our cohort of patients with CD (data not shown). Another study in UC reported significant reduction of mucosal IL-6 mRNA levels in therapy responders but not in non-responders.46 Similarly, we showed significantly higher expression of IL-6 mRNA in anti-TNF refractory patients compared with responders. Moreover, various markers of Th17 cells were augmented in the former patients. Finally, we noted a significant induction of IL-23p19 mRNA and augmented IL-23 production by intestinal macrophages in anti-TNF refractory patients, suggesting the presence of an IL-23-driven T-cell response.
Further characterisation of mucosal T cells within the cohort of anti-TNF refractory patients revealed the expansion of a unique TNFR2+IL23R+ T-cell subset on initiated anti-TNF therapy, which could not be found in anti-TNF-naive or non-responsive patients. This subset showed a mixed Th1/Th17-like phenotype with heightened IL-17A, IFN-γ and IL23R expression and expression of the Th1-associated and Th17-associated transcription factors Tbet and RORγt. The existence of IL-17A and IFN-γ dual producing T lymphocytes has been previously reported in human IBD and other chronic inflammatory and autoimmune disorders such as multiple sclerosis.47–49 However, the concomitant expression of RORγt and Tbet in these cells suggested that their Th1/Th17 cytokine profile is determined at the transcriptional level. As the dual producing TNFR2+IL23R+ T cells expressed IL23R, it is likely that they may directly respond to IL-23 stimulation. Indeed, in experimental transfer colitis, IL-23 was essential for colitis development and the generation of IL-17A+/IFN-γ+ mucosal T cells through IL23R signalling.22
We next investigated the cellular source of IL-23 in anti-TNF refractory patients. Intestinal CD14+ macrophages from anti-TNF-resistant patients had higher levels of IL-23 as compared with responders and anti-TNF-naive patients. These results are consistent with a previous study that identified CD14+ macrophages as potent producers of IL-23 in CD.50 Further studies showed that significantly elevated numbers of mucosal CD14+ macrophages were already present in non-responders prior to the initiation of anti-TNF therapy, thereby representing a potential biomarker for IL-23-driven anti-TNF refractory disease in patients with IBD. In contrast to another study, however, we could not identify tissue-infiltrating CD15+ neutrophils as producers of IL-23 possibly due to the fact that that study was conducted in children with newly diagnosed IBD as compared with adult patients in the present study.51
Upregulated mucosal IL23R expression in patients with IBD with active inflammation was described in previous studies, although responsiveness to anti-TNF therapy was not addressed.23 24 We could demonstrate that upregulation of the IL23R on mucosal T cells in vitro is induced by a combination of the Th17-inducing or Th17-perpetuating cytokines TGF-β and IL-23, which were all upregulated in patients with CD resistant to anti-TNF therapy. It was described that IL23R upregulation in human blood T cells can be induced by IL-23 alone.32 Naive T cells are furthermore known to upregulate IL23R after IL-6 treatment.52 Additional studies demonstrated that mucosal T cells in anti-TNF non-responders express higher amounts of pSTAT3 compared with responders. This is in accordance with a predominant Th17-like cytokine milieu, as IL-23 signalling is mediated mainly through STAT3, which is essential for the development of Th17 cells.53 Nevertheless, other cytokines might additionally be involved in the process of STAT-3 induction.
As previous studies revealed that activated STAT3 drives T-cell resistance against apoptosis in IBD, our findings suggest that expanded T cells in anti-TNF non-responders are resistant against T-cell death via IL-23.54 In agreement with this concept, we could demonstrate that anti-TNF-induced apoptosis of T-cell-enriched mucosal cells from patients with CD could be completely suppressed by IL-23 in vitro. Moreover, the reduction of mucosal T-cell apoptosis in anti-TNF refractory patients observed on immunofluorescence indicated enhanced T-cell resistance to apoptosis in these patients as compared with responders in vivo. Taken together, these findings suggested that high levels of IL-23 drive resistance of TNFR2+ mucosal T cells in anti-TNF non-responders via IL23R signalling and STAT3 activation and that IL-23 blockade may be effective in anti-TNF non-responders. Limitations of our study include small sample size and different ranges of endoscopic response assessment.
Recently published trials showed that risankizumab and MEDI2070, specific inhibitors for IL-23 p19, were remarkably effective in anti-TNF refractory patients with CD. Although these studies did not compare response rates between anti-TNF-naive and anti-TNF-experienced patients, these findings underline our concept that IL-23 blockade is effective in anti-TNF refractory CD. Furthermore, high serum baseline serum concentrations of Th17 cytokines such as IL22, a cytokine whose expression is induced by IL-23, were associated with greater likelihood of response to MEDI2070, suggesting that high expression of the target molecule might predict response to therapy, a mechanism similarly observed for mTNF in anti-TNF-treated patients.25 26 55 This indicates that shifts in the activation of the inflammatory IL-23/Th17 pathway following anti-TNF therapy may primarily account for IL-23 inhibition-mediated therapeutic efficacy in anti-TNF refractory patients. In concordance, we could identify IL-23 as the driver for the expansion of CD4+IL23R+TNFR2+ cells and resistance to anti-TNF therapy in intestinal organ cultures. As IL-23 induces the production of various proinflammatory cytokines by T cells such as IL-17A/F, IL-6 and TNF, our findings also suggest that blockade of IL-23 rather than blockade of IL-6 or IL-17A/F alone may be effective in anti-TNF refractory CD.56 Conversely, our findings implicate that blockade of IL-23 function may enhance efficacy of anti-TNF therapy in IBD. However, the observed lower response rate of anti-TNF-experienced versus anti-TNF-naive patients with CD on combined IL-12/IL-23 blockade via the p40 inhibitor ustekinumab requires further investigations.
In agreement with this concept, a recent study indicated that homozygous carriers of IBD risk-increasing IL23R variants were more likely to respond to anti-TNF therapy than homozygous carriers of IBD risk-decreasing IL23R variants.55 This might be due to the recent description that particular IL23R variants confer decreased populations of IL-23 responsive T cells and attenuated signalling via the IL23R and diminished STAT3 activation, making them largely unresponsive to IL-23 signalling.57
Our findings indicate that expansion of apoptosis-resistant TNFR2+IL23R+ T cells drives resistance to anti-TNF therapy in CD. The identification of these dual IFN-γ-producing and IL-17-producing T cells demonstrates the fluidity of the cytokine network in CD, as these cells apparently develop via an IL-23-driven compensatory inflammatory pathway on blockade of TNF. This scenario is reminiscent of some well-recognised resistance mechanisms to chemotherapeutic agents such as activation of alternative signalling pathways to increase apoptosis resistance on therapy induction.58 Our results suggest that such resistance mechanisms may also exist in anti-TNF refractory patients with CD and need to be considered in future therapeutic approaches. These findings identify IL-23 as a suitable molecular target in the cytokine network of patients with CD with resistance to anti-TNF therapy.
Supplemental material
Acknowledgments
The authors thank R Spiegl, L Sologub, M Rakhimova, I Zöller-Utz, F Stütz, P Drummer and G Göhring-Waldeck for excellent technical assistance. We thank the endoscopy unit at the First Department of Medicine, Universität Erlangen, for providing us with samples required to conduct this study. We are indebted to our patients for their participation.
References
Footnotes
RA and MFN share senior authorship.
Contributors HS, UB, WD, TR, SS, SR, SH, KH, MJW, JM, AH, RG, CN, TM, MFN and RA provided reagents, protocols, samples or designed experiments; HS, UB and WD performed experiments; HS, UB, MFN and RA designed the study, analysed, discussed, interpreted data and wrote the manuscript; MFN and RA directed the work.
Funding This study was supported by the Deutsche Forschungsgemeinschaft (CRC1181 Project C02) to HS, CN and RA; KFO257 to MFN and RA, by a research operating grant from the International Organization for the Study of Inflammatory Bowel Diseases to MFN and RA, and by the Emerging Fields Initiative of the University Erlangen-Nürnberg to MFN and RA. The Heisenberg Professorship of RA is funded by the Deutsche Forschungsgemeinschaft.
Competing interests MFN provided expert scientific advice or received funding from the following companies: Boehringer, Giuliani Pharma, PPD, Sterna, Janssen, Schering-Plough, Essex, UCB, Abbott, Abbvie, Falk, Pentax. RA provided expert scientific advice or received funding from the following companies: Abbvie, Janssen.
Patient consent Not required.
Ethics approval Ethical Review Committee of the Friedrich-Alexander-University Erlangen-Nürnberg, Germany.
Provenance and peer review Not commissioned; externally peer reviewed.
Correction notice This article has been corrected since it published Online First. The shared senior authorship statement has been added.
Presented at Part of this work was presented at Digestive Disease Week (DDW) in Chicago (2017), United European Gastroenterology Week in Barcelona (2017) and Congress of European Crohn’s and Colitis Organisation (ECCO) in Vienna (2018).