Article Text

Abstract
Objective The consumption of fruits is strongly associated with better health and higher bacterial diversity in the gut microbiota (GM). Camu camu (Myrciaria dubia) is an Amazonian fruit with a unique phytochemical profile, strong antioxidant potential and purported anti-inflammatory potential.
Design By using metabolic tests coupled with 16S rRNA gene-based taxonomic profiling and faecal microbial transplantation (FMT), we have assessed the effect of a crude extract of camu camu (CC) on obesity and associated immunometabolic disorders in high fat/high sucrose (HFHS)-fed mice.
Results Treatment of HFHS-fed mice with CC prevented weight gain, lowered fat accumulation and blunted metabolic inflammation and endotoxaemia. CC-treated mice displayed improved glucose tolerance and insulin sensitivity and were also fully protected against hepatic steatosis. These effects were linked to increased energy expenditure and upregulation of uncoupling protein 1 mRNA expression in the brown adipose tissue (BAT) of CC-treated mice, which strongly correlated with the mRNA expression of the membrane bile acid (BA) receptor TGR5. Moreover, CC-treated mice showed altered plasma BA pool size and composition and drastic changes in the GM (eg, bloom of Akkermansia muciniphila and a strong reduction of Lactobacillus). Germ-free (GF) mice reconstituted with the GM of CC-treated mice gained less weight and displayed higher energy expenditure than GF-mice colonised with the FM of HFHS controls.
Conclusion Our results show that CC prevents visceral and liver fat deposition through BAT activation and increased energy expenditure, a mechanism that is dependent on the GM and linked to major changes in the BA pool size and composition.
- brown adipose tissue
- metabolic syndrome
- insulin resistance
- akkermansia muciniphila
- polyphenols
Statistics from Altmetric.com
Significance of this study
What is already known on this subject?
The consumption of fruits and vegetables is strongly associated with better health status and lower prevalence of obesity.
Dietary intake of polyphenol-rich foods is importantly correlated with higher bacterial richness and diversity in humans, and animal studies have shown a clear association between the metabolic benefits of dietary polyphenols and important changes in the gut microbiota.
While causation needs to be ascertained with respect to the role of the gut microbiota in the metabolic benefits of dietary phytochemicals, the mechanisms underlying the effects of these compounds on body weight and gut microbiota warrant further investigation.
What are the new findings?
By providing a nutritionally relevant dose of a unique mix of phytochemicals, camu camu (CC) prevented obesity and metabolic syndrome in diet-induced obese mice through increasing energy expenditure.
CC prevented metabolic endotoxaemia and reshaped the gut microbiota by drastically decreasing the abundance of Lactobacillus spp and promoting expansion of Barnesiella spp, Turicibacter spp and Akkermansia muciniphila.
CC reduced the levels of circulating bile acids and altered bile acid composition towards lower conjugated primary bile acids and higher unconjugated secondary bile acids.
Colonisation of germ-free mice with the faecal microbiota of CC-treated mice partially and transiently recapitulated the metabolic benefits seen in conventional mice treated with CC.
Significance of this study
How might it impact on clinical practice in the foreseeable future?
Our data promote the consumption of CC and other phytochemical-rich fruits as a safe and easily implementable nutritional strategy to trigger the expansion of A. muciniphila and other potentially beneficial bacteria in the gut microbiota to alleviate several detrimental features of the metabolic syndrome.
Introduction
The prevalence of obesity and overweight is extremely high worldwide1 and worrisome predictions indicate that more than 1 billion people will be obese by 2030.2 Visceral obesity is crucial for the development of metabolic complications of chronic inflammatory aetiology, such as type 2 diabetes, hepatic steatosis and cardiovascular diseases.3 Deciphering the mechanisms leading to obesity and its comorbidities is therefore of utmost importance to guide the search for novel treatments and preventive strategies. Previous works have demonstrated the role of the gut microbiota in controlling host metabolism.4 5 While diet importantly influences gut microbial community structure,6 metagenome-wide association studies have revealed that the consumption of fruits and other phytonutrient-rich foods are among the strongest factors explaining alterations in the faecal microbiota of humans.7 8 Accordingly, recent animal studies have shown that polyphenol-rich fruit extracts reduce body weight gain and alleviate insulin resistance in association with changes in the gut microbiota.9 10 However, it remains unclear to what extent these gut microbial changes contribute to metabolic benefits.
Camu camu (Myrciaria dubia) is an Amazonian fruit deemed a ‘superfruit’ for its unique phytochemical profile11 and alleged potent antioxidant and anti-inflammatory activity.12 13 Vitamin C is abundant in camu camu, and the concentration of flavonoids such as ellagic acid, ellagitannins and proanthocyanidins is also elevated in this fruit.12 13 As camu camu is a prolific assembly of potentially healthy phytochemicals, we sought to analyse the impact of the administration of a crude extract of camu camu (which mimics well the totality of its phytonutrients at nutritionally relevant doses) on obesity and associated immunometabolic disorders in diet-induced obese mice. We also aimed at thoroughly investigating the role of the gut microbiota in mediating the effects of camu camu on host metabolism.
Materials and methods
Animals
C57Bl/6J male mice aged 8 weeks (Jackson, USA) were individually housed in a controlled environment (12 hours daylight cycle, lights off at 18:00 hours) with food and water ad libitum in the animal facility of the Institute of Nutrition and Functional Foods. After 2 weeks of acclimatisation on a normal-chow diet (Teklad 2018, Harlan), mice were randomly divided into four groups (n=12) and fed on chow or a high-fat high-sucrose (HFHS) diet (see online supplementary table 1). Treatment started concomitantly with the introduction of HFHS diet and consisted of daily oral doses (200 mg/kg) of resuspended crude extract of camu camu (Sunfood, San Diego, USA), vitamin C (6.6 mg/kg) or the vehicle used to resuspend the extract and vitamin C (ie, animal facility’s drinking water) throughout 8 weeks. The groups treated with the extract of camu camu and vitamin C are referred to as CC and VitC, respectively throughout the manuscript, whereas vehicle-treated groups are identified as Chow and HFHS. The phytochemical profile of the camu camu extract is available in table 1 and online supplementary table 2. Body weight gain and food intake were assessed twice a week. At week 8, animals were anaesthetised in chambers saturated with isoflurane and then sacrificed by cardiac puncture. Blood was drawn in tubes containing 2 IU of heparin and immediately centrifuged in order to separate plasma from cells. Brown, subcutaneous and visceral fat pads were carefully collected along with gastrocnemius muscle, liver, intestines, pancreas and heart.
Supplementary file 1
Chemical characterisation of the camu camu extract
Metabolic cages
At week 5, mice were individually placed in metabolic cages (Comprehensive Laboratory Animal Monitoring System, CLAMS, Columbus Instruments, Columbus, Ohio, USA). Room temperature for all metabolic studies was maintained at 28°C to keep mice at thermoneutrality14 15 and with a 12-hour light/dark cycle. The relationship between metabolic rate and body mass was normalised by using the Kleiber’s interspecific mass exponent (0.75) to calculate the metabolic body size (body weight0.75).16 17
Germ-free mice and faecal microbiota transplants
In an additional cohort, faecal pellets of vehicle-treated and CC-treated conventional mice were harvested at week 6 and transferred to anaerobic chambers for resuspension in phosphate-buffered saline (PBS) (110 mg of faeces/350 µL of PBS). Fourteen germ-free C57Bl/6N male mice aged 8 weeks were purchased from Taconic, USA, and, on the day of arrival, the sterile containers were opened under a germ-free laminar flow hood and mice were gavaged with freshly prepared faecal resuspensions (350 µL). Germ-free mice reconstituted with the faecal microbiota of vehicle-treated HFHS-fed mice are referred to as HFHS receivers (n=7), whereas those reconstituted with the faecal slurry of CC-treated HFHS-fed mice are referred to as CC receivers (n=7) throughout the manuscript. Receiver mice were initially housed in metabolic cages for 4 days (Columbus Instruments) and then transferred to ventilated sterile cages for 10 additional days and fed a low-fat diet (Research diets, D12450H) throughout the study.
The methods used to assess interscapular temperature, glucose homeostasis, plasma bile acids (BA), protein and gene expression and gut microbial profile are available in online supplementary material. Primer sequences are available in online supplementary table 3.
Supplementary file 2
Statistical analysis
Data are expressed as mean±SEM. One-way analysis of variance (ANOVA) with Bonferroni post hoc test (for parametric data sets) or Kruskal-Wallis test with Dunn’s multiple comparison test (for non-parametric data sets) were used to assign significance to the differences between groups (GraphPad Prism, USA). Two-way repeated measures ANOVA with a Bonferroni post-test (Sigmaplot, USA) was used when time was considered as a variable. All results were considered statistically significant at p<0.05.
The statistical significance of differentially abundant and biologically relevant taxonomical biomarkers between two distinct biological conditions was measured using a linear discriminant analysis effect size (LEfSe).
Results
CC, but not vitamin C, prevents obesity and liver steatosis in diet-induced obese mice
Daily oral administration of CC prevented diet-induced weight gain from day 14 onwards (figure 1A, B), and these findings were not related to changes in energy intake (figure 1C). CC prevented fat accretion in all fat depots, including visceral (ie, epididymal, retroperitoneal and mesenteric), subcutaneous (ie, inguinal) and interscapular brown fat (figure 1D). Intestinal length and the weight of gastrocnemius, pancreas, heart and caecum content were not affected by CC administration (see online supplementary figures 1a–f). Vitamin C did not prevent diet-induced obesity (figure 1A–D), suggesting that other constituents in the extract are responsible for the observed anti-obesity effects. Liver weight was slightly, yet not significantly, reduced in CC-treated mice (figure 1E), whereas diet-induced hepatic steatosis and dyslipidemia were fully prevented by CC treatment, as indicated by lower triglyceride accumulation in both liver and circulation of CC-treated mice versus HFHS control mice (figure 1F, G). We found no differences in daily faecal energy output between CC and HFHS mice, suggesting that CC did not alter food digestion or intestinal absorption (figure 1H). CC increased energy expenditure and that was unrelated with augmented physical activity (figure 1I and online supplementary figures 1g–l), resulting in less energy available for storage (figure 1J). In line with increased oxygen consumption, CC-treated mice showed a tendency (p=0.08) towards higher interscapular temperature than vehicle-treated HFHS-fed mice (figure 1K, HFHS 35.66°C±0.09; CC 35.97°C±0.08). Taken together, these results show that CC prevents diet-induced weight gain and adiposity by increasing energy expenditure and thermogenesis.
Supplementary file 3
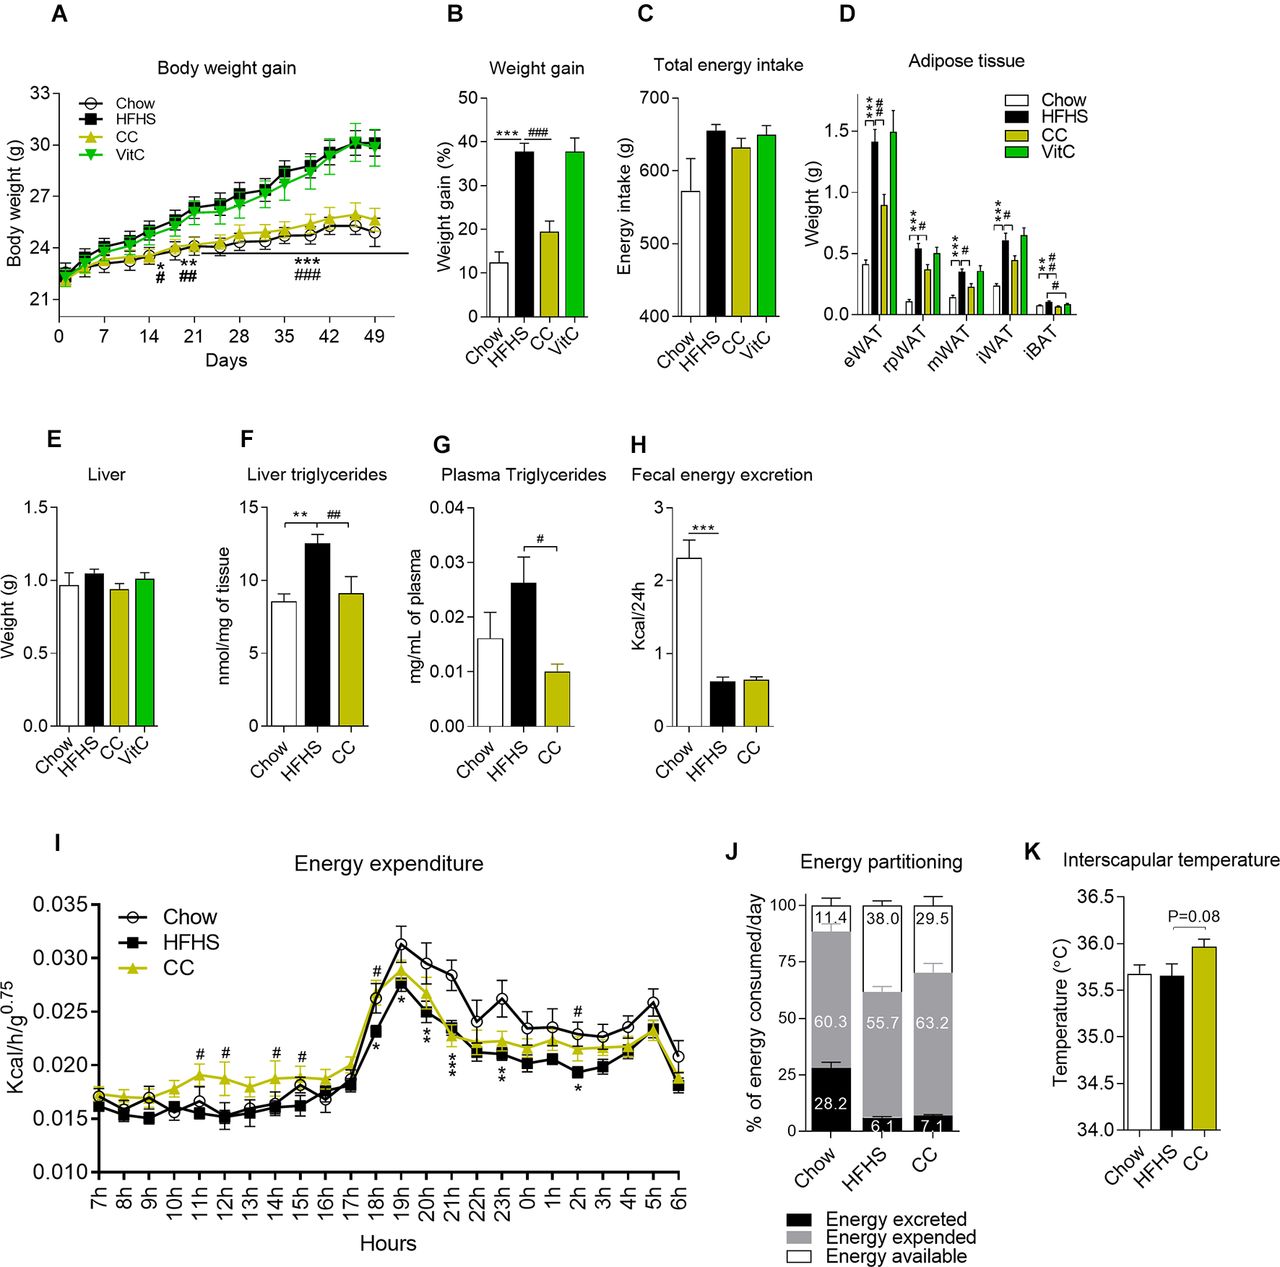
Camu camu (CC) administration, but not vitamin C (VitC), prevents diet-induced obesity. Mice were fed either a standard chow diet (Chow, n=12) or a high fat/high sucrose (HFHS, n=12) diet and treated with daily doses of an extract of CC (n=12) or VitC (n=12) throughout 8 weeks. (A, B) Body weight gain; (C) cumulative energy intake. (D) Epididymal (eWAT), retroperitoneal (rpWAT), mesenteric (mWAT) and inguinal (iWAT) white adipose tissues (WAT) along with interscapular brown adipose tissue (iBAT) were harvested and weighed during necropsies. (E) Liver weight; (F) hepatic triglyceride content; (G) circulating triglycerides (6-hour fasted mice). At week 5, mice were temporarily housed in metabolic cages and (H) faecal energy output and (I) energy expenditure were assessed. Mice were monitored over a 3-day period (1 day of acclimatisation followed by 2 days of measurements). The relationship between metabolic rate and body mass was normalised by using the metabolic body size (ie, body mass0.75). (J) Energy partitioning. (K) Interscapular temperature. Data are expressed as the mean±SEM. (A, I) Two-way repeated measures analysis of variance (ANOVA) with Bonferroni post hoc test. (B–H, K) One-way ANOVA with Bonferroni post hoc test. *P<0.05, **p<0.01 and ***p<0.001 for Chow vs HFHS; #p<0.05, ##p<0.01 and ###p<0.001 for CC vs HFHS.
CC blunts adipose tissue inflammation, alleviates metabolic endotoxaemia and improves glucose homeostasis in diet-induced obese mice
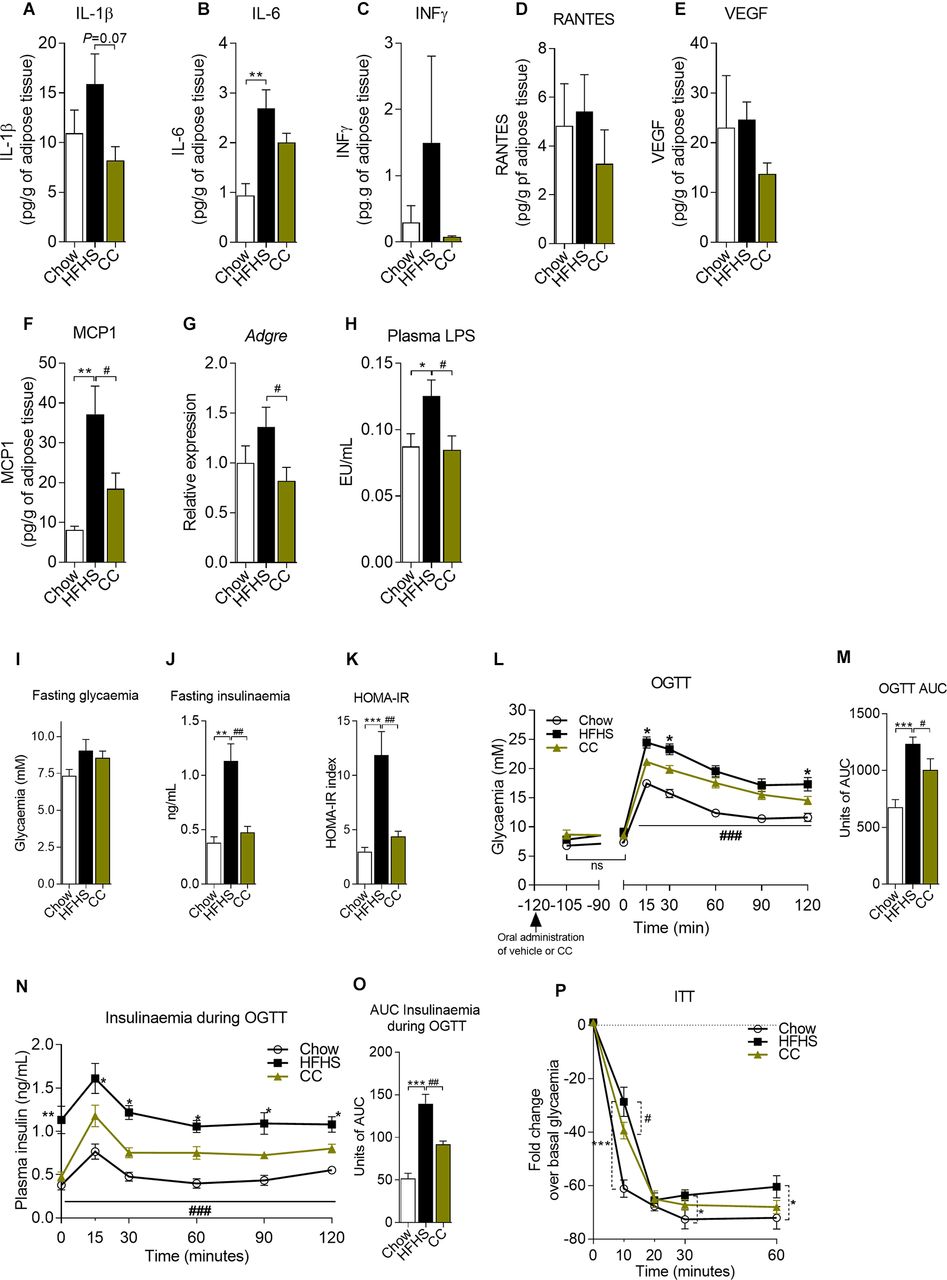
CC treatment prevented metabolic inflammation in the adipose tissue, leading to a strong tendency (p=0.07) towards reduced interleukin-1β (IL-1β). While the levels of vascular endothelial growth factor (VEGF), IL-6, interferon-γ (INF-γ) and regulated on activation normal T cell expressed and secreted (RANTES) were not altered by CC treatment, we found lower levels of monocyte chemoattractant protein-1 (MCP-1) in CC-treated versus vehicle-treated HFHS-fed mice (figure 2A–F). In line with reduced MCP-1, a key orchestrator of macrophage infiltration in the adipose tissue, we found lower mRNA expression of Adgre (encodes for F4/80) and lower crown-like structure (CLS) density in the epididymal adipose tissue (eWAT) of CC mice (figure 2G and online supplementary figures 2a–c,f). Consistent with improved adipose tissue inflammation, CC mice showed reduced adipocyte size (see online supplementary figures 2a–e). CC treatment also prevented metabolic endotoxaemia, as indicated by lower circulating levels of LPS (figure 2H).

Camu camu (CC) blunts adipose tissue inflammation, alleviates metabolic endotoxaemia and improves glucose homeostasis in diet-induced obese mice. Protein lysates from epididymal fat pads (eWAT) of Chow (n=12), high fat/high sucrose (HFHS) (n=12) and CC (n=12) were used to quantify (A) interleukin-1β (IL-1β), (B) interleukin-6 (IL-6), (C) interferon-γ (INF-γ), (D) regulated on activation normal T cell expressed and secreted (RANTES), (E) vascular endothelial growth factor (VEGF) and (F) monocyte chemoattractant protein-1 (MCP-1). (G) qPCR analysis of Adgre (encodes for F4/80) mRNA expression in eWAT. (H) Circulating lipopolysaccharides (LPS) (6-hour fasted mice). At week 6, mice (n=12) were fasted overnight (12 hours) and submitted to oral glucose tolerance tests (OGTT). CC was orally given 2 hours prior to the test, and glycaemia was assessed 15 min after CC administration (time point −105) to monitor possible changes in glycaemia associated with sugars present in CC. (I) Fasting glycaemia; (J) fasting insulinaemia; (K) homeostatic model assessment for insulin resistance (HOMA-IR); (L, M) OGTT. (N, O) Blood was collected during OGTT and used to assess insulinaemia after glucose challenge. At week 7, mice were fasted for 6 hours and (P) insulin tolerance tests (ITT) were carried out after intraperitoneal insulin injections (0.65 IU/kg). Data are expressed as the mean±SEM. (L, N and P) Two-way repeated measures analysis of variance (ANOVA) with Bonferroni post hoc test. (A–K, M and O) One-way ANOVA with Bonferroni post hoc test. *P<0.05, **p<0.01 and ***p<0.001 for Chow vs HFHS; #p<0.05, ##p<0.01 and ###p<0.001 for CC vs HFHS. AUC, area under the curve.
While fasting glycaemia was not different between CC-treated and HFHS control mice (figure 2I), CC administration prevented fasting hyperinsulinaemia (figure 2J), resulting in improved fasting insulin resistance as suggested by lower HOMA-IR (figure 2K). Postglucose challenge, CC enhanced glucose clearance (figure 2L, M) and limited diet-induced hyperinsulinaemia (figure 2N, O), whereas insulin sensitivity 10 min after insulin injection (figure 2P) was improved in CC mice versus HFHS control mice. These results indicate that the preventive effect of CC on HFHS-induced obesity and visceral fat accumulation and inflammation resulted in improved glucose homeostasis and insulin sensitivity.
CC administration prevents obesity-driven dysbiosis
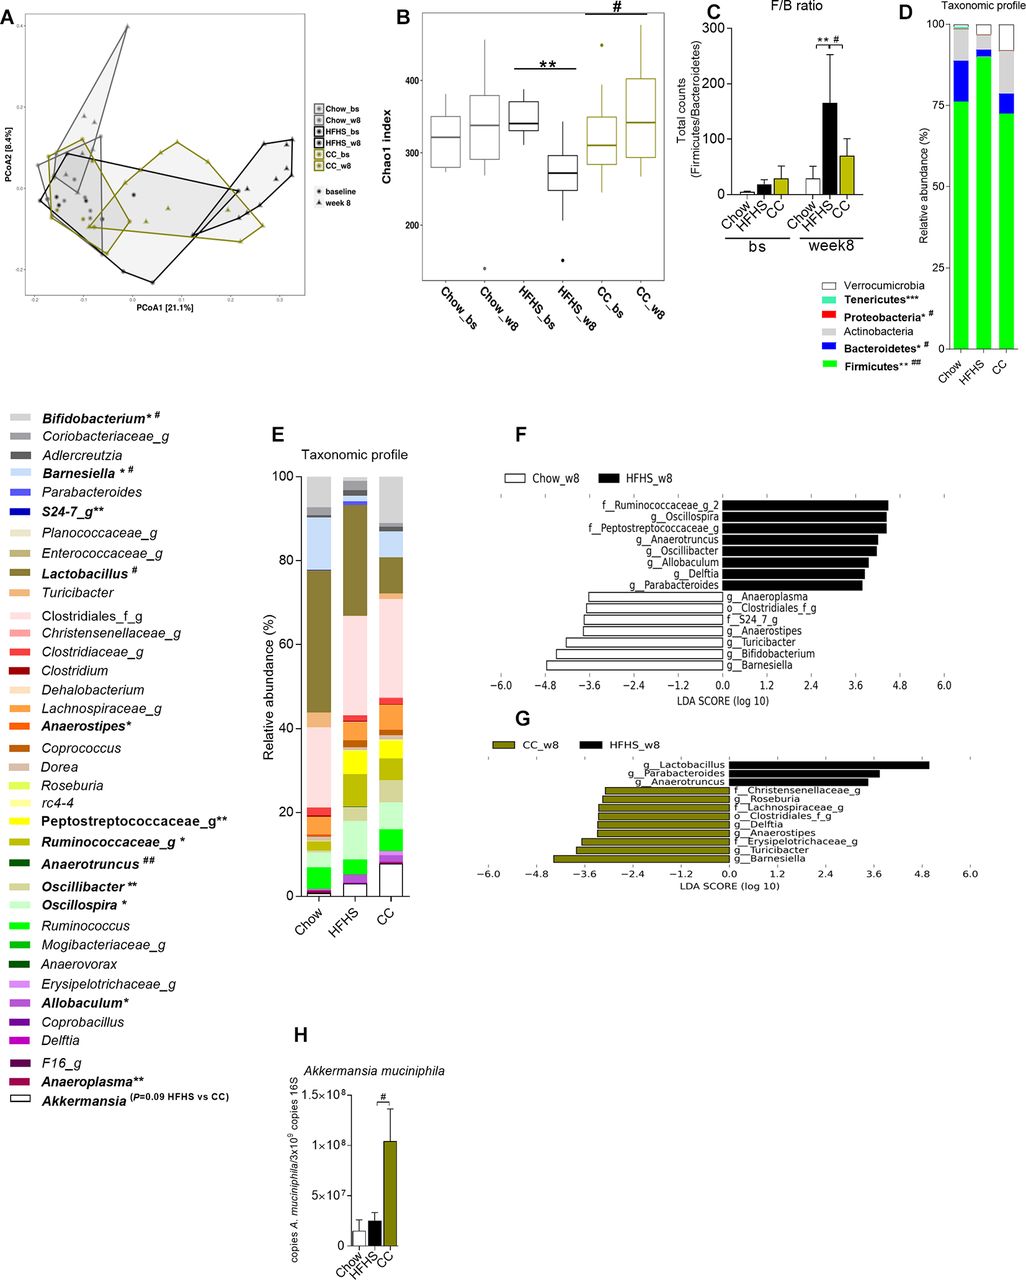
Faecal samples were harvested at the end of the study (ie, week 8) and at the end of the acclimatisation period on a Chow diet (baseline -bs) to verify the uniformity of the microbial profile at the study beginning. Principal coordinate analysis revealed that while all samples clustered similarly at baseline (when all mice were fed a standard chow diet), 8 weeks of HFHS feeding drastically changed gut microbial profile (figure 3A). CC-treated mice, however, clustered partially apart of vehicle-treated HFHS-fed mice samples, suggesting important changes in CC gut microbial profile (figure 3A). CC treatment fully prevented the diet-induced decrease in microbial richness (figure 3B) and the increase in the Firmicutes/Bacteroidetes ratio (figure 3C, D), two hallmarks of obesity-driven dysbiosis.18–20 CC treatment prevented the HFHS-driven reduction in Bifidobacterium and Barnesiella (figure 3E and online supplementary figures 3l, n) and reduced the relative abundance of Lactobacillus, the later explaining most of the reduction in Firmicutes found in the gut microbiota of CC versus HFHS (figure 3E and online supplementary figure 3a).

Camu camu (CC) prevents obesity-driven gut microbiota dysbiosis in high fat/high sucrose (HFHS)-fed mice. Faecal samples of Chow-fed (Chow, n=9), HFHS (n=11) and HFHS-fed CC-treated (CC, n=11) mice were harvested at week 8. Faecal pellets were also collected during the last week of acclimatisation on a Chow diet (baseline (bs)), prior to the introduction of the HFHS diet or CC treatment. Genomic DNA was extracted from faeces and subsequent 16S rRNA-based gut microbial profiling was performed. (A) Principal coordinate analysis (PCoA) on unweighted UniFrac distance matrix, (B) Chao1 index (at OTU level), (C) Firmicutes to Bacteroidetes (F/B) ratio (total counts of Firmicutes/total counts of Bacteroidetes). Relative abundance of taxa at (D) phylum and (E) lowest taxonomic level achieved. Linear discriminant analysis (LDA) effect size (LEfSe) was calculated to explore the taxa within the lowest taxonomic level possible that more strongly discriminate between the gut microbiota of (F) Chow vs HFHS and (G) CC vs HFHS. (H) qPCR quantification of faecal Akkermansia muciniphila normalised by 3×10⁹ copies of 16S (total bacteria). ‘f’ and ‘g’ at the end of taxon denotes unclassified family and genus, respectively. (B–E) Kruskal-Wallis test with Dunn’s multiple comparison test. (H) One-way analysis of variance with Bonferroni post hoc test. *P<0.05, **p<0.01 and ***p<0.001 Chow vs HFHS; #p<0.05, ##p<0.01 and ###p<0.001 for HFHS vs CC.
The LEfSe approach ranked Barnesiella spp and Turicibacter spp along with a major decrease in operational taxonomic units (OTUs) assigned to Lactobacillus spp as the main features discriminating faecal bacterial communities of CC mice from that of HFHS control mice (figure 3G and online supplementary figure 3a,k,l). Higher abundace of Barnesiella and Turicibacter was also noticed in Chow mice as compared to vehicle-treated HFHS mice (figure 3F). Since we found a tendency towards expansion of Akkermansia muciniphila in CC mice (figure 3E and online supplementary figure 3m), we quantified this bacterium by qPCR and found a major increase in its abundance in CC mice (figure 3H). Although OTUs assigned to the genera Delftia, Roseburia, Anaerostipes, Anaerotruncus and Parabacteroides, and to unclassified genera within the families Christensenellaceae and Erysipelotrichaceae, were identified by LEfSe as discriminative taxa between CC and HFHS control mice (figure 3G), their abundances were considerably low (figure 3E). We therefore decided to focus on the major CC-related effects, particularly on Barnesiella, Turicibacter, Bifidobacterium, A. muciniphila and Lactobacillus.
CC administration alters the plasma bile acid pool and upregulates the mRNA expression of markers of brown fat activation and browning of white adipose tissue
Since BA have been shown to regulate energy homeostasis and brown adipose tissue activity,21–23 we sought to evaluate whether changes in the BA pool could be linked to the effects seen in CC-treated mice. While the relative abundance of circulating tauro-α-murocholic acid (TαMCA) and tauro-β-murocholic acid (TβMCA) was lower in CC mice, the proportion of β-murocholic acid and ω-murocholic acid (ωMCA) were both higher in these mice (figure 4B and online supplementary table 5). Furthermore, the relative abundance of chenodeoxycholic acid (CDCA), deoxycholic acid (DCA), hyodeoxycholic acid and ursodeoxycholic acid (UDCA) was higher in the plasma of CC mice versus HFHS control mice (figure 4B and online supplementary table 5), findings that paralleled decreased circulating BA (figure 4A and online supplementary table 5) and increased proportion of secondary and of unconjugated BA in the plasma of CC mice (figure 4B, online supplementary table 5 and online supplementary figures 4a–d). Faecal BA concentration was similar between vehicle-treated and CC-treated mice (figure 4A, online supplementary figures 4e–h and online supplementary tables 4 and 5), suggesting that altered circulating BA in CC mice was rather linked to differences in BA synthesis than excretion/re-uptake. Consistent with reduced BA pool size, the ileal mRNA expression of Nr0b2 (encodes for Shp1) was downregulated in CC mice; however, this was not sufficient to affect the mRNA expression of fibroblast growth factor 15 (Fgf15) and of other genes under farnesoid X receptor (FXR) control, such as the BA transporters organic solute transporter-α (Ostα, Slc51a) and Ostβ (Slc51b), in the ileum of CC mice (figure 4C). These findings were not related to changes in the mRNA expression of Cyp7a1 in the liver of CC mice in comparison with HFHS-fed control mice (figure 4D). Taken together, these results highlight drastic changes in the plasma BA pool size and composition in CC-treated mice.
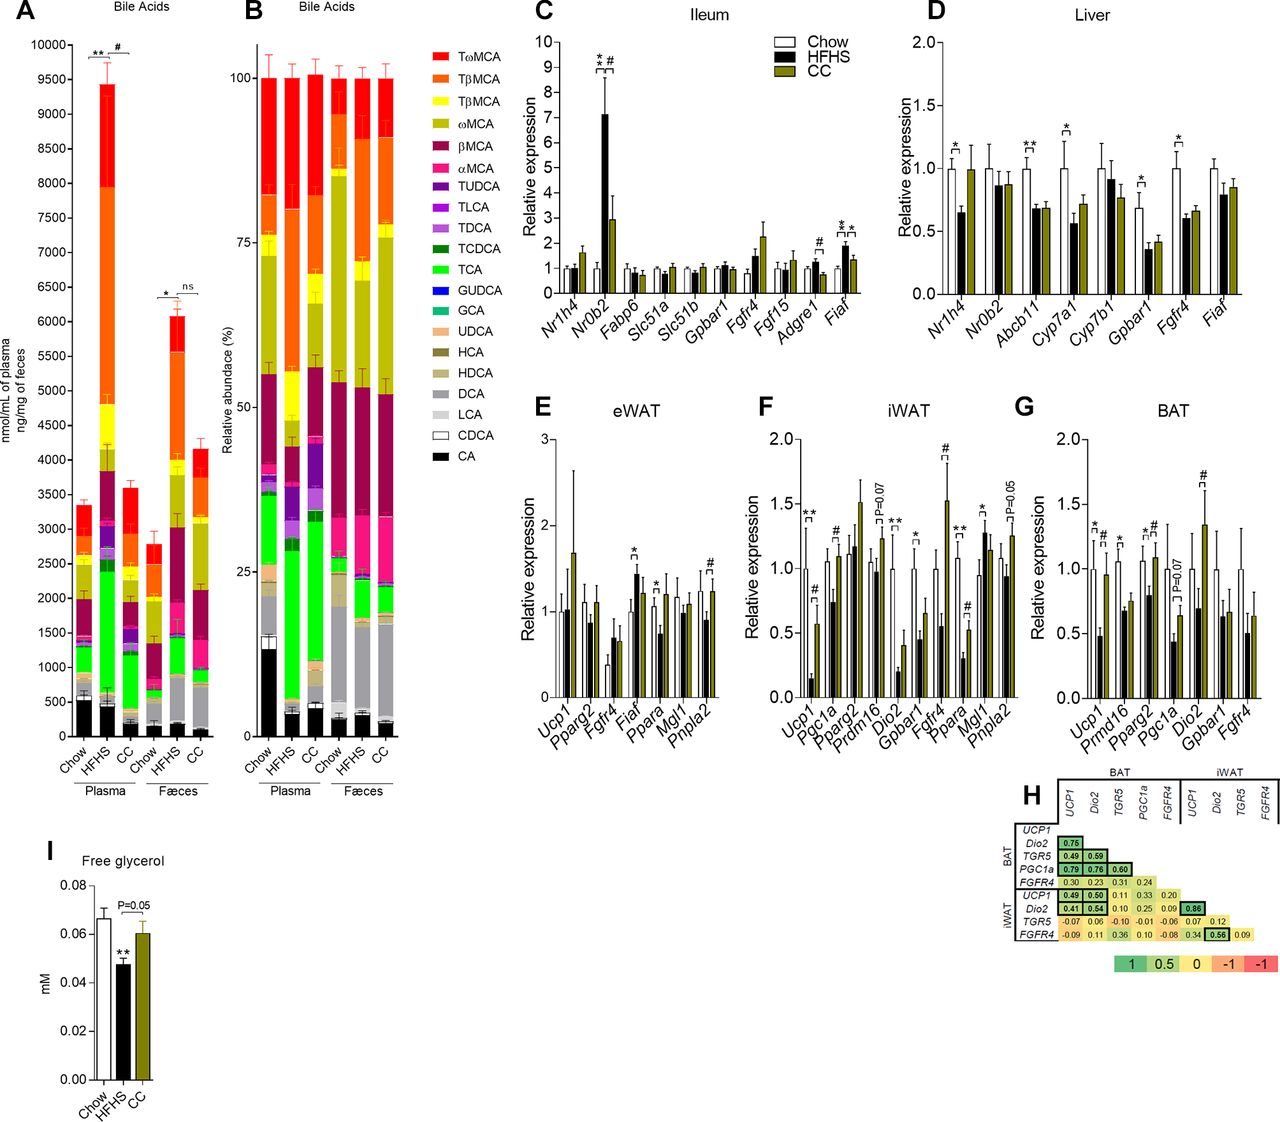
Camu camu (CC) administration alters bile acid pool size and composition and upregulates the mRNA expression of genes involved in brown adipose tissue activation, lipolysis and lipogenesis. (A, B) Plasma and faecal bile acids. Messenger RNA extracted from (C) ileum, (D) liver, (E) epididymal adipose tissue (eWAT), (F) inguinal adipose tissue (iWAT) and (G) brown adipose tissue (BAT) was quantified by RT-PCR. Relative expression was calculated using the ΔΔCt method with Chow mice as the group of reference and actin as the reference gene. (H) Correlation matrix between BAT and iWAT mRNA expression profiles (bold values represent statistically significant correlations; p=0.05 if 0.404>r>0.404; p=0.01 if 0.515>r>0.515; p=0.001 if 0.628>r>0.628). (I) Free glycerol. Data are expressed as the mean±SEM. One-way analysis of variance with Bonferroni post hoc test. *P<0.05, **p<0.01 and ***p<0.001 for Chow vs HFHS; #p<0.05, ##p<0.01 and ###p<0.001 for CC vs HFHS.
Our findings revealed a significant upregulation in the mRNA levels of uncoupling protein 1 (Ucp1) and deiodinase 2 (Dio2) in both brown (BAT) and inguinal (iWAT) adipose tissues of CC-treated mice (figure 4F, G). Further supporting iWAT beiging, CC mice showed a tendency of higher peroxisome proliferator-activated receptor γ-2 (Pparg2) mRNA expression, increased PR domain containing 16 (Prdm16) gene expression and a tendency towards increased UCP1 protein expression in iWAT as compared with vehicle-treated HFHS-fed mice (figure 4F and online supplementary figure 5a). Concordant with higher BAT activity, the mRNA expression of Pparg2 was increased in the BAT of CC mice while PPARγ coactivator 1α (Pgc1a) gene expression trended higher in the BAT of CC-treated versus vehicle-treated HFHS-fed mice (figure 4G). The mRNA expression of Fgfr4 was upregulated in the inguinal fat of CC mice (figure 4F), but not in the eWAT or BAT of these mice (figure 4E, G). We found a strong correlation between Ucp1 and Dio2 mRNA expression in both iWAT and BAT, as well as between the mRNA expression of TGR5 (Gpbar1) and Ucp1 and Dio2 and PGC1a in BAT, all key genes involved in BAT activation (figure 4H). Our analysis also revealed that the mRNA expression of Fgfr4 strongly correlated (r=0.86) with the mRNA expression of Dio2 in iWAT (figure 4H). We did not detect significant changes in Ucp1 and Fgfr4 mRNA expression in the eWAT (figure 4E). In summary, these data support increased brown fat activation coupled with browning of subcutaneous white adipose tissue.
Lactobacillus spp, known to express bile salt hydrolases (BSH), were strongly correlated with several unconjugated BAs in the faeces. Akkermansia was negatively correlated with ωMCA and positively correlated with the secondary BA LCA as well as the taurine-conjugated forms of DCA and UDCA in circulation (table 2). Other groups of bacteria, such as unclassified Erysipelotrichaceae and Lachnospiraceae as well as Barnesiella were also strongly correlated with both free and taurine conjugated forms of secondary BAs in plasma (table 2). These results suggest that key-phylotypes in the gut microbiota of CC mice may contribute to the synthesis of secondary BAs.
Correlation between key gut microbial taxa and bile acids in CC-treated mice
We next assessed whether changes in lipolytic/lipogenic program also contributes to reduced fat mass gain found in CC mice. In addition to higher plasma-free glycerol (figure 4I) and increased Ppara gene expression in both eWAT and iWAT of CC mice (figure 4F, G), we found increased mRNA expression of adipose triglyceride lipase (encoded by Pnpla2) in both eWAT and iWAT (figure 3E, F). Furthermore, while the ileal gene expression of the lipoprotein lipase (LPL) inhibitor fasting-induced adipose factor (Fiaf) was decreased in CC mice (figure 3C), the gene expression of monoacylglycerol lipase (Mgl1) was not affected by CC (figure 3E, F). While these findings point to increased lipolysis and fatty acid oxidation fuelled by higher triglyceride clearance, Mgl1 is possibly poorly regulated at the transcriptional level. We found reduced protein expression of cluster of differentiation 36 (CD36) and fatty acid synthase (FAS) in the eWAT (see online supplementary figures 5h,j) and lower fatty acid binding protein 4 (FABP4) and FAS in the iWAT of CC-treated mice (see online supplementary figures 5b,f). The protein expression of CD36, PPARγ (−2 and total) and acetyl-CoA carboxylase (ACC) in the iWAT was not affected by CC treatment (see online supplementary figures c−e), whereas protein levels of PPARγ (−2 and total), FABP4 and ACC in the eWAT were not different between CC-treated and vehicle-treated HFHS-fed mice (see online supplementary figures g,i,k). These data suggest that, in addition to higher energy expenditure, CC-mice display increased lipolysis/fatty acid oxidation and decreased lipid synthesis in both visceral and subcutaneous fat depots.
Reconstitution of germ-free mice with the faecal microbiota of CC-treated mice increases energy expenditure
We next performed faecal microbiota transplants (FMT) using germ-free mice colonised either with the faecal microbiota of CC-treated or vehicle-treated HFHS-fed donor mice. Throughout days 1, 2 and 3 postcolonisation, HFHS receivers gained, respectively, 3%, 2% and 2.4% of their initial body weight (figure 5A and online supplementary figure 6a). Conversely, CC receivers showed a rapid 5% body weight loss 1 day postcolonisation followed by a 3.7% and a 1.4% loss of their initial body weight on days 2 and 3, respectively (figure 5A). This resulted in significant differences in weight gain between CC receivers and HFHS receivers on days 1 (p<0.001) and 2 (p=0.009) postcolonisation and a tendency (p=0.1) to be maintained at day 3. There were no differences in energy intake or in faecal energy excretion between groups (figure 5B and online supplementary figures 6b,c). Indirect calorimetry measurements performed throughout the initial days postcolonisation revealed a marked increase in energy expenditure unrelated to physical activity on days 1 and 2 postcolonisation. This effect was reduced on day 3 and completely lost on day 4 postcolonisation (figure 5C and online supplementary figures 6d−i).

Reconstitution of germ-free mice with the faecal microbiota of camu camu (CC)-treated mice recapitulates the effects of CC administration on weight gain and energy expenditure. Germ-free mice were reconstituted either with the faecal slurry of high fat/high sucrose (HFHS)-fed vehicle-treated mice (HFHS receivers, n=7) or CC-treated mice (CC receivers, n=7) and kept on a low-fat diet in metabolic cages during the initial days postcolonisation. Mice were later transferred into sterile cages and kept under specific pathogen-free (SPF) conditions. (A) Weight gain; (B) energy intake; (C) energy expenditure (the relationship between metabolic rate and body mass was normalised by using the metabolic body size, ie, body mass0.75). (D, E) Taxonomic profile of HFHS and CC receivers at phylum and at the lowest taxonomic level achieved 1, 2 and 3 days postcolonisation (day 1—n=3; day 2—n=5; day 3—n=4). (F) LEfSe analysis of taxa at the lowest taxonomic level possible that better discriminates the gut microbiota of HFHS and CC receivers at days 1, 2 and 3 postcolonisation. (G) Firmicutes to Bacteroidetes (F/B) ratio in HFHS and CC receivers (total counts Firmicutes/total counts Bacteroidetes). (H–Q) Taxa were quantified using qPCR and the number of copies of each taxon was normalised by 3×10⁹ copies of 16S (total bacteria). (R) Quantification by Folin-Cicalteu of total polyphenols present in the extract of CC and in faecal slurries used to colonise HFHS-receiver and CC-receiver mice. Data are expressed as the mean±SEM. Two-way repeated measures analysis of variance with a Bonferroni post hoc test was used to calculate the significance of the differences between time points. *P<0.05, **p<0.01 and ***p<0.001.
16S rRNA gene-based profiling revealed distinct gut microbial communities in HFHS-receiver and CC-receiver mice on day 1 postcolonisation (see online supplementary figure 6j). Microbial communities clustered further apart on day 2 postcolonisation, which was followed by higher similarity between HFHS-receiver and CC-receiver gut microbiota on day 3 postcolonisation (see online supplementary figure 6k,l). The differences seen on day 1 postcolonisation were mostly explained by a tendency of lower Firmicutes/Bacteroidetes ratio and higher presence of Verrucomicrobia (figure 5D, G and online supplementary table 6). The increased abundance of Verrucomicrobia in CC receivers was exacerbated on day 2 postcolonisation, reaching statistically significant levels, and lost on day 3 (figure 5D and online supplementary table 6). Since Verrucomicrobia is solely represented by A. muciniphila in the gut microbiota of mice and humans, the latter was as abundant as the former in CC receivers versus HFHS receivers during colonisation (figure 5E and online supplementary table 7). In addition to A. muciniphila, analysis at lower taxonomic level on day 1 postcolonisation revealed lower abundance of unclassified Lactobacillales and Lactobacillus and of Turicibacter in CC receivers versus HFHS receivers (figure 5E, F and online supplementary table 7). Barnesiella trended higher in CC receivers on days 1 and 2 postcolonisation (figure 5E, F and online supplementary table 7). On day 2, CC receivers displayed higher proportions of rc4-4 (a genus within the Peptococcaceae family) and Bifidobacterium and lower abundance of Bacteroidales S24-7 and Allobaculum (figure 5E, F and online supplementary table 7). On day 3, increased dominance of Firmicutes such as Lachnospiraceae, Dorea, Coprococcus and Ruminococcus in CC receivers considerably reduced the differences between the gut microbial communities of mice reconstituted with faecal resuspensions of CC-treated and HFHS-treated donor mice (figure 5E, F and online supplementary table 7). The gut microbiota of HFHS and CC receivers was generally different from that of donor mice (figure 3D–G). The exceptions were the higher abundance of A. muciniphila and Barnesiella on days 1 and 2 postcolonisation, lower Lactobacillales on day 1 postcolonisation and higher Bifidobacterium on day 2 postcolonisation, traits seen in CC receivers and also observed in CC-treated donor mice. These data suggest that while short-term colonisation is not enough to establish a stable gut microbiota comparable to donor mice, a few taxa enriched in CC-treated mice faecal microbiota were sufficient to increase energy expenditure in our model.
We used qPCR to assess the abundance of key phylotypes harboured by CC-treated mice in faecal samples of HFHS and CC receivers. On day 1 postcolonisation, lower Lactobacillus spp as well as higher abundance of A. muciniphila were both found in the faeces of CC receivers when compared with HFHS receivers (figure 5H–Q). Interestingly, only A. muciniphila remained significantly enriched in the fæces of CC receivers in comparison with HFHS receivers on day 2 postcolonisation (figure 5Q). qPCR analysis did not confirm the changes in Bifidobacterium spp, Barnesiella spp, Allobaculum spp and Turicibacter spp found by 16S sequencing analysis on days 1 and 2 postcolonisation in CC receivers versus HFHS receivers (figure 5I–K, N). The presence of Parabacteroides, Anaerostipes, Anaerotruncus and Roseburia was also not different during the first 2 days postcolonisation (figure 5L, M, O, P). These results point towards A. muciniphila and Lactobacillus spp as being important drivers of increased energy expenditure and reduced weight gain on CC administration in diet-induced obese mice.
The remnant faecal slurries from CC-treated and vehicle-treated HFHS-fed donor mice were pooled together and the total amount of polyphenols in these samples was assessed by Folin-Ciocalteu assay. As shown in figure 5R, we found 4.58 mg of polyphenols/100 g of faeces in the resuspensions made from CC-treated stools. This concentration is 1430x lower than the polyphenolic concentration found in the CC extract (ie, 6550 mg/100 g, figure 5R and table 1), strongly suggesting that the phenotype seen in CC receivers is not due to polyphenols present in the faecal resuspensions.
Discussion
We present evidence that daily treatment of HFHS-fed mice with a crude extract of CC containing a rich mixture of phytonutrients is sufficient to prevent diet-induced obesity and ameliorate the metabolic syndrome. Our work elucidates some key mechanisms underlying the beneficial action of CC treatment. The anti-obesity effect of CC is unrelated to changes in energy intake or excretion and rather attributed to increased energy expenditure and adaptive thermogenesis. CC treatment also restrained lipogenesis and activated lipolysis and free fatty acid oxidation in adipose tissues, which contributes to lower fat mass gain in these mice. Our data unravel a putative role for altered plasma BA pool size and composition that is consistent with brown fat activation and browning of subcutaneous white fat. Our findings suggest that changes in the gut microbiota are linked to key metabolic benefits of CC treatment. Interestingly, as depicted in online supplementary figure 1j, k, CC-treated mice became active earlier than vehicle-treated HFHS-fed mice, suggesting that alterations in the circadian cycle may also contribute to the metabolic benefits of CC.
CC-based products are widely marketed for their high content of vitamin C and their alleged strong anti-oxidant potential.13 We showed that mice treated daily with the same dose of vitamin C found in 200 mg/kg of CC (ie, 6.6 mg/kg) displayed fat mass gain comparable to vehicle-treated HFHS-fed mice, strongly suggesting that vitamin C, alone, is not causally involved in the anti-obesity effects of CC. CC extract is also rich in fibres, which possibly contributed to the benefits of CC treatment. However, increased faecal energy excretion (a typical trait of fibre-rich diets) was not seen in CC mice, suggesting a minor impact of fibres.
CC treatment prevented the HFHS-induced increase in BA pool size and composition. BA bind to FXR which in turn activates Shp to then inhibit their own synthesis in the liver and uptake in the ileum. FXR activation in the ileum also triggers the secretion of Fgf15, which contributes to the downregulation of BA synthesis in the liver through binding to Fgfr4. Our results suggest that the reduced BA pool size found in CC-treated HFHS mice likely contributes to downregulate FXR activity in the ileum of these mice. This conclusion is based on the lower mRNA levels of Shp in the ileum of CC mice, since the mRNA expression of Nr1h4 (encodes for FXR) poorly reflects its activity.24 25 Surprisingly, the hepatic mRNA expression of the rate-limiting enzyme involved in BA synthesis, Cyp7a1, along with the mRNA levels of Shp were not affected by CC administration. As we found a major decrease in the abundance of FXR antagonists (eg, TαMCA, TβMCA) coupled with an increase in FXR agonists (eg, CDCA) in the BA pool of CC mice, we hypothesised that such a FXR-stimulatory BA profile might compensate for the inhibitory effect of reduced BA pool size, therefore disrupting the FXR-mediated negative feedback loop controlling BA synthesis in CC mice and keeping the levels of circulating BA lower than in vehicle-treated HFHS-fed mice. While future studies are warranted to fully decipher the mechanisms by which CC impacts BA homeostasis, it is of major interest that CC treatment reduced plasma BA profile in HFHS-fed mice.
Our results suggest that the plasma BA profile of CC mice may be relevant to enhance brown fat activation and browning of subcutaneous fat in CC mice and that the gut microbiota plays a role in this effect. The fact that Akkermansia is positively correlated with several BA in circulation is particularly interesting because CDCA and especially the secondary BA DCA and UDCA have been shown to act through TGR5 to potentiate the response of brown adipocytes to thyroid hormone and activate non-shivering thermogenesis in this tissue.21 We also found a strong correlation between Ucp1 and TGR5 mRNA expression in the BAT of CC mice. Moreover, the gut hormone Fgf15 has been shown to trigger thermogenesis and browning of white fat depots by means of Fgfr4 activation.23 Consistently, we found a strong upregulation in the mRNA expression of Fgfr4 in the iWAT, suggesting that enhanced browning of subcutaneous white fat in CC mice is associated with increased responsiveness to Fgf15. Although the direct contribution of altered BA pool size and composition found in CC mice to enhance energy expenditure warrants further investigation, our study brings novel insights into the cross-talk BA-gut microbiota and its relationship with the anti-obesity effects of phytochemical-rich extracts.
Altered BA profile may contribute to reshape the gut microbiota in CC-treated mice. BA are antimicrobial molecules26 and the BA pool observed on high saturated fat feeding, which favours the presence of taurine-conjugated BA in the enterohepatic circulation, is associated with expansion of BA-resistant bacteria (eg, Bilophila wadsworthia and Lactobacillus spp) in the gut environment.24 27 The reduction of BA pool size found in CC mice may remove the competitive advantage of Lactobacillus spp and contribute to mitigate their presence in the gut. The likely increment in the antioxidant potential in the lumen associated with the intake of CC phytochemicals may restrain oxygen availability and further compromise the bloom of facultative anaerobe species such as Lactobacilli. This hypothesis is supported by a major reduction in Lactobacillus spp abundance observed in mice treated with the antioxidant tempol.24
CC markedly increased A. muciniphila population in the gut microbiota of diet-induced obese mice. This is in line with several reports showing the metabolic benefits of A. muciniphila.28 29 Furthermore, we and others have previously shown the association between dietary proanthocyanidin (PAC)-rich berry extracts and a prebiotic-like effect on A. muciniphila.9 10 30 As previously reported,13 our analysis showed a remarkable concentration of galloylated PACs in the CC extract, pointing to an effect of PACs on A. muciniphila. CC is also rich in ellagitannins, and while ellagitannin-rich extracts seem to inhibit the growth of A. muciniphila in vitro, this bacterium seems capable of degrading ellagitannins and ellagic acid, which could provide in vivo a competitive advantage to A. muciniphila.31 In humans, however, intake of ellagitannin-rich pomegranate juice did not increase the presence of A. muciniphila, suggesting that other polyphenols and the pre-existing abundance of A. muciniphila are important factors.32 33 While the understanding of how polyphenols and other phytonutrients modify the gut microbial environment to favour the expansion of A. muciniphila warrants further investigation, the interplay between A. muciniphila and BA is also largely unknown. A survey in the KEGG database showed absence of pathways linked to BA deconjugation/dehydroxylation in the genome of A. muciniphila, but this microbe occupies a very specific niche in the gut environment, which may confer resistance to the antimicrobial effect of certain BA. In vitro experiments are warranted to test the ability of this bacterium to transform and resist to BA.
Faecal transplant experiments revealed that the gut microbiota of CC-treated mice can transiently and partially recapitulate in germ-free receiver mice the phenotype of conventional mice treated with CC. Receiver mice were fed a low-fat diet to remove a major obesogenic pressure and therefore allow for a quantifiable effect of FMT on body weight in the short-term. It should also be mentioned that faecal resuspensions contained only negligible amounts of polyphenols, which points to an effect of bacteria and/or microbial molecules. While our colonisation approach did not establish in CC-receiver mice a stable gut microbiota comparable to that of CC donor mice, coupled 16S-based sequencing and qPCR analysis suggest that a few key taxa are sufficient to increase energy expenditure and reduce weight gain. A. muciniphila is likely a major contributor since its abundance is as high as 11.6% and 36.22% in the first and second days postcolonisation, respectively. This is supported by previous studies showing that the oral administration of A. muciniphila to diet-induced obese mice counteracted obesity along with other features of the metabolic syndrome.28 29 34 However, the abundance of A. muciniphila is also high in the third day postcolonisation, when oxygen consumption and body weight change became similar between CC-receiver and HFHS-receiver mice, indicating that other gut microbial characteristics, such as lower Lactobacillus and higher Bifidobacterium, may also play a role. This would be in line with previous studies showing positive associations between Lactobacillus and obesity35–37 and negative correlations between Bifidobacterium and obesity.36 38
Acknowledgments
The authors would like to thank Christine Dion, Christine Dallaire, Valérie Dumais and Joanie Dupont-Morissette for their expert help with animal care.
References
Footnotes
Contributors FFA, GP and AM conceived the study. FFA, MLB, TVV, JT, SD and RTN performed the experiments. FFA wrote the manuscript, prepared the figures and was responsible for data compilation and integration. All authors contributed to discuss the results and to research directions. All authors approved the manuscript.
Funding This work was funded by the Ministère du Développement Économique, de l’Innovation et de l’Exportation (MDEIE, PSR-SIIRI-444), J.A. deSève Foundation, by a joint grant from Fundação de Amparo à Pesquisa do Estado de São Paulo (FAPESP)-Agence Universitaire de la Francophonie (AUF) and by a Canadian Institutes of Health Research (CIHR) foundation grant (FDN#143247) to AM.
Competing interests None declared.
Patient consent Not required.
Ethics approval Laval University Animal Ethics Committee.
Provenance and peer review Not commissioned; externally peer reviewed.
Data sharing statement All raw sequences from 16S rRNA gene-based analysis have been deposited in the public European Nucleotide Archive server under accession number PRJEB23031. Data sets generated and analysed during this study are available from the corresponding author on reasonable request.