Article Text

Abstract
Objective Spasmolytic polypeptide-expressing metaplasia (SPEM) is a regenerative lesion in the gastric mucosa and is a potential precursor to intestinal metaplasia/gastric adenocarcinoma in a chronic inflammatory setting. The goal of these studies was to define the transcriptional changes associated with SPEM at the individual cell level in response to acute drug injury and chronic inflammatory damage in the gastric mucosa.
Design Epithelial cells were isolated from the gastric corpus of healthy stomachs and stomachs with drug-induced and inflammation-induced SPEM lesions. Single cell RNA sequencing (scRNA-seq) was performed on tissue samples from each of these settings. The transcriptomes of individual epithelial cells from healthy, acutely damaged and chronically inflamed stomachs were analysed and compared.
Results scRNA-seq revealed a population Mucin 6 (Muc6)+gastric intrinsic factor (Gif)+ cells in healthy tissue, but these cells did not express transcripts associated with SPEM. Furthermore, analyses of SPEM cells from drug injured and chronically inflamed corpus yielded two major findings: (1) SPEM and neck cell hyperplasia/hypertrophy are nearly identical in the expression of SPEM-associated transcripts and (2) SPEM programmes induced by drug-mediated parietal cell ablation and chronic inflammation are nearly identical, although the induction of transcripts involved in immunomodulation was unique to SPEM cells in the chronic inflammatory setting.
Conclusions These data necessitate an expansion of the definition of SPEM to include Tff2+Muc6+ cells that do not express mature chief cell transcripts such as Gif. Our data demonstrate that SPEM arises by a highly conserved cellular programme independent of aetiology and develops immunoregulatory capabilities in a setting of chronic inflammation.
- GASTRIC METAPLASIA
- GASTRIC CANCER
- GASTRITIS
This is an open access article distributed in accordance with the Creative Commons Attribution Non Commercial (CC BY-NC 4.0) license, which permits others to distribute, remix, adapt, build upon this work non-commercially, and license their derivative works on different terms, provided the original work is properly cited, appropriate credit is given, any changes made indicated, and the use is non-commercial. See: http://creativecommons.org/licenses/by-nc/4.0/.
Statistics from Altmetric.com
Significance of this study
What is already known on this subject?
Spasmolytic polypeptide-expressing metaplasia (SPEM), identified by the coexpression of trefoil factor 2 (TFF2), Mucin 6 (MUC6) and gastric intrinsic factor (GIF), is believed to be a precursor lesion for intestinal metaplasia and gastric adenocarcinoma.
SPEM is thought to develop de novo from terminally differentiated chief cells to regenerate the gastric corpus mucosa following injury but can persist chronically if the inciting insult is not resolved.
In chronic settings, TFF2+MUC6+ lesions arise in addition to SPEM but lack mature chief cell signature proteins (such as GIF in murine stomach). Whether these are hyperplastic mucous neck cells rather than true metaplasia is not clear.
What are the new findings?
Single cell RNA sequencing data of 30 000 cells from healthy and damaged murine gastric corpus tissue identified the major corpus lineages as well as SPEM and mucous neck cell hyperplasia/hypertrophy.
Muc6+Gif+ epithelial cells are found in the healthy gastric corpus but do not express SPEM transcripts such as Tff2, Cd44 and Cftr.
Tff2+Muc6+Gif− cells are not a distinct lineage of hyperplastic/hypertrophic neck cells and have a virtually identical transcriptional programme to Tff2+Muc6+Gif+ cells, justifying a pathological redefinition of SPEM to include cells that do not express mature chief cell transcripts (eg, Gif in murine stomach).
While many of the canonical SPEM-associated genes were expressed in both drug-induced and inflammation-induced SPEM cells, many immunoregulatory genes were induced in chronic inflammation-induced SPEM.
Significance of this study
How might it impact on clinical practice in the foreseeable future?
The expansion of SPEM to include cells that do not express mature chief cell transcripts is critical as these cells likely confer the same risks of eventual intestinalisation and carcinogenesis as canonical SPEM. Additionally, the immunoregulatory phenotype developed in chronic inflammatory contexts offers potential opportunities for risk stratification and therapeutic intervention.
Introduction
Epithelial cells in the corpus mucosa of the stomach respond to damage by changes in gene transcription, cellular phenotype and tissue architecture commonly referred to as metaplasia.1 2 Gastric metaplasia is a critical predisposing factor for gastric cancer, which has significant worldwide disease burden and mortality.2–4 A better understanding of the gastric metaplastic response is essential for diagnostic and therapeutic intervention in gastric cancer.
Damage to the gastric corpus mucosa is associated with infiltration of cytokine-producing immune cells, loss of parietal and chief cells, hyperplasia/hypertrophy of mucous-producing neck cells and the emergence of a reparative metaplastic cell lineage pathologically defined by the coexpression of neck cell and chief cell lineage-specific genes—Mucin 6 (Muc6) and gastric intrinsic factor (Gif) (pepsinogen A/PGA in humans), respectively.5 This metaplastic lineage was originally characterised by the ectopic expression of the protein trefoil factor 2 (TFF2), also referred to as spasmolytic polypeptide, which is normally expressed by epithelial cells in the gastric antrum and small intestine, but not found at the base of the glands in the gastric corpus. This metaplastic lesion was therefore named spasmolytic polypeptide-expressing metaplasia (SPEM).6 In human patients, SPEM surrounds nearly all resected gastric tumours and was present in the majority of surveillance biopsies of remnant gastric cancers.7 SPEM has also been epidemiologically associated with gastric cancer in patient populations, and there is evidence that intestinal metaplasia may be derived from SPEM.8–10 In light of these facts, SPEM is considered a critical precursor to the development of intestinal metaplasia and eventually gastric adenocarcinoma, particularly in the context of chronic inflammation and parietal cell loss (chronic atrophic gastritis).2 11 This has led to the development of clinical guidelines recommending the endoscopic surveillance of patients that exhibit precancerous lesions, such as SPEM, intestinal metaplasia (IM) and dysplasia.12 While initial studies of SPEM focused on its preneoplastic properties in chronic contexts, the underlying cellular process is a critical acute phase programme that enables tissue reconstitution following injury. This process only predisposes to carcinogenesis when the inciting injury cannot be resolved, such as during chronic Helicobacter pylori infection or autoimmune gastritis.13–15 The importance of resolution is demonstrated by the clinical consensus that treating Helicobacter infection can resolve precancerous lesions up to the point of intestinal metaplasia.16
Foundational studies that have greatly increased the understanding of SPEM relied heavily on pathological and immunofluorescent analyses. Several critical questions about the nature of SPEM remain. For instance, SPEM is thought to be derived from the dedifferentiation of mature gastric chief cells,17 but microscopy-based analyses may not be equipped to perform the organ-wide surveys necessary to exclude the possibility that a small population of metaplastic cells are present during the steady state and expand when necessary to repair the gastric mucosa. Additionally, it has been well-described that two different pathological lesions develop in response to chronic gastric injury: Tff2+Muc6+Gif+ SPEM and Muc6+Tff2+Gif− mucous neck cell hyperplasia/hypertrophy. It is thought that SPEM is a critical precursor for gastric adenocarcinoma development, but the cellular programme of hyperplastic/hypertrophic neck cells and the risk they pose for cancer development are not well understood.18 19 Finally, a combination of acute drug-induced and chronic inflammation-induced murine models of gastric injury and SPEM have demonstrated that the metaplastic cellular programme is instigated by the loss of parietal cells in combination with additional signals, for example, cytokines secreted by immune cells.1 20–26 However, it has been hypothesised that due to the significant differences in aetiology (drugs vs infection/autoimmunity) and chronicity (days vs months/years) between these model systems, the metaplastic programme may differ significantly and complicate interpretation of these important studies.27 Up to this point, it has not been possible to specifically isolate and compare the transcriptome of hundreds of individual SPEM cells between drug injury and chronic inflammatory models of metaplasia. The goal of these studies was to identify SPEM and define the transcriptional programme at the individual cell level to address these important concerns.
Here, we used single cell RNA-sequencing (scRNA-seq) to identify and compare the transcriptomes of ~30 000 individual epithelial cells isolated from the corpus of three different groups of mice: (1) healthy control mice, (2) mice that have undergone parietal cell ablation using high-dose tamoxifen treatment (HDT) over a 3-day period (referred to as ‘drug-induced’ throughout these studies) and (3) a mouse model of autoimmune gastric metaplasia (TxA23) that had progressed over a 4-month period (denoted as ‘inflammation-induced’). TxA23 mice were used because they are a well-described mouse model of inflammation-induced atrophy and metaplasia that closely recapitulates disease progression in human patients including: parietal cell atrophy, SPEM development, chronic STAT3 phosphorylation and development of gastric intraepithelial neoplasms.24 28–30 Using unsupervised clustering by a shared nearest neighbour modularity-based optimisation algorithm and dimensionality reduction with t-Distributed Stochastic Neighbor Embedding (t-SNE), we distinguished normal and SPEM (Tff2+Muc6+Gif+Muc5ac−) gastric epithelial cell populations in these single cell preparations. The healthy gastric corpus library was searched for the presence of cells meeting the pathological criterion of SPEM (Muc6+Gif+), but analysis of other metaplasia-associated gene transcripts determined that these cells lacked the aberrant gene expression programme associated with SPEM. Subsets of SPEM cells (Tff2+Muc6+Gif+) and potentially hyperplastic/metaplastic cells without chief cell transcript expression (Tff2+Muc6+Gif−) were identified and compared head to head to identify significant differences in cellular programming that would grant SPEM preneoplastic properties. However, these analyses revealed overwhelming transcriptional similarity between Gif+ and Gif-Tff2-expressing mucinous cells, suggesting shared ontology rather than a separation into unique subsets and an expansion of the definition of ‘SPEM’. Finally, a comparison of gastric SPEM cells identified in drug-induced and inflammation-induced SPEM revealed that, while inflammatory SPEM develops an immunoregulatory phenotype, the metaplastic programme is highly conserved between these two disparate inciting stimuli. These analyses dictate an expanded definition of SPEM to include cells without chief cell gene expression and that the cellular programme driving this lesion is highly conserved regardless of inciting aetiology.
Methods
Mice
Healthy BALB/c background mice were purchased from the Jackson Laboratory. TxA23 mice express a transgenic T cell receptor specific for a peptide from H+/K+ATPase alpha chain on a BALB/c background and have been previously described.28 29 31 32 All mice were maintained in our animal facility and cared for in accordance with institutional guidelines. Studies were performed on a mixed group of male and female mice with cohoused littermate controls. The use of high dose tamoxifen to induce parietal cell atrophy and SPEM development has been previously described.20 21 33 Briefly, tamoxifen (5 mg/20 g body weight, T006000, Toronto Research Chemicals) was injected intraperitoneally into 6–12 week old BALB/c mice once daily for 3 days. Tamoxifen was dissolved in a vehicle of 10% ethanol and 90% sunflower oil (S5007, Millipore Sigma).
Isolation of gastric epithelial single cell suspensions
Following sacrifice, stomachs were harvested from two mice per group, and draining gastric lymph nodes were removed. The forestomach and antrum were removed, and the corpus was cut along the inner curvature and opened. The corpus was washed in a bath of phosphate buffered saline to remove food and then immediately washed in a secondary bath of Advanced Modified Eagle’s Medium (MEM). Dissected corpuses were then placed in a 50 mL conical tube with 10 mL of prewarmed Gland Digestion Media (Advanced MEM+20 mM HEPES +0.2% bovine serum albumin (BSA)+1 × penicillin/streptomycin+50 µg/mL gentamicin) and 1 mg/mL collagenase 1A (C9891, Sigma Aldrich, St. Louis, Missouri, USA). Stomachs were agitated at 37°C for 30 min. Connective tissue was removed leaving behind gastric glands, which were then transferred to a 15 mL conical tube using Gland Rinse Media (DMEM/F12 Ham+1% penicillin/streptomycin+50 µg/mL gentamicin+0.5 mM dithiothreitol). Glands were resuspended in prewarmed Trypsin-EDTA (T3924, Millipore-Sigma) and incubated for 10 min at 37°C. Every 10 min, glands were agitated using a 1 mL pipette to aid in digestion. Following agitation, aliquots were taken, and the digestion progress was measured using a hemocytometer and trypan blue staining. Digestion was ceased when trypan blue staining revealed complete digestion of glands into single cells. Cells were then washed twice in phosphate-buffered saline (PBS)+0.1% BSA to quench enzyme activity. Single cells were then resuspended in DMEM+10% FBS for final cell count and loading on the Chromium Single Cell Controller.
Chromium single-cell 5’ library construction
The Chromium Single Cell Controller instrument was used in these studies according to recommended manufacturer protocols and has been described previously.34–37 Briefly, gastric corpus epithelial single cell suspensions were loaded on a Chromium Single Cell Controller instrument (10x Genomics, Pleasanton, California, USA) to generate single-cell gel beads in emulsion (GEMs). Single-cell RNA-Seq libraries were prepared using the Chromium Single Cell 5′ Library & Gel Bead Kit (P/N 1000006, 10x Genomics). GEM-RT was performed in a Veriti 96-Well Thermal cycler (Applied Biosystems, 4375786): 53°C for 45 min, 85°C for 5 min; held at 4°C and stored at −20°C. The GEMs were then broken, and the single-strand cDNA was cleaned up with DynaBeads MyOne Silane Beads (Thermo Fisher Scientific; P/N 37002D). Barcoded, full-length cDNA was amplified using the Veriti 96-Well Thermal Cycler: 98°C for 45 s; cycled 13×: 98°C for 20 s, 67°C for 30 s and 72°C for 1 min; 72°C for 1 min; held at 4°C. Amplified cDNA product was cleaned up with the SPRIselect Reagent Kit (0.6× SPRI; Beckman Coulter; P/N B23318). 5′ gene expression libraries were constructed using the reagents in the Chromium Single Cell 3′/5′ Library Construction kit (P/N 1000020). For 5′ gene expression library construction, these steps were followed: (1) fragmentation, end repair and A-tailing; (2) postfragmentation, end repair and A-tailing cleanup with SPRIselect; (3) adaptor ligation; (4) postligation cleanup with SPRIselect; and (5) sample index PCR and cleanup. Final quality control (QC) and Illumina sequencing of the prepared libraries was performed by the Washington University in St. Louis Genome Technology Access Center or McDonnell Genome Institute.
Raw data were processed through the CellRanger 3.0 pipeline (10x Genomics), and secondary clustering and differential expression analysis were conducted in Seurat/R.38
Prior to clustering, all libraries and subsets were processed to ensure quality. Genes relating to mitochondria-localised proteins are markers for broken or low-quality cells.39 Consequently, low-quality cells expressing high levels of mitochondrial markers above a majority threshold unique to each library/subset were filtered out before downstream analysis. Each library was then globally scaled and normalised by a scale factor of 1×10⁴ and log transformation. Additionally, unwanted sources of variation attributed to biological noise and batch effect were identified and regressed out to improve downstream analysis and dimensionality reduction.40
Components for clustering were generated by canonical correlation analysis. High signal canonical correlates explaining the most variance in comparison identity classes were aligned by dynamic time warping, and their dimensions were used for subsequent shared nearest neighbour clustering and visualisation by t-SNE.41 Globally distinguishing genes for each cluster and comparison identity class were identified by calculating the normalised gene expression for the average single cell. Significant genes with at least a twofold change and corrected p value less than 0.01 were identified via Wilcoxon rank-sum test with Bonferroni correction for multiple comparisons.
Immunofluorescence
Stomachs were prepared, stained and imaged using methods modified from Ramsey et al.42 Briefly, paraffin-embedded specimens were cut into 5 µm sections, deparaffinised and rehydrated. After antigen retrieval with 10 mM sodium citrate (pH 6.0), sections were washed with PBS and blocked in 1% BSA and 0.3% Triton X-100 in PBS followed by overnight incubation with primary antibodies. The primary antibodies used for immunostaining were rat anti-CD44v (1:10 000 from Cosmo Bio, LKGM002) and goat anti-GIF (1:10,000, gift from Dr David Alpers, Washington University in St. Louis). After washing, sections were incubated with secondary antibodies and GS-II lectin (1:500, L21415, ThermoFisher). Sections were washed, stained with Hoechst (62249, ThermoFisher) 1:20 000 in PBS and mounted in ProLong Gold Antifade mountant (P36934, ThermoFisher).
Multicolour RNA− in situ hybridisation (RNAscope)
Tissue fixation and RNAscope assay (Advanced Cell Diagnostics, Hayward, California) was performed according to manufacturer recommendations. Briefly, gastric tissue was harvested from BALB/c and TxA23 mice and fixed for 24 hours in 4% paraformaldehyde at 4°C. Stomach tissue was then moved to 10% sucrose in PBS until tissue sank to the bottom, approximately 18 hours. Tissue was then moved to a 30% sucrose solution in PBS until sinking to the bottom of the tube, about 18 hours. Sections were pretreated using protease and incubated with probes targeting Tff2 (Cy3.5), Gif (FITC) and Muc6 (Cy5). Slides were washed thoroughly using wash buffer (Advanced Cell Diagnostics) after each hybridisation step at room temperature. Quantitation was performed by counting cells from three high power fields in the gastric corpus in each mouse with five-to-six mice per group.
Results
scRNA-Seq of murine gastric corpus epithelial cells identifies healthy and metaplastic cell lineages
The overall goal of these experiments was to define the transcriptional profile of SPEM from the single cell level. In order to do this, a method of gastric epithelial isolation initially developed for flow cytometric analysis was adapted for use with the 10x Genomics Chromium Controller platform.43 For the studies in this manuscript, individual epithelial cells were isolated from the corpus region of healthy murine stomachs and murine stomachs with drug-induced and inflammation-induced SPEM. To model the drug-induced SPEM response, a well-established drug-induced gastric injury model in which high dose tamoxifen (HDT) injections lead to severe atrophy and metaplasia in 3 days was used.20 21 33 For inflammation-induced SPEM studies, cells were isolated from the TxA23 mouse model of autoimmune gastritis demonstrated to develop parietal cell atrophy and SPEM in which SPEM developed over a 4-month period.18 24 28–30 Bar-coded cDNA libraries from thousands of individual cells from each condition were generated using the 10x Genomics Chromium Controller platform.44 The data were processed using CellRanger (10x Genomics) and aligned to the mouse genome. The combined libraries from healthy, acutely damaged and chronically inflamed stomachs contained 29 351 individual cells with an average of 1923 genes and 11 431 unique molecular identifiers (UMIs) detected per cell. Each transcript contained a UMI and a cell-specific bar code to identify individual transcripts and cells.
Once the captured transcripts of individual cells from each group were sequenced, the data from each group were combined and subjected to an unbiased t-SNE dimensionality reduction. We hypothesised that this unbiased approach would identify clusters of the known and most numerous gastric epithelial cell lineages in the normal library as well as SPEM cells arising in the diseased libraries. The shared nearest neighbour clustering algorithm, which defines groups of cells based on similar and differential gene expression, identified 15 clusters of cells (figure 1A). The cell types in these groups could be identified based on the presence and absence of transcripts for known epithelial cell and SPEM cell transcripts. For example, gene transcripts used to identify clusters included: Atp4a (parietal cells), Muc6 (mucous neck cells), Muc5ac (foveolar or pit cells), gastric intrinsic factor (Gif; mouse chief cells) and Tff2 (SPEM cells) (figure 1B). The following clusters were identified: cluster 0:foveolar cells 1; cluster 1: mucous neck cells 1; cluster 2: foveolar cells 2; cluster 3: metaplastic cells; cluster 4: parietal cells 2; cluster 5: mucous neck cells 2; cluster 6: chief cells 1; cluster 7: chief cells 2; cluster 8: proliferating TFF2+cells; cluster 9: smooth muscle cells; cluster 10: endothelial cells; cluster 11: T/B cells 1; cluster 12: macrophages; cluster 13: neuroendocrine cells (G cells/D cells/ECL cells); and cluster 14: T/B Cells 2 (figure 1C). A more complete list of cluster-defining genes is provided in online supplemental figure 1. These data establish the ability to perform scRNA-seq on cells from the gastric corpus and to use unsupervised clustering algorithms to group different types of cells from healthy versus drug and inflammation damaged stomachs.
Supplemental material

Identification of gastric epithelial cell lineages using scRNA-seq and unbiased clustering. (A) t-Stochastic neighbour embedding (t-SNE) unbiased clustering of gastric epithelial cell suspensions isolated from BALB/c (red), TxA23 (blue) and HDT (green) mice. (B) Feature dot plots for Tff2, Muc6, Muc5ac, Gif and Atp4a. Cells with high relative expression for indicated target transcript denoted by intensity of purple colouring. (C) t-SNE plot of gastric epithelial cells from BALB/c, TxA23 and HDT mice in which algorithmically defined clusters are identified by colour. HDT, high dose tamoxifen.
Muc6+Gif+ cells present in the normal gastric mucosa are not a metaplastic lineage
While unbiased algorithmic analyses validated the isolation method and analytical approach, we used this dataset to address specific and targeted questions concerning the nature of SPEM. Muc6 and Gif are associated with corpus neck cells and chief cells (in mice), respectively. Coexpression of the proteins encoded by these transcripts has been associated with TFF2/spasmolytic polypeptide expression by immunofluorescent staining and is therefore used as a diagnostic criterion of SPEM. However, during normal gastric epithelial differentiation, chief cells are believed to be derived from the neck cell lineage, indicating that Muc6+Gif+ ‘transitional’ cells could be a feature of the normal mucosa. The rarity of transitional cells has made in-depth analysis with traditional histopathological methods difficult. Using our scRNA-seq libraries, we identified 1635 foveolar cells (Muc5ac+), 400 neck cells (Muc6+Gif−), 2032 chief cells (Gif+Muc6−) and 231 transitional cells (Muc6+Gif+) in the normal gastric mucosa of BALB/c mice, and the UMIs of genes of interest were quantitated. Muc6 was expressed most highly in neck and transitional cells and expressed only at low levels in small numbers of foveolar and chief cells (foveolar: 0±0.02; neck: 28±1.8; chief: 0±0.01; transitional: 54±4.5). Gif transcripts were most numerous in chief cells and transitional cells with very low detection in foveolar and neck cells (foveolar: 1±0.1; neck: 1±0.1; chief: 250±4.8; transitional: 92±7.2) (figure 2A,D). A critical question is whether transitional cells, which meet the SPEM criterion of expressing Muc6 and Gif concurrently, represent a metaplastic cell lineage in the normal gastric mucosa. If this were true, it would mean that these ‘metaplastic’ cells were a normal feature of the gastric epithelium, and it would also indicate that this cellular niche could be simply expanded rather than derived via differentiation during the response to acute and chronic insults. TFF2 expression by MUC6+GIF+ cells is the canonical pathological definition of SPEM. To determine if Muc6+Gif+ cells identified in the scRNA-seq libraries had a metaplastic phenotype, Tff2 transcripts were quantified. Per cell Tff2 expression was on average 10 times higher in foveolar cells compared with the other cell types analysed and was only detected in a small subset of cells analysed, regardless of lineage (foveolar: 2±0.1; neck: 29±4; chief: 2±0.3; transitional: 3±1.4) (figure 2B,D). In addition to Tff2 expression, wound healing and intestinal transcripts such as Cd44, Dmbt1, Cftr, Gkn3 and Sox9 have been associated with SPEM as these cells develop ectopic expression due to a change in cellular programme that supports mucosal reconstitution.13 22 45 46 In addition to negligible Tff2 expression, this analysis determined that the expression of Cd44, Dmbt1, Gkn3 and Cftr were undetectable in nearly all of healthy cells analysed, including transitional cells. This further supports the hypothesis that transitional cells are not a metaplastic lineage in the normal gastric mucosa (figure 2C,D). Interestingly, while Sox9 is generally associated with wound healing and metaplasia, UMIs for this transcript were detected at low levels in a small proportion of all the cell subsets measured. These data indicate that Muc6+Gif+ transitional cells present in the normal epithelium are not metaplastic as determined by gene expression, supporting the idea that SPEM truly requires aberrant gene expression programme not found in the steady state rather than simple expansion of rare preexisting cellular niches. These analyses also emphasise the point that, while Muc6 and Gif are expressed by SPEM cells, using this criterion alone for identifying the lesion may be problematic because coexpression of these lineage genes occurs in the normal mucosa by a small subset of cells not exhibiting other transcriptional features of metaplastic programming.

Muc6+Gif+ cells present in normal gastric mucosa are not a metaplastic lineage. 1635 Muc5ac+ foveolar cells, 400 Muc6+Gif neck cells, 2032 Gif+Muc6− chief cells and 231 Muc6+Gif+ transitional cells were identified in single cell libraries generated from normal BALB/c gastric mucosa. (A) Per cell UMI counts of Muc6 and Gif transcripts in Muc5ac+, Muc6+, Gif+ and Muc6+Gif+ populations. (B) Per cell UMI counts of spasmolytic-polypeptide/Tff2 transcripts. (C) Per cell UMI counts of SPEM-associated transcripts Dmbt1, Cd44, Cftr, Sox9 and Gkn3. (D) Table of average UMI counts of indicated genes in the normal gastric epithelial cell populations. Red bar indicates average UMI count per cell in each cell subset. Significance determined unpaired Student’s t-test. Gif, gastric intrinsic factor; Muc6, Mucin 6; SPEM, spasmolytic polypeptide-expressing metaplasia; Tff2, trefoil factor 2; UMI, unique molecular identifier.
SPEM and hyperplastic/hypertrophic mucous neck cells that develop during chronic inflammation are transcriptionally indistinguishable
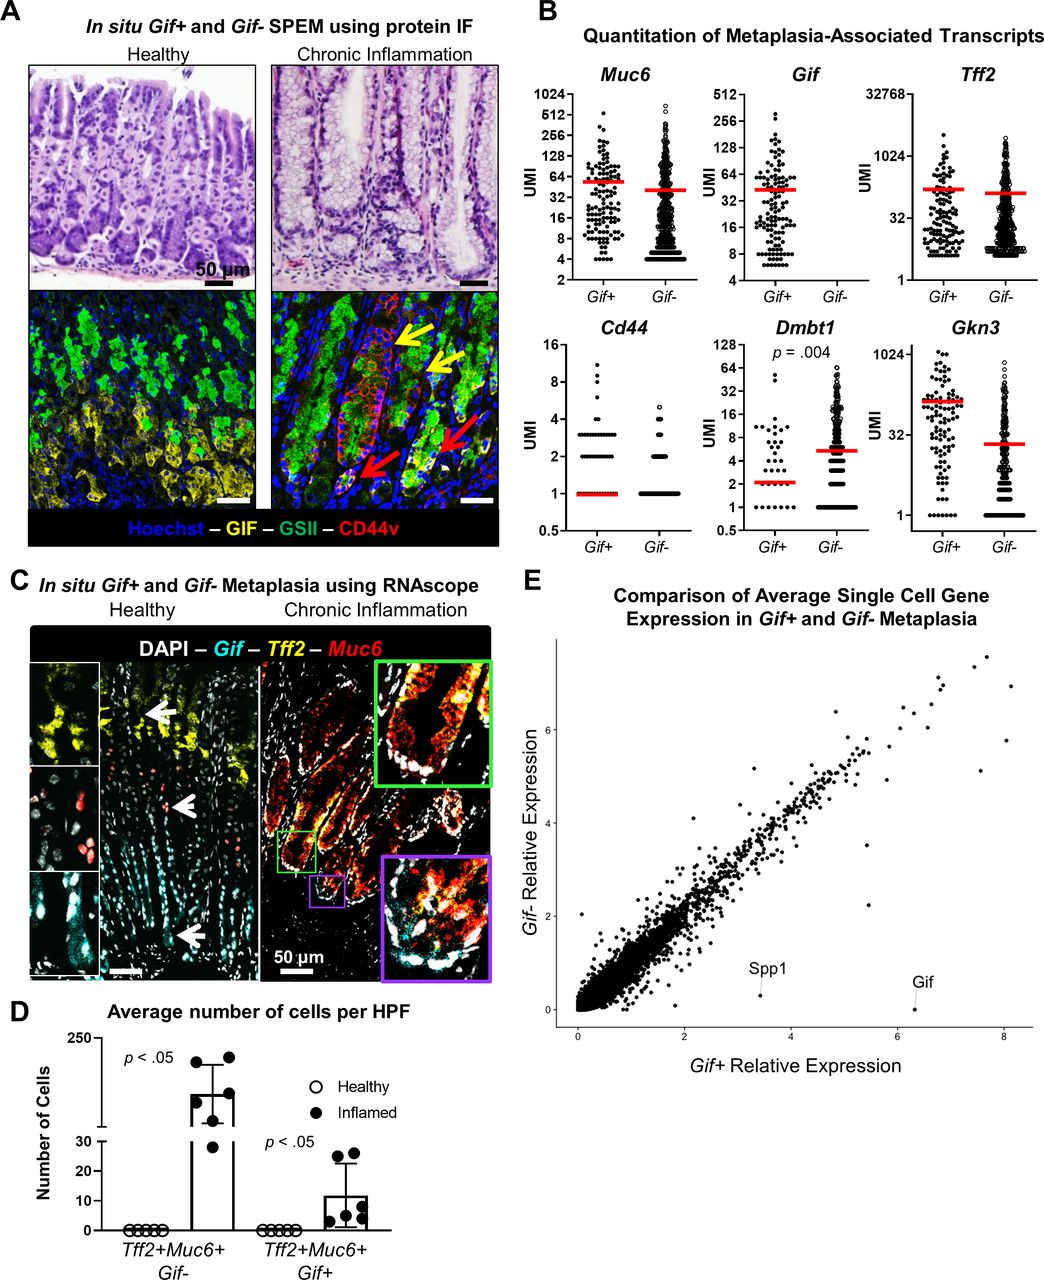
Up to this point, studies of SPEM cells have been primarily performed using cytological criteria including immunofluorescent analyses. It has been well described that during chronic gastritis, two different protein expression patterns are observed: TFF2+MUC6+GIF+ canonical spasmolytic polypeptide (TFF2) expressing metaplasia (SPEM) and TFF2+MUC6+GIF− mucinous cells that lack mature chief cell gene expression. In addition to different protein expression patterns, these lesions also look qualitatively different by bright field microscopy.18 27 47 This pathological distinction is critical because it has been hypothesised that SPEM is a potential precursor of intestinal metaplasia and eventual neoplastic transformation, while the risk posed by hyperplastic/hypertrophic neck cells is unclear.18 However, resolving these two cell populations for in-depth study has been problematic using traditional methodologies. Using immunofluorescence against MUC6 (GSII; green), GIF (yellow) and CD44v (red), we identified both hyperplastic/hypertrophic neck cells (yellow arrow) and canonical SPEM (red arrow) in the gastric corpus of mice with chronic gastritis (n=3 mice per group, figure 3A). To determine the differences in cellular programme between SPEM and hyperplastic/hypertrophic neck cells, we identified Tff2+Muc6+Gif+ SPEM cells and Tff2+Muc6+Gif neck cells in the libraries of cells from chronically inflamed stomachs (online supplemental figure 2A). We then generated new libraries containing transcriptional data from only these cells.

Gif+ SPEM and Gif− neck cell hyperplasia/hypertrophy have a similar metaplastic phenotype and transcriptional profile. (A) Representative bright field and immunofluorescent photomicrographs of gastric corpus of healthy BALB/c and chronically inflamed TxA23 mice at 4 months of age. Yellow arrows indicate GIF− neck cell hyperplasia/hypertrophy, red arrows indicate GIF+SPEM. n=3 mice per group. (B) Per cell UMI counts of metaplasia-associated transcripts Muc6, Gif, Tff2, Cd44, Dmbt1 and Gkn3. Red bar indicates mean UMI count per cell. Significance was determined using Wilcoxon ranked-sum test. (C) Representative fluorescent images of multicolor RNA in situ hybridisation of Tff2 transcripts (yellow), Gif transcripts (cyan) and Muc6 transcripts (red). White arrows indicate location of high magnification insets of Gif+, Muc6+ and Tff2+ cells. Green box indicates Gif-Muc6+Tff2+ cells, purple box indicates Tff2+Muc6+Gif+ canonical SPEM with corresponding high magnification inset images. (D) Quantitation of the average number of Muc6+Tff2+Gif- and Muc6+Tff2+Gif+ cells per HPF. Each dot represents the average number of cells counted from three HPFs in the gastric corpus of a single mouse. n=5–6 mice per group. Significance determined using an unpaired Student’s t test. (E) Dot plot of the relative expression of all detected transcripts calculated from the per-cell average relative expression from scRNA-seq data sets in Gif+ SPEM and Gif− neck cell hyperplasia/hypertrophy in chronic metaplasia. Gif, gastric intrinsic factor; HPF, high power field; Muc6, Mucin 6; SPEM, spasmolytic polypeptide-expressing metaplasia; Tff2, gastric intrinsic factor.
We obtained the per-cell UMI transcript count of SPEM-associated transcripts Muc6, Gif, Tff2, Cd44, Dmbt1 and Gkn3 in Gif+and Gif− metaplastic cells, with the expectation that canonical Gif+SPEM cells would have a higher expression for all these transcripts relative to Gif− neck cell hyperplasia/hypertrophy. Surprisingly, this initial hypothesis was rejected by the observation that, aside from the separation criterion of prototypical mature chief cell transcript Gif expression, these cell subsets had similar expression of transcripts associated with metaplastic programming, including Muc6, Tff2, Cd44 and Gkn3 (figure 3B). Interestingly Dmbt1, an intestinal transcript that has previously been used to denote advanced SPEM leading to intestinal metaplasia,22 is expressed by a significantly higher proportion of Tff2+Muc6+Gif cells compared with Gif+ canonical SPEM cells. Cftr and Sox9 expression were also assayed, but no significant difference in Cftr expression between Gif+ and Gif− subsets was observed. Additionally, there was no association of Sox9 with SPEM cells compared with normal cells in the healthy library, indicating that Sox9 may not be a reliable transcript for designating gastric metaplasia (data not shown). This targeted analysis of known SPEM-associated genes demonstrated that both hyperplastic/hypertrophic neck cells and SPEM developed ectopic gene expression programmes associated with wound healing and intestinal characteristics.
Much of the pioneering work identifying SPEM and its association with tissue repair and gastric cancer was generated using immunofluorescent staining. We used the information gained from the scRNA-seq to test a new approach, the RNAscope technology, to identify Tff2+ SPEM in the chronically inflamed stomach. Briefly, multiplexed in situ hybridisation was performed using fluorescently labelled complementary probes to detect Tff2 (yellow), Muc6 (red) and Gif (cyan) transcripts in healthy (left) and chronically inflamed (right) gastric tissue (figure 3C). As expected, in healthy gastric corpus tissue Tff2 transcripts were localised above the neck region, Muc6 to the neck region and Gif to chief cells at the base of the gland, indicated by the white arrows. In healthy tissue. there was no overlap in staining of these transcripts. This supports the use of Tff2 transcript detection in neck cells as a marker of an abnormal disease process. However, in stomachs with chronic autoimmune gastric metaplasia, glands containing Tff2+Muc6+Gif+ canonical SPEM cells (purple rectangle) and glands containing Tff2+Muc6+Gif- cells (green rectangle) were identified in proximity with one another throughout out gastric mucosa. Additionally, many glands contain a mixture of Gif+ SPEM localised to the base of the gland and Tff2+Muc6+Gif− metaplastic cells in the isthmal/neck region. We quantified the average number of Tff2+Muc6+Gif- and Tff2+Muc6+Gif+ cells in three high power fields (HPFs) from five-to-six healthy and chronically inflamed mice and observed that, while there was no colocalisation of these transcripts in stomachs from healthy mice, stomachs from chronically inflamed mice had significant increase in the average number of these cells per HPF (Tff2+Muc6+Gif−: 0±0 vs 111±29; Tff2+Muc6+Gif+: 0±0 vs 12±4) (figure 3D). These data indicate that RNA-based techniques such as RNAscope can be used to identify SPEM in situ based on the expression of Tff2 transcripts.
Finally, the overall transcriptional similarity of Gif+ and Gif−Tff2+Muc6+metaplasia was assessed by comparing the average per-cell expression level of all transcripts detected in the Tff2+Muc6+Gif+ single cell libraries to the Tff2+Muc6+Gif− single cell libraries. Aside from Gif, which was used as the criteria to subset the populations, nearly all transcripts were expressed at similar levels with only eight genes significantly associated with either Gif+ or Gif− metaplasia (figure 3E, online supplemental figure 2B). While there are some potentially important transcripts such as Spp1 (osteopontin) and Gkn3 (gastrokine-3) that are expressed at higher levels by Gif+ cells, this overwhelming degree of transcriptional overlap indicates that Tff2+Muc6+Gif+ SPEM and Tff2+Muc6+Gif− metaplastic cells most likely represent one population of cells operating the same metaplastic programme in which Gif expression varies from cell to cell. This result indicates that the definition of SPEM should include cells that do not express mature chief cell transcripts (such as Gif in the murine stomach).
The metaplastic response is conserved and develops an immunoregulatory phenotype during chronic inflammation
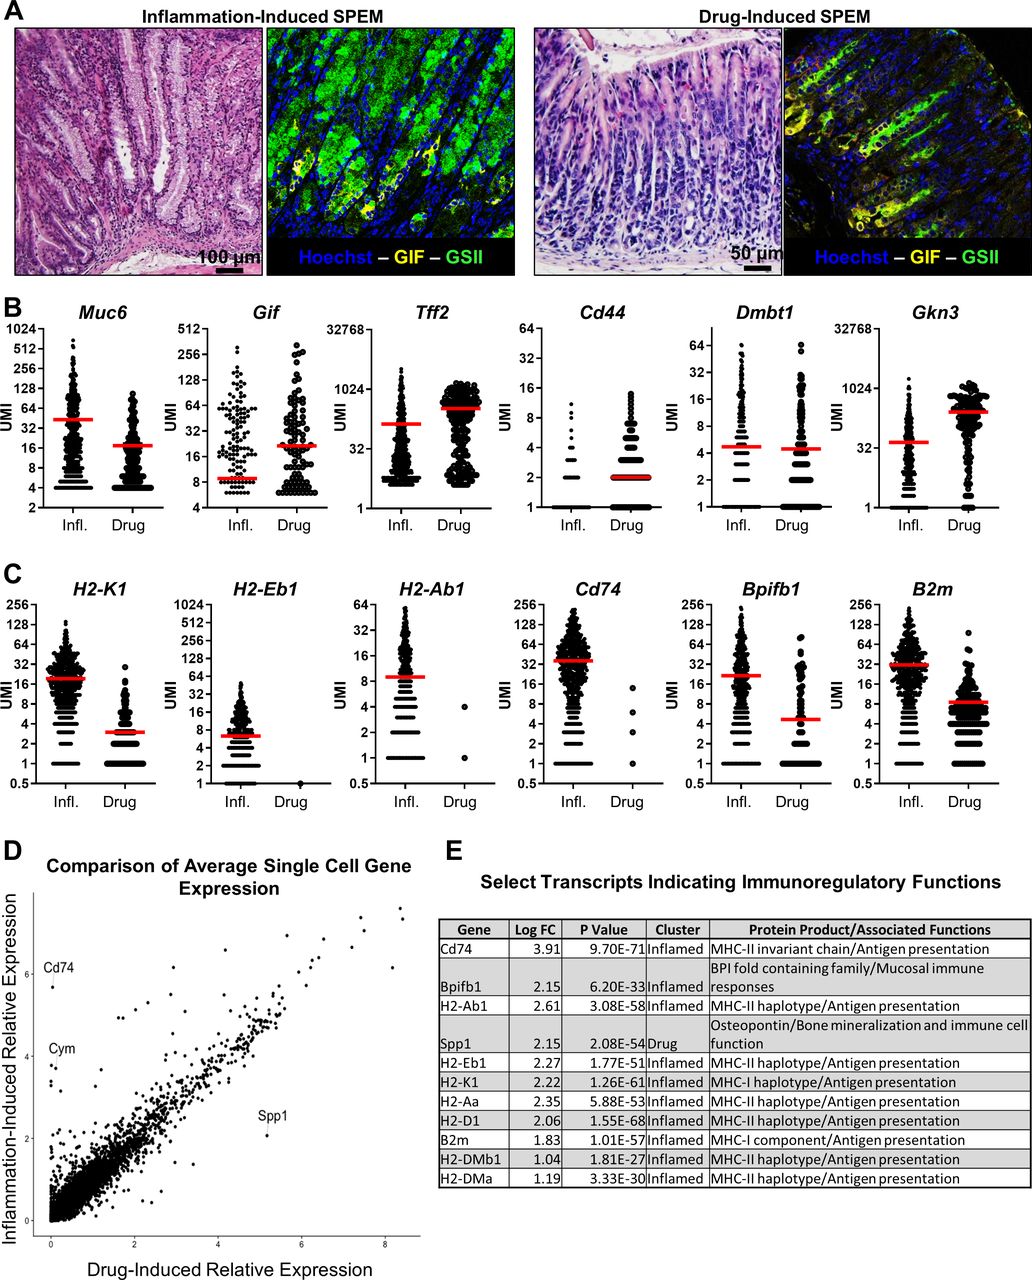
SPEM has been shown to develop in response to both acute injury and chronic inflammation. Acute drug-induced SPEM models such as HDT, L-635 and DMP-777 have been critical to understanding the response to gastric injury.17 18 21 22 33 Due to significant differences in both aetiology and time scale in drug-induced SPEM compared with chronic inflammatory SPEM that occurs during Helicobacter infection and autoimmunity, it has been hypothesised that SPEM cells that arise during drug-induced injury would differ significantly from those arising during chronic inflammation.27 If this were true, it would have significant implications for the interpretation and application of results derived from acute drug-induced SPEM models. Immunofluorescent analyses identified GS2+/MUC6+ (green) and GIF+ (yellow) SPEM cells in both drug-induced (HDT) and inflammation-induced (autoimmune) models of gastric injury and SPEM that we used to generate scRNA-seq libraries (n=3 mice per group, figure 4A). To determine whether drug-induced SPEM differed significantly from inflammation-induced SPEM, new libraries containing transcripts from Tff2+Muc6+Muc5ac− SPEM cells from the HDT and chronic inflammatory datasets were generated. In these analyses, the Gif+ and Gif− SPEM cells were combined into a single library, as the previous data suggest that aside from Gif expression, these Tff2 expressing cells are not distinct cell lineages and all meet the expanded transcriptional definition of SPEM (figure 3).

The metaplastic response is conserved and develops an immunoregulatory phenotype during chronic inflammation. Muc6+Tff2+ metaplastic cells were identified in libraries generated from the stomachs of mice with acute high dose tamoxifen-induced metaplasia and mice with chronic inflammatory metaplasia. (A) Representative bright field and immunofluorescent images of inflammation-induced and drug-induced SPEM. n=3 mice per group. (B) Per cell transcript counts of SPEM-associated transcripts Muc6, Gif, Tff2, Cd44, Dmbt1 and Gkn3. (C) Per cell transcript counts of genes significantly associated with inflammatory SPEM: H2-K1, H2-Eb1, Cd74, Reg3g and Chil4. Each dot represents one cell. Red bars indicate mean UMI count per cell. (D) Dot plot of the relative expression of all detected transcripts calculated from the per-cell average relative expression from scRNA-seq data sets in drug-induced and inflammation-induced SPEM cells. Gif, gastric intrinsic factor; Muc6, Mucin 6; SPEM, spasmolytic polypeptide-expressing metaplasia; Tff2, trefoil factor 2; UMI, unique molecular identifier.
The aforementioned SPEM-associated transcripts in the chronic and acute metaplasia libraries were quantified. UMI transcript counts of Muc6, Gif, Tff2, Cd44, Dmbt1 and Gkn3 revealed that drug-induced and inflammation-induced SPEM have similar expression levels of these genes (figure 4B). This suggests that, even over chronic time scales in an inflammatory environment, the metaplastic gene expression programme is highly conserved between these very different damaging stimuli. However, genes that enable epithelial cells to participate in the immune response such as H2-k1, H2-eb1, H2-Ab1, Cd74, Bpifb1 and B2m were expressed at higher levels in inflammatory SPEM cells (figure 4C). Finally, the per-cell average expression of all detected transcripts between drug-induced and inflammation-induced SPEM cells in the single cell libraries was compared in order to determine the similarity of their transcriptional programme. These analyses revealed a highly similar expression pattern in nearly all detected genes save for 40 transcripts identified in the dataset that were differentially expressed to a significant degree. Nearly all of the differentially expressed transcripts were associated with the inflammation-induced SPEM library and confer the ability of a cell to regulate and participate in the immune response (figure 4D,E; online supplemental figure 3A). These data indicate that the SPEM programme is conserved even when the inciting injury varies significantly (ie, 3-day HDT treatment vs 3 month gastritis) but that inflammation-induced SPEM develops immunoregulatory functions in addition to SPEM gene expression.
Discussion
The cellular composition of the gastric corpus includes several different epithelial cell lineages; each contributes to the overall function of the gastric unit. This cellular heterogeneity has made study of gastric corpus cell biology logistically difficult, as effects on one cellular type can be easily missed when using whole-organ lysate methodologies in combination with techniques like western blot, qRT-PCR and bulk RNA-seq. With the advent of scRNA-seq, it is now possible to isolate, identify and study hundreds to thousands of individual gastric epithelial cells, a significant advancement over techniques such as laser capture microdissection. Here, adapting methods we developed initially for analysing protein expression of gastric epithelial cells by FACS,43 we successfully isolated RNA from single cell suspensions using the Chromium single cell platform. Initial unsupervised analyses demonstrated the power of this technique in identifying mature and metaplastic (SPEM) gastric epithelial cell lineages. While the focus of this manuscript was SPEM, we observed subclusters within normal epithelial cell groups, particularly in the parietal cell cluster that had a group of cells placed some distance away from the remainder of the cluster. This suggests the possibility of multiple phenotypes of parietal cells and perhaps indicates the activation of a unique transcriptional programme in this group compared with the main cluster. As a further point, we used this technique to survey the entire healthy corpus library for the presence of Muc6+Gif+ cells that may represent a metaplastic niche that could be expanded rather than differentiated during injury. While we did find a small subset of cells meeting these criteria, they displayed none of the other features of a SPEM programme. It is still unclear whether these ‘transitional’ cells can develop a SPEM phenotype, but this undoubtedly requires reprogramming from the steady-state condition driven by the presence of injury and/or inflammation.
This study focused on the SPEM response to drug-induced damage caused by HDT and chronic inflammation in the corpus region of the stomach. It is generally agreed that the development of SPEM is critical for repair of the gastric mucosa in the event of acute injury such as ulceration. These proliferative cells reconstitute the injured tissue and, on removal of the insult, revert to fully differentiated epithelial lineages.13 48 However, in the event of chronic, non-resolving gastric injury, such as inflammation caused by autoimmunity or infection, these SPEM cells never revert and their proliferative nature in an inflammatory environment may increase the risk for mutational burden and eventual neoplastic transformation.11 49 Given the potentially critical relationship of these cells to gastric cancer risk, a variety of both acute and chronic model systems have been developed to study the SPEM response in mice that have added to the collective understanding of this cellular programme, but interpretation of the results has been controversial. In these studies, we used scRNA-seq analytical tools to address major questions concerning SPEM.
A major question we addressed was how the cellular programme of canonical SPEM (Tff2+Muc6+Gif+ ‘SPEM’) differs from another cellular lineage that arises during chronic inflammatory gastric injury (Tff2+Muc6+Gif- cells). This question is particularly important because of the focus on canonical SPEM as the key lesion driving tissue repair and conferring higher risk of eventual cancerous transformation.18 19 However, our attempt to identify the key differences in transcriptional programme between SPEM and Tff2+Muc6+Gif- cells indicated that Gif+ and Gif- Tff2-expressing mucinous cells are nearly indistinguishable from a transcriptional perspective. This suggests that Gif− ‘neck cell hyperplasia/hypertrophy’ operates from the same underlying transcriptional programme as Gif+ SPEM and that the expression of mature chief cell transcripts (Gif being the established prototype in murine stomach) does not denote significant transcriptional differences.
In addition to scRNA-seq analysis, we also identified RNA transcripts in situ using multiplexed fluorescent in situ hybridisation to localise Tff2, Muc6 and Gif transcripts in the gastric mucosa of healthy and chronically inflamed corpus. Expression of these transcripts in the healthy stomach is restricted to regions of the gastric unit with no observed overlap, supporting the use of Tff2 transcript as a marker of an abnormal cellular process in Muc6+ cells. In the diseased stomach, significant Tff2 and Muc6 costaining was labelled throughout the gland, while only faint Gif signal was detected at the base of the gland, suggesting a much lower level of Gif expression relative to healthy chief cells. Additionally, canonical Gif+ SPEM and Tff2+Muc6+Gif- cells were interspersed throughout both individual and adjacent corpus glands. Given the fact that Gif+ and Gif- metaplastic cells have an overwhelming overlap in both their gene transcription profiles and their physical location within the gastric unit, it is unlikely that Gif expression delineates a unique subpopulation of metaplastic cells. It is conceivable that perhaps Gif expression is lost gradually during the development of SPEM and that Gif+ cells are simply a subset of Tff2+Muc6+SPEM cells that have not reduced chief cell gene expression below the level of detection. There has been considerable controversy over whether SPEM arises from terminally differentiated chief cells or an isthmal progenitor.19 27 50 51 While the studies detailed herein are incapable of determining the cellular origins of SPEM, they indicate the resulting cells cannot be readily separated into phenotypically unique groups based on chief cell gene expression. Rather, the definition of SPEM should be expanded to include cells that lack mature chief cell transcripts. This finding could have critical implications given that many immunofluorescent definitions of SPEM would overlook ‘neck cell hyperplasia/hypertrophy’ as a significant risk factor—these cells must be evaluated moving forward. Finally, these data indicate that identifying Tff2 transcript expression is critical for proper identification of gastric metaplasia in future studies.
The final question addressed is whether SPEM arising from acute drug-induced atrophy models such as HDT over a matter of days is truly governed by the same programme as SPEM that develops in an inflammatory environment over the course of several months as it does in murine Helicobacter infection models and TxA23 mice.17 20 27 29 30 33 52 This question is particularly important because most human SPEM arises in the context of chronic inflammation, while the mechanistic data in murine models relies on a combination of acute and chronic models. We addressed this by identifying SPEM cells (Tff2+Muc6+Muc5ac−) present in the single cell libraries generated from drug-induced (HDT) and inflammation-induced (TxA23) models of SPEM and comparing their transcriptional programme. Importantly, SPEM gene expression was nearly identical between drug-induced and inflammation-induced SPEM cells. This remarkable degree of similarity indicates that, despite the fact that the drug-induced SPEM arose over a 3-day period and the inflammation-induced SPEM over 4 months in an inflammatory environment, cells in both settings operate based on a SPEM programme that is nearly indistinguishable. Most importantly, this means that the general cellular processes involved in generating SPEM cells are conserved between the drug-induced and inflammatory contexts, allowing for a more confident interpretation of studies involving these critical tools for the study of SPEM. This also provides additional support for the notion that SPEM is an acute phase reaction to injury that is maintained aberrantly in chronic scenarios. Similar to previous studies, which used laser-capture microdissection between chronic inflammation and drug injury models of SPEM,53 we identified some differences in gene expression between these two aetiologies. However, while those studies identified a more ‘intestinalised’ phenotype in the chronically inflamed SPEM lesions, the upregulated genes identified in our scRNA-seq experiments were involved in antigen processing and presentation to cells of the adaptive immune response. This differing result could be due to the significant cell-to-cell variability we observed in intestinal transcript expression by scRNA-seq, which would confound microdissection data based on which lesions were selected. Additionally, the chronically inflamed gastric tissue used in that study had progressed for 12 months as opposed to 4 months for the TxA23 mice used here. Regardless, the gene expression pattern identified here suggests a capability to participate in and potentially direct the immune response, an observation of critical importance because the most common causes of SPEM in human patients are chronic infection and autoimmunity. Supporting this hypothesis is the recent finding that expression of the immune modulating proteins is an inflammatory epithelial response to H. pylori infection, which may protect these cells from the immune response.54 Understanding the transcriptional profile of inflammation-induced SPEM provides fuel for ongoing efforts to mechanistically understand the complex system of cellular damage and repair that takes place in human tissues.
Overall, these data support the conclusion that SPEM is a highly conserved transcriptional programme not found in the normal steady state mucosa. The results demonstrate that the definition of SPEM should be expanded to include Tff2 transcript-expressing cells that lack mature chief cell gene expression in the context of chronic inflammation. Additionally, the metaplastic responses to drug injury and inflammation are highly similar, with inflammatory SPEM developing a concurrent transcriptional profile that enables participation in the immune response which may play a role in regulating downstream events such as intestinalisation, dysplasia and carcinogenesis.
Acknowledgments
The authors would like to thank Joseph Burclaff and Jason Mills for assistance and advice on high-dose tamoxifen treatment of mice. We would also like to thank the Washington University in St. Louis Genome Technology Access Center and McDonnell Genome Institute for assistance with 10X Genomics Chromium Single Cell RNA isolation and Illumina sequencing. Additionally, we would like to thank Dr Grant Kolar, Barbara Nagel and Caroline Murphy of the Saint Louis University Research Microscopy and Histology Core for assistance with fluorescent microscopy assays and Dr Joel C Eissenberg for critical reading of the manuscript.
Footnotes
KAB and SAL contributed equally.
Contributors KAB was responsible for study concept and design, acquisition of data, analysis and interpretation of data, drafting of the manuscript and revision of manuscript. SAL was responsible for analysis and interpretation of scRNA-seq data sets, drafting of the manuscripts and revision of the manuscript. KJW was responsible for interpretation of data and revision of the manuscript. CNN and NMJ assisted in data acquisition, interpretation and revision of the manuscript. ELF acquired data and provided technical support. T-HA was involved in study concept and design, analysis and interpretation of data and revision of the final manuscript. RJD obtained funding and was involved in study concept and design, data interpretation and revision of the manuscript.
Funding KAB was supported by a National Institutes of Health (NIH)/NIDDK NRSA Predoctoral fellowship (F30 DK118873). RJD was supported by the NIH National Institute of Diabetes and Digestive and Kidney Diseases (R01 DK110406). RJD was previously supported by the American Cancer Society (RSG-12-171-01-LIB) and the American Gastroenterological Association Funderburg Award.
Competing interests None declared.
Patient consent for publication Not required.
Provenance and peer review Not commissioned; externally peer reviewed.
Data availability statement All data relevant to the study are included in the article or uploaded as supplementary information.
Author note Transcript profiling: database link will be provided on acceptance.