Article Text

Abstract
Objective Intestinal metaplasia (IM) is a premalignant stage that poses a greater risk for subsequent gastric cancer (GC). However, factors regulating IM to GC progression remain unclear. Previously, activated DNA damage response (DDR) signalling factors were shown to engage tumour-suppressive networks in premalignant lesions. Here, we interrogate the relationship of DDR signalling to mutational accumulation in IM lesions.
Design IM biopsies were procured from the gastric cancer epidemiology programme, an endoscopic surveillance programme where biopsies have been subjected to (epi)genomic characterisation. IM samples were classified as genome-stable or genome-unstable based on their mutational burden/somatic copy-number alteration (CNA) profiles. Samples were probed for DDR signalling and cell proliferation, using the markers γH2AX and MCM2, respectively. The expression of the gastric stem cell marker, CD44v9, was also assessed. Tissue microarrays representing the GC progression spectrum were included.
Results MCM2-positivity increased during GC progression, while γH2AX-positivity showed modest increase from normal to gastritis and IM stages, with further increase in GC. γH2AX levels correlated with the extent of chronic inflammation. Interestingly, genome-stable IM lesions had higher γH2AX levels underscoring a protective anti-cancer role for DDR signalling. In contrast, genome-unstable IM lesions with higher mutational burden/CNAs had lower γH2AX levels, elevated CD44v9 expression and modest promoter hypermethylation of DNA repair genes WRN, MLH1 and RAD52.
Conclusions Our data suggest that IM lesions with active DDR will likely experience a longer latency at the premalignant state until additional hits that override DDR signalling clonally expand and promote progression. These observations provide insights on the factors governing IM progression.
- gastric metaplasia
- gastric cancer
- DNA damage
This is an open access article distributed in accordance with the Creative Commons Attribution Non Commercial (CC BY-NC 4.0) license, which permits others to distribute, remix, adapt, build upon this work non-commercially, and license their derivative works on different terms, provided the original work is properly cited, appropriate credit is given, any changes made indicated, and the use is non-commercial. See: http://creativecommons.org/licenses/by-nc/4.0/.
Statistics from Altmetric.com
Significance of this study
What is already known on this subject?
Activated forms of DNA damage response (DDR) signalling factors accumulate in premalignant lesions of the lung, colon and breast and engage in downstream tumour-suppressive networks.
Thus, a protective role for DDR signalling against cancer progression has been proposed. However, due to the difficulty in obtaining sufficient premalignant biopsy material for parallel immunohistochemistry and genomic studies, the relationship between DDR signalling to mutational burden/copy-number alterations (CNAs) remains unclear.
Moreover, the applicability of the DDR paradigm to gastric cancer (GC) is unclear.
What are the new findings?
MCM2 levels, indicative of cell proliferation gradually increased with GC progression, while γH2AX accumulation, suggestive of DDR signalling correlated with chronic inflammation and increased with GC progression.
Importantly, an inverse correlation between DDR activation and mutational/CNAs was observed in precancerous intestinal metaplasia lesions.
The gastric stem cell marker CD44v9 which is known to provide higher adaptation to inflammation-dependent reactive oxygen species accumulated in genome-unstable IM lesions.
Modest promoter hypermethylation of the DNA repair factors WRN, MLH1 and RAD52 was also observed in genome-unstable samples.
Significance of this study
How might it impact on clinical practice in the foreseeable future?
These data are among the first to directly correlate higher DDR signalling with lower propensity to accumulate genomic instability at the premalignant IM stage.
We propose that the γH2AX/MCM2/CD44v9 profiling of larger IM cohorts with accompanying genomic characterisation will facilitate design of better risk stratification strategies for IM lesions.
Introduction
Gastric cancer (GC) is the third leading cause of cancer-related deaths with high incidence in high-risk Asian regions.1 The most common form of GC, the intestinal-type, is initiated as chronic inflammation which progresses sequentially as gland loss or atrophic gastritis, intestinal metaplasia (IM), dysplasia and adenocarcinoma.2 The principal initiator of intestinal-type GC (IGC) is recognised as Helicobacter pylori infection which fosters an environment of chronic inflammation and triggers (epi)genomic downstream cascades.3 4
IGC is proposed to be preceded by a series of precancerous events in a model of multistep carcinogenesis.2 The first recognisable histological change is chronic inflammation which can be either accompanied by no gastric gland loss (chronic non-atrophic gastritis), or with gland loss (chronic atrophic gastritis). Atrophic gastritis is followed by IM in which normal gastric mucosa is replaced by glands having an intestinal morphology.2 5 In recent studies, IM has been shown to arise by parietal cell loss and consequent metaplastic trans-differentiation of the chief cells into intestinal-like glandular structures.6 IM is classified as the small intestine/complete-type or colonic/incomplete type with the incomplete-type more likely to progress into adenocarcinoma.7 In particular, much attention has been given to the precancerous IM stage because it is considered a point-of-no-return in H. pylori-infected patients even after bacterial eradication.8 9 IM prevalence is greater in patients with relatives having GC, in smokers, increases with age and poses an estimated annual risk of 0.13% to 0.25% for GC per year.10 11
Although IM is detected in nearly one out of four patients undergoing endoscopy, there is no clear consensus on how IM lesions should be stratified for future routine endoscopic surveillance. According to the international guideline MAPS (management of precancerous conditions and lesions of the stomach), patients with moderate-to-severe atrophic gastritis and marked IM in both the corpus and antrum together with dysplasia are recommended to undergo endoscopic surveillance.12 13 Serum pepsinogen levels, and classifications of gastritis known as the operative link on gastritis assessment (OLGA) and operative link on gastritis intestinal metaplasia (OLGIM) integrating both the severity and location of atrophy/IM, are proposed to assist risk stratification.12 14 As such, more studies are needed to elucidate the underlying biology of IM to GC transformation.
One potential mechanism that can regulate IM to GC progression is the DNA damage response (DDR) pathway. Cells have evolved sophisticated mechanisms to precisely detect, signal and repair DNA damage, and mount a tumour-suppressive response collectively called as the DDR.15 DDR includes a network of proteins that detect DNA lesions and activate downstream responses like DNA repair, cell cycle checkpoints, senescence or apoptosis and can be quantified experimentally by the levels of phosphorylated H2AX, ATM, CHK2 and p53. In landmark studies, DDR was found activated in precancerous lesions of the lung, colon, breast, skin and urinary bladder by preventing further propagation of such damaged cells inducing them to undergo senescence.16–19 However, the original studies were based on immunohistochemical examination of precancerous biopsies and contemporaneous data on the mutational status was unavailable. Thus, the role of DDR signalling in premalignant lesions especially pertaining to the accumulation of mutational/chromosomal aberrations remains mostly unknown.
We used a resource of biopsy samples from patients enrolled in gastric cancer epidemiology programme (GCEP), an endoscopic surveillance programme with minimum clinical follow-up of 5 years to conduct IHC analysis. Our earlier comprehensive (epi)genomic characterisation revealed that IM samples had a low mutational burden (mutation rate - 2.6 and 6.9 mutations per Mb in IM and GC, respectively) and only <5% of all IM samples harboured known cancer driver mutations.20 Similarly, somatic copy-number alterations (CNAs) were found in ~12.5% of IMs as against none in the normal samples. Notably, samples with greater CNAs had a higher propensity for progression in a multivariate analysis.20
Here, we used H2AX phosphorylation at serine 139 (γH2AX) by the apical DDR kinases, ATM, ATR and DNAPK-cs, as a surrogate marker for DNA damage signalling.21 We developed quantitative immunohistochemistry IHC (qIHC) methods to reliably quantify DNA damage and cell proliferation through automated cell recognition and image analysis. We also integrated our immunohistochemical findings with previously reported (epi)genomic features for the same samples. Our results suggest that IM lesions with activated DNA damage signalling have lower accumulation of mutation/CNAs and thus may exhibit a different trajectory towards tumour progression as compared with lesions that have not activated their DDR pathway. Our studies also imply a potential role for CD44v9 in promoting greater reactive oxygen species (ROS) defence22 and in attenuating tumour-suppresive DDR signalling in genome-unstable IM lesions. These observations, in turn raise valuable insights for developing biomarkers for IM risk stratification.
Methods
Clinical samples
Commercial tissue microarrays (TMAs) - Formalin-fixed, paraffin-embedded (FFPE) stomach tissue from anonymised patient samples, spotted as TMAs (US Biomax, Rockville, Maryland) were used. The TMA, #ST1001 (US Biomax), spotted as cores with 1 mm diameter and 5 µM thickness was used to compare MCM2 and γH2AX across stomach tissues graded as normal, inflammation or atrophic gastritis with IM. The TMA #IC00011B (US Biomax), spotted as cores with 1.5 mm diameter and 5 µM thickness was used to compare MCM2 and γH2AX across stomach tissues graded as gastritis with IM or intestinal-type gastric cancer (IGC). For both ST1001 and IC00011B TMAs, the cores which were insufficient were excluded from the final analysis.
Archival samples of gastritis - To compare the relationship between chronic inflammation and DDR signalling, nine non-atrophic gastritis (NAG) biopsies from H. pylori-negative gastritis subjects were retrieved from the archives of the Department of Pathology, National University Hospital, Singapore, following our Institutional Review Board regulations. Chronic inflammation of the gastritis tissue was categorised as negative and positive by certified pathologists (SS and MT).23
Tissue biopsies from the GCEP cohort - GCEP is a multicentre longitudinal study comprising of 2980 subjects who were of Chinese ethnicity, above the age of 50 and were suffering from dyspepsia, heartburn or had a family history of gastric cancer. These patients were followed-up for at least 5 years. The study was approved by the Domain Specific Review Board, a part of the National Healthcare group and Centralised Institutional Board of Singapore Health Services. Written informed consents were obtained from all participants. Upper gastrointestinal endoscopy was performed by credentialed endoscopists and six biopsies were taken for histological examination and were classified as mild, moderate or marked for the degree of chronic gastritis, H. pylori infection, gastric atrophy and IM according to the updated Sydney system for classification and gastritis gradation.23 IM diagnosis and extent were confirmed by pathological examination of Alcian Blue-stained serial sections. From this GCEP cohort, we selected two groups of patients; the first group comprised of normal, marked gastritis and marked IM (n=19) and a second group comprised of samples with IM and had been subjected to prior genomic characterisation (n=15). Normal gastric biopsies were those who were H. pylori serology-negative, free of early gastric neoplasm and any other cancers, without gastric atrophy, without IM, free of dysplasia or polyps throughout the period of surveillance endoscopies.
Immunofluorescence staining of FFPE sections, multispectral acquisition and image analysis
Detailed methods for qIHC staining, imaging and data analysis are provided in supplementary methods, online supplementary figure S1 and online supplementary table 1. Briefly, FFPE sections were deparaffinised, rehydrated and subjected to heat-based antigen retrieval. Following blocking, slides were stained using the Opal 4-colour Multiplex Kit (Perkin Elmer, # NEL810001KT) based on the tyramide signal amplification method. Immunofluorescence images were captured on the Vectra multiplex pathology system (Perkin Elmer) using the 20x objective lens. The inForm 2.2 (Perkin Elmer) image analysis software with built-in capability for tissue segmentation, cell segmentation and precise fluorescence quantification was used.
Supplemental material
Supplemental material
Supplemental material
Supplemental material
For tissue scoring, fluorescent intensity cut-off values were used to calculate positivity. The detailed method used for scoring tissues is described in supplementary methods. The panel labelled as ‘Digital H&E’ in the Figures is a simulated bright field image obtained by using Hoechst 33342 and tissue autofluorescence as masks. Markers of interest such as MCM2, γH2AX or CD44v9 were pseudo-coloured brown and overlaid with the digital H&E image to enable the visualisation of positive cells in the context of the gastric gland architecture. The panel labelled as ‘Scoring map’ refers to inForm software-generated digital images where cells positive for the marker of interest were pseudo-coloured and overlaid on digital H&E images.
Antibodies used in the study
γH2AX (clone JBW301, #05–636, Merck Millipore), MCM2 (clone D7G11, #3619S, Cell Signalling technology), EpCAM (9C4, #324202, BioLegend), pan-Cytokeratin (C-11, #Ab7753, Abcam), CDX2 (#EPR2464Y, Ventana), Ki67 for mouse IHC (clone TEC-3, #M7249, Dako, Agilent), Ki67 for human IHC (clone MIB-1, #7240, Dako, Agilent), CD44v9 (clone RV3, #LKG-M001, Cosmo Bio USA), anti-Rat Alexa Fluor 488 (#A21202, Thermo Fisher Scientific), Click-iT EdU Alexa Fluor 488 Imaging kit (#C10337, Thermo Fisher Scientific).
Statistical analysis
All qIHC data were subjected to pair-wise comparisons and tested for statistical differences using the non-parametric Mann-Whitney U test. Differences in DNA methylation levels between groups were compared using the Student’s t-test. Pearson’s correlation coefficient was computed to study the correlation between two markers of interest. Comparisons with p<0.05 were considered statistically significant. *denotes p<0.05, **denotes p<0.01, ***denotes p<0.001.
Results
Optimisation of epithelial segmentation, cell proliferation and DDR signalling markers for qIHC analysis of gastric tissues
We describe below optimised qIHC methods for quantifying cell proliferation and DDR signalling in the stomach epithelial compartment.
Epithelial segmentation - Since the inForm image analysis software conducts automated epithelial segmentation, antibodies against the epithelial markers EpCAM or Cytokeratins (pan-Cytokeratin) were assessed for their ability to stain epithelial cells. However, a comparison of the mean fluorescence intensities (M.F.I) for EpCAM or pan-Cytokeratin individually revealed their lower expression in normal gastric tissues (online supplementary figure S2A,S2B). Hence, to enable robust algorithm-based tissue segmentation, tissues were probed for both EpCAM and pan-Cytokeratin. Tissue segmentation using
Supplemental material
EpCAM and pan-Cytokeratin staining patterns revealed excellent identification of epithelial cells (online supplementary figure S2C). Thus, combined EpCAM/pan-Cytokeratin staining was conducted throughout this study for optimal tissue segmentation.
MCM2 as a cell proliferation marker - Next, to identify a reliable marker for gastric cell proliferation, we conducted in vivo experiments using mouse models. Wild-type mice were injected the synthetic thymidine analogue, EdU (5-Ethynyl-2’-deoxyuridine), which is incorporated into newly synthesised DNA and thus marks proliferating cells with the gastric gland. Immunofluorescence analysis of EdU using Click-iT chemistry showed EdU positivity within the isthmus region of corpus and at the base of the glands in the antrum (online supplementary figure S2D,S2E).
To further identify a sensitive marker of gastric epithelial proliferation in an IHC setting, two commonly used proliferation markers, Ki67 or MCM2 were compared with EdU. Of these, Ki67 is a nuclear antigen that marks dividing cells with widespread clinical use.24 Mini-chromosome maintenance (MCM) proteins are DNA helicases that form the pre-replication complex and initiate DNA replication.25 MCMs are expressed abundantly across all phases of the cell cycle but are degraded in cells that have exited the cell cycle such as differentiated, quiescent and senescent cells, enabling them to be used as biomarkers of cell cycle proliferation.26
Similar to EdU incorporation, MCM2 and Ki67 antibodies also stained cells within the isthmus region of the corpus and at the base of the glands of the antrum. Closer examination revealed a broader zone of positivity for MCM2 with all EdU-positive cells being positive for MCM2. On the other hand, several EdU-positive cells were negative for Ki67 (online supplementary figure S2D,S2E). Validation studies in a K-Ras expressing precancerous GC model (eR1-CreERT2; KrasG12D mice)27 further revealed robust MCM2-positivity within the abnormal glands (online supplementary figure S2F). Lastly, human normal stomach, gastritis and IM tissues (n=3) were subjected to IHC staining of MCM2 and Ki67 to compare the two markers in human gastric tissues. Percent Ki67 or MCM2 positive nuclei over the nuclei of representative gastric/metaplastic cells were quantified in representative areas of the entire endoscopic biopsy. Ki67 and MCM2 staining closely correlated in normal and gastritis tissues, whereas the percent MCM2 positivity was slightly higher than Ki67 in some areas of IM (online supplementary figure S2G,online supplementary table 2). These data demonstrate the value of MCM2 as a sensitive gastric cell proliferation marker.
γH2AX as a marker of DDR signalling - The phosphorylation of histone H2AX at serine 139, also called as γH2AX, is one of the most widely used markers of DNA damage signalling.21 FFPE cell blocks of HGC-27 cells were left untreated or exposed to irradiation (2 Gy) and stained with the γH2AX antibody. As expected, radiation treatment induced γH2AX signals (online supplementary figure S3A). As further validation of the γH2AX antibody, M.F.I values for γH2AX were significantly lower in HGC27 cells subjected to H2AX-knockdown as compared with control-knockdown cells on exposure to etoposide (online supplementary figure S3B,S3C).
Supplemental material
Increased MCM2 positivity during gastric cancer progression
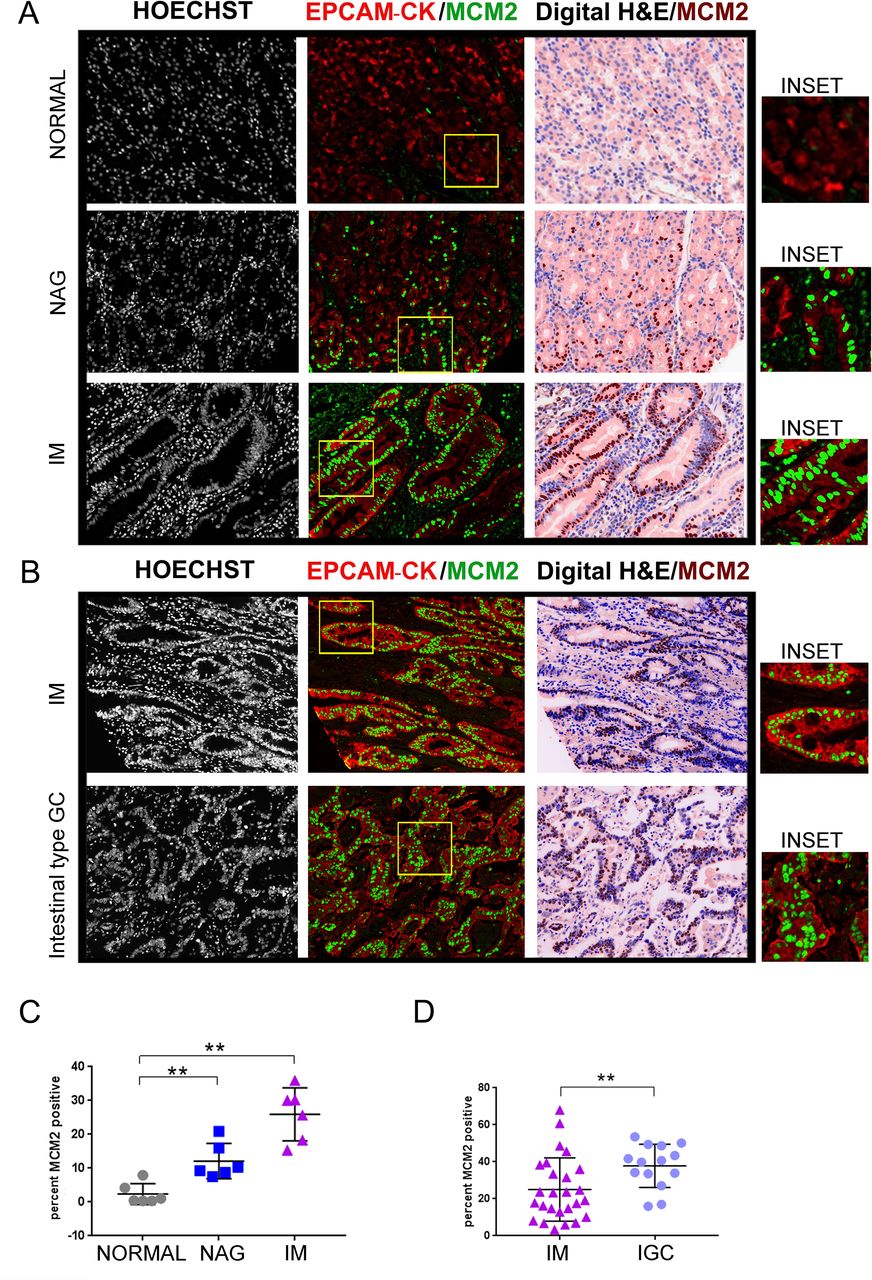
Using the methods established above, we profiled tissues spanning the stomach cancer spectrum. The TMA slide (ST1001) (online supplementary table 3) was stained with EpCAM/pan-Cytokeratin and MCM2 antibodies. MCM2 positivity per core was then averaged across two technical replicates and computed as 2.3%±1.2%, 12.1%±2.1% and 25.9%±3.1%, in the normal, gastritis and IM tissues, respectively (normal vs NAG, p=0.0043; normal vs IM, p=0.0022) (figure 1A and C).

MCM2 positivity increases during GC progression. (A) TMA slide (ST1001) was stained with antibodies against EpCAM/pan-Cytokeratin (CK) and MCM2. Six cases each of normal gastric tissues, NAG and IM were analysed. (B) TMA slide (IC00011B) was stained with antibodies against EpCAM/pan-Cytokeratin (CK) and MCM2. Twenty-six cases of IM and 14 cases of IGCs were analysed. The panel labelled as digital H&E is a simulated bright field image obtained by using Hoechst 33342 and tissue autofluorescence as masks. The MCM2 staining pseudo-coloured as brown, has been overlaid on the the digital H&E image. Areas marked by the yellow rectangle within the fluorescent images have been zoomed by two-fold under the images marked as ‘inset’. (C) Plot shows percent MCM2 positivity across the three stages, normal, NAG and IM. (D) Plot shows percent MCM2 positivity across IM and adenocarcinoma. Line within the vertical scatter plot shows the mean value. Error bar shows ±SD. Statistical significance was analysed by the Mann-Whitney non-parametric test. **p<0.01. GC,gastric cancer; IM, intestinal metaplasia; NAG, non-atrophic gastritis; TMA,tissue microarrays.
To compare the IM stage with IGC, we used another TMA slide (IC00011B) with greater number of IM samples. Of the 40 cores analysed, 26 cores were atrophic gastritis with IM and 14 were IGC (online supplementary table 4). The percent positivity of MCM2 in the IM and adenocarcinomas was 25%±3.3 and 37.81%±3.1%, respectively (IM vs IGC, p=0.0063) (figure 1B and D). Thus, positivity for MCM2 increased in the order of normal, NAG, IM and gastric adenocarcinomas, ascertaining increased proliferation through the carcinogenesis cascade.
Moderate increase in γH2AX positivity in gastric precancerous lesions
The TMA slide ST1001 (online supplementary table 5) were subjected to multiplex IHC staining with EpCAM/pan-Cytokeratin and γH2AX antibodies. The percent γH2AX positivity per core was then averaged across the two technical replicates and computed in the normal, gastritis and IM as 9.5%±3.9%, 19.75%±9.3% and 30.28%±9.2%, respectively (normal vs NAG, p=0.55; normal vs IM, p=0.0359; NAG vs IM, p=0.2810) (figure 2A and C). To compare DDR signalling levels between IM and IGC, TMA slide IC00011B was stained with EpCAM/pan-Cytokeratin and anti-γH2AX antibodies (online supplementary table 4). IHC analysis revealed significantly greater γH2AX-positivity at the IGC stage (IM vs IGC, 12.79%±2.10% and 33.9%±6.3%, respectively, p=0.0025) (figure 2B and D). These results indicate an increase in DDR signalling from normal tissue to IM, with further elevation in gastric adenocarcinomas.

Modest increase in γH2AX positivity during GC progression. (A) TMA slide (ST1001) was stained with antibodies against EpCAM/pan-Cytokeratin and γH2AX. Seven cases of normal, eight cases of NAG and six cases of IM were analysed. (B) TMA slide (IC00011B) was stained with antibodies against EpCAM/pan-Cytokeratin (CK) and γH2AX. Twenty-six cases of IM and 14 cases of IGCs were analysed. The γH2AX staining shown with pseudo-brown colour has been overlaid on the digital H&E image. Areas marked by the yellow rectangle within the fluorescent images have been zoomed by two-fold under the images marked as ‘inset’. (C) Plot shows percent γH2AX positivity across the three stages, normal, NAG and IM. (D) Plot shows percent γH2AX positivity across IM and IGCs. Line within the vertical scatter plot shows the mean value. Error bar shows ±SD. Statistical significance was analysed by the Mann-Whitney non-parametric test. * p<0.05, **p<0.01. GC,gastric cancer; IGC, intestinal-type gastric cancer; IM, intestinal metaplasia;NAG, non-atrophic gastritis; TMA, tissue microarrays.
Since the TMAs used above lacked clinical information or follow-up, we used samples from the GCEP cohort (n=19), comprising of normal, NAG and IM tissues for further validation (online supplementary table 6). γH2AX-positivity was computed in the normal, gastritis and IM tissue as 6.4%±1.9%, 26.89%±9.34% and 21.53%±6.7%, respectively (figure 3A and B) (normal vs NAG, p=0.1807; normal vs IM, p=0.0411). An overlay of γH2AX-fluorescence the digital H&E image clearly showed γH2AX-positive cells within glands harbouring the intestinal phenotype. Consistently, when serial sections of IM were stained either with antibodies against γH2AX or CDX2 a known marker for IM,28 many CDX2-positive cells were also positive for γH2AX, confirming that gastric cells that have undergone intestinalisation exhibit activated DDR signalling (online supplementary figure S4).
Supplemental material
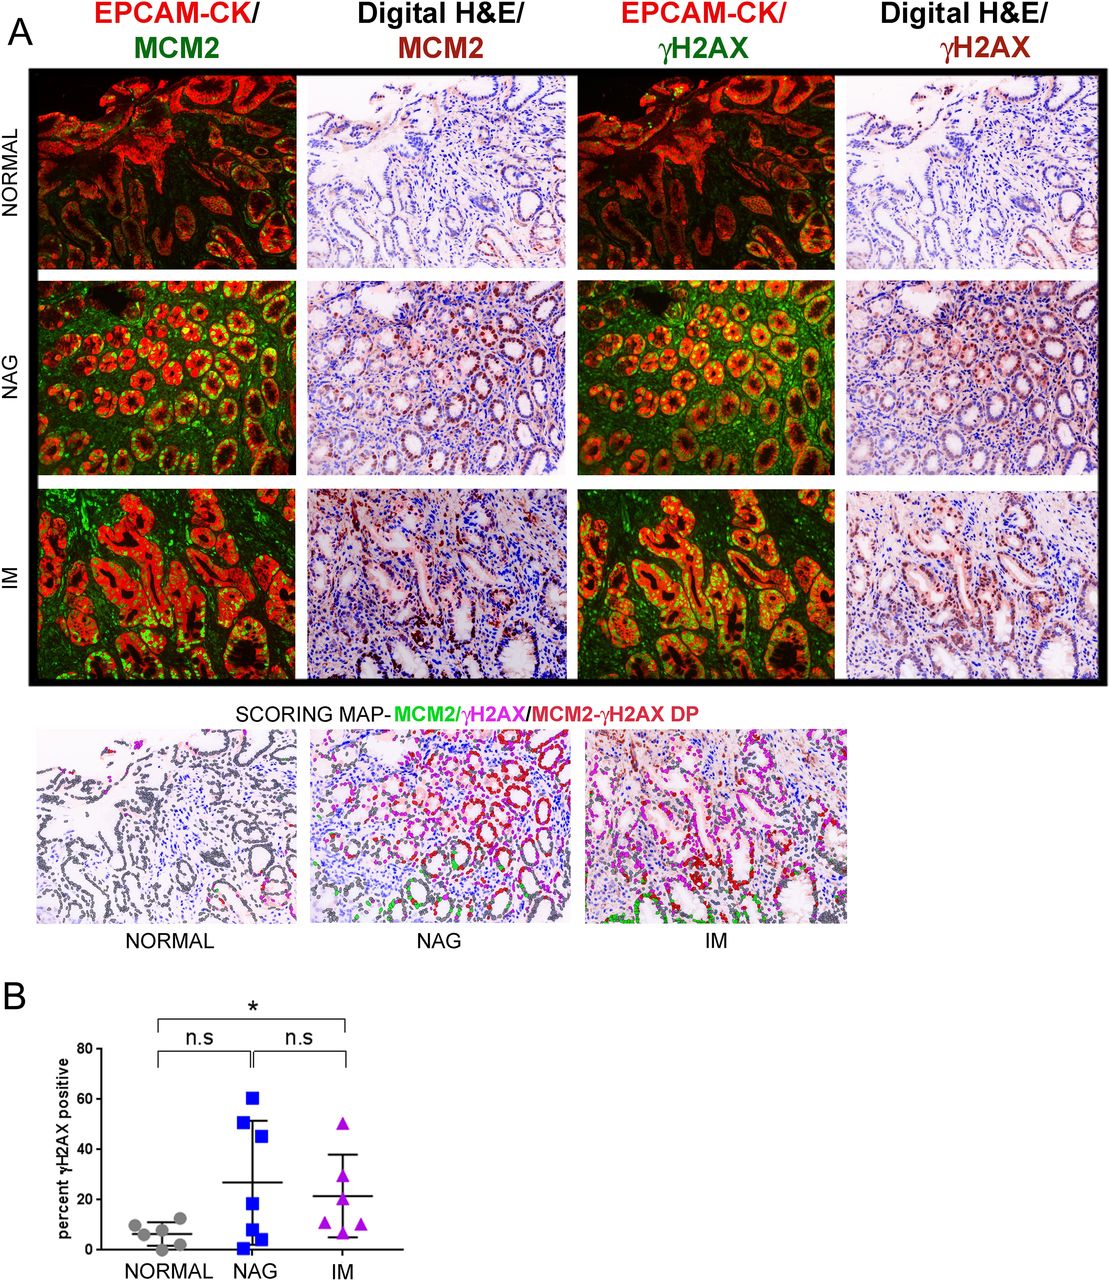
γH2AX positivity increase in IM lesions as compared to normal controls in the GCEP cohort. (A) Samples from the GCEP cohort comprising of six cases of normal gastric tissue, seven cases of NAG and six cases of IM were subjected to multiplex IHC staining with antibodies against EpCAM/pan-Cytokeratin (CK), MCM2 and γH2AX. Immunofluorescence images of γH2AX or MCM2 with EpCAM/pan-Cytokeratin (CK) are shown. Scoring map depicts epithelial cells positive for γH2AX (magenta), MCM2 (green), γH2AX/MCM2 double-positive (DP) (red) and γH2AX/MCM2 double-negative (grey). (B) Plot shows percent γH2AX positivity across the three stages, normal, NAG and IM. Line within the vertical scatter plot shows the mean value. Error bar shows ±SD. Statistical significance was analysed by the Mann-Whitney non-parametric test. * p<0.05, n.s-not significant. GCEP, gastric cancer epidemiology programme; IHC,immunohistochemistry; IM, intestinal metaplasia; NAG, non-atrophic gastritis.
Taken together, the above results revealed elevated DDR signalling at the IM stage with further increase as lesions progress to IGC. Although γH2AX-positive cells also accumulated at the NAG stage, inter-sample heterogeneity was observed rendering the data for this group statistically not significant when compared with other groups.
γH2AX positivity in gastric precancerous lesions strongly correlated to extent of chronic inflammation
Next, we then asked if the extent of chronic inflammatory cell infiltration determines DDR signalling. Chronic inflammation is known to create DNA damage by increasing the levels of ROS within cells.29 ROS can damage DNA through the formation of oxidative adducts that collide with the replication fork or by activating DDR signalling directly through ATM activation.30 31 To investigate the relationship between γH2AX-positivity and chronic inflammation, we chose nine H. pylori negative gastritis tissues in order to avoid the confounding effects of H. pylori infection-dependent direct DNA damage.32 Since H. pylori-negative gastritis is associated with much lower levels of chronic inflammation as compared with H. pylori-positive gastritis,33 it was possible to obtain a few regions on pathological examination that were negative for chronic inflammation (n=3) and compare DDR signalling within these with regions to those that were positive for chronic inflammation (n=6) (online supplementary table 7).
Tissues were subjected to IHC staining with EpCAM/pan-Cytokeratin, MCM2 and γH2AX. The extent of cell proliferation was equivalent between the chronic inflammation negative and positive groups and computed as 27.35%±7.645 and 26.92±6.022, respectively (p=0.7143) (figure 4A and B). In contrast, γH2AX-positivity was substantially higher in the chronic-inflammation positive (35.14%±9.76) as compared with the negative samples (3.074%±0.5863), (p=0.0238) (figure 4A and C). Thus, chronic inflammation seems to be a major activator of DDR signalling in precancerous gastric tissues.
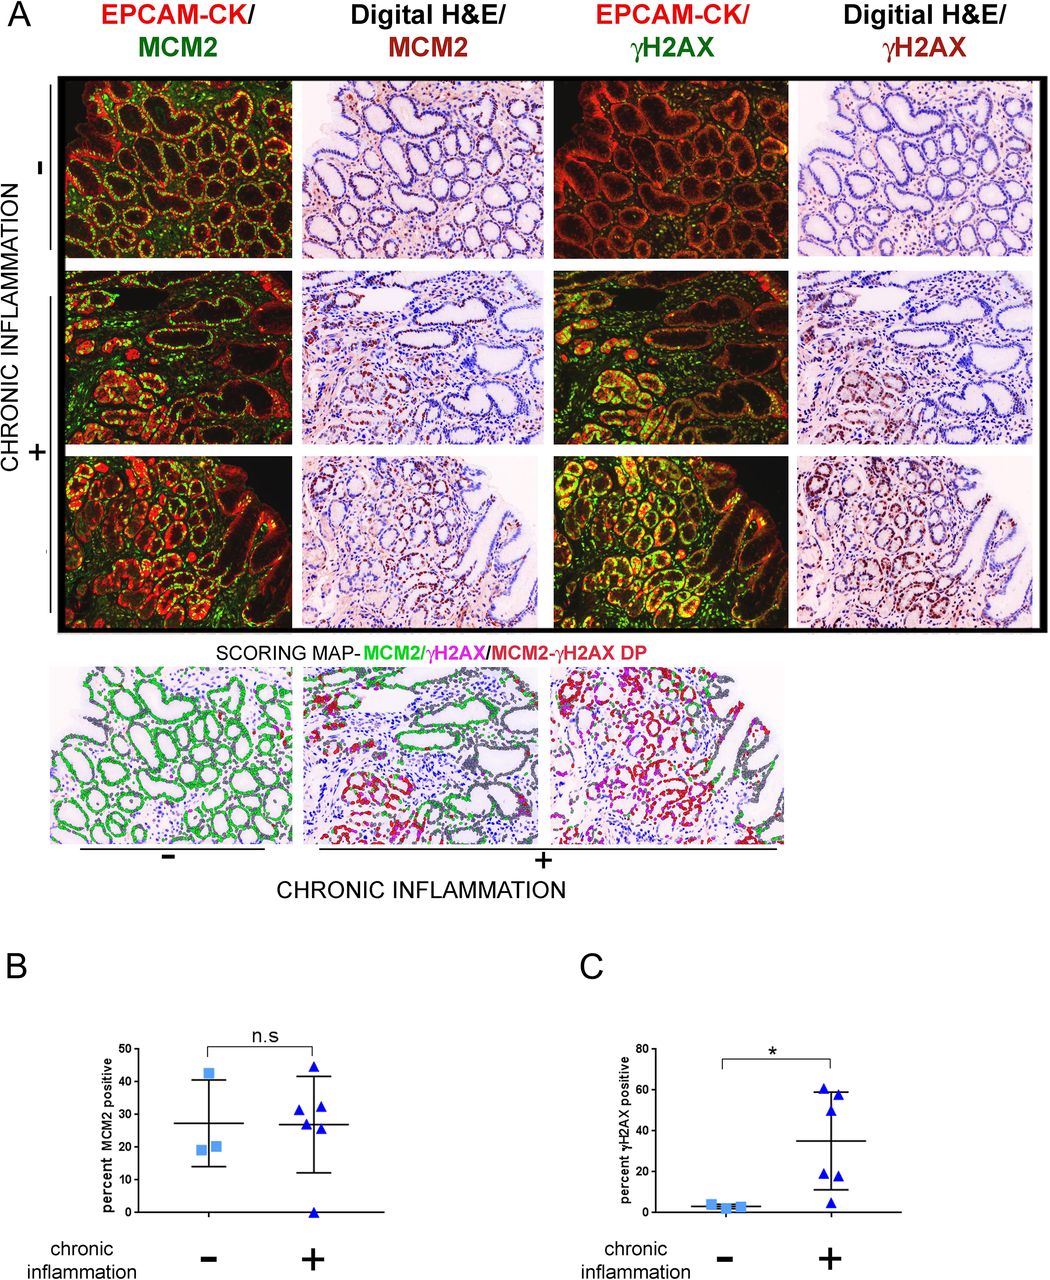
γH2AX positivity correlates with extent of chronic inflammation. (A) Tissues were classified according to extent of chronic inflammatory cell infiltration as positive (n=6) or negative (n=3) and subjected to multiplex immunohistochemistry staining with antibodies against EpCAM/pan-Cytokeratin (CK), MCM2 and γH2AX. Immunofluorescence images of MCM2 or γH2AX with EpCAM/pan-Cytokeratin (CK) are shown. Scoring map depicts epithelial cells positive for γH2AX (magenta), MCM2 (green), γH2AX /MCM2 double-positive (DP) (red) and γH2AX/MCM2 double-negative (grey). (B) Plot shows percent MCM2 positivity in the chronic inflammation positive and negative groups. (C) Plot shows percent γH2AX positivity in the chronic inflammation positive and negative groups. Line within the vertical scatter plot shows the mean value. Error bar shows ±SD. Statistical significance was analysed by the Mann-Whitney non-parametric test. * p<0.05, n.s-not significant.
IM lesions with heightened DNA damage signalling have lower mutational accumulation
Lastly, we interrogated the relationship of DDR signalling to mutational accumulation and CNAs at the IM stage. In a recent study, we characterised 146 IM lesions within the GCEP cohort for mutational counts, CNAs and average telomere length.20 Notably, IM samples had a low mutational burden and CNAs as compared with gastric adenocarcinomas. Mutations frequently found in GC like TP53, ARID1A and FBXW7 were infrequent in IM. Importantly, these observations implied that there exists a window of premalignant cell latency where IM lesions retain their genomic integrity before any further progression.
To interrogate the relationship of DDR signalling to mutational accumulation and CNAs, we extracted 15 samples of IM from the same cohort of 146 IM samples used in our previous published study. Of the 146 IM samples with genomic characterisation, IM samples without any mutational burden and/or CNAs were classified as the genome-stable category (n=8, samples IDs: 1 to 8) (online supplementary table 8, figure 5A and B). GCEP samples harbouring the highest mutational burden and CNAs were classified them as the genome-unstable category (n=7, samples IDs: 9 to 15). Notably, all samples were wild-type for p53.

γH2AX positivity inversely correlates with mutational accumulation in IM samples. (A) IM samples were chosen from the GCEP cohort (n=15) and categorised either as genome-stable or genome-unstable, based on their mutational counts and CNAs. Mutational count of the 15 samples is shown. Genome-stable (n=8), genome-unstable (n=7). (B) CNAs for the 15 samples are shown. Genome-stable (n=8), genome-unstable (n=7). (C) IM tissues were subjected to multiplex IHC staining with antibodies against EpCAM/pan-Cytokeratin (CK), MCM2 and γH2AX. Regions with low epithelial content (<30%) or low IM coverage (<70%) were removed. (upper) Immunofluorescence images of MCM2 or γH2AX with EpCAM/pan-Cytokeratin (CK) are shown. (lower left) Digit H&E to show IM tissue architecture. (lower right) Scoring map depicts epithelial cells positive for γH2AX (magenta), MCM2 (green), γH2AX/MCM2 double-positive (red) and γH2AX/MCM2 double-negative (grey). (D) Graph shows percent γH2AX positivity across the IM samples. Bars in green and red represent the genome-stable and genome-unstable categories, respectively. (E) Plot shows percent γH2AX positivity and MCM2 in genome-stable and genome-unstable categories. (F) Immunofluorescence images of CD44v9 co-staining with EpCAM/pan-Cytokeratin (CK) are shown (left). Scoring map shows epithelial cells positive for CD44v9 (magenta coloured) or negative for CD44v9 (grey) (right). CD44v9 signals were either ‘dim’ or ‘bright’ within IM regions, and both types of signals were included for CD44v9 signal quantification. Areas marked by the yellow rectangle within the fluorescent images have been zoomed by two-fold under the images marked as ‘inset’. (G) Plots show CD44v9 percent positivity (left) and M.F.I (right) in the genome-stable and genome-unstable groups. Line within the vertical scatter plot shows the mean value. Error bar shows ±SD. Statistical significance was analysed by the Mann-Whitney non-parametric test. CNA, copy-number alteration; GCEP, gastric cancer epidemiology programme; IHC, immunohistochemistry; IM, intestinal metaplasia;M.F.I, mean fluorescence intensities.
To test the hypothesis that DDR acts as an anti-cancer barrier, we asked if genome-stable samples had higher levels of DDR signalling as compared to the genome-unstable samples. FFPE-tissues obtained from the same biopsy site subjected previously to genomic characterisation were probed for EpCAM/pan-Cytokeratin, MCM2 and γH2AX. Cell proliferation comparisons through MCM2 percent positivity revealed slightly higher cell proliferation within the genome-stable group, although the difference did not reach statistical significance (genome-stable vs genome-unstable, mean percent positivity - 33.14±9.69 vs 22.15±9.5, respectively, p=0.115) (figure 5C and E). A comparison of telomere length between the genome-stable and genome-unstable groups also revealed no difference (data not shown). A comparison of IM-type (complete vs incomplete) did not reveal any significant differences between the two groups.
In contrast to the above parameters, DDR signalling was significantly higher in the genome-stable group (%γH2AX positivity - 20.45±7.5,) as compared with the genome-unstable group (% γH2AX positivity - 6.3±4.5) in most of the samples (except one case) (p=0.04) (figure 5C,D and E). On manual histological examination of the scoring maps, glands harbouring the intestinal phenotype harboured most of the DDR activation.
Since DDR signalling can either arrest cells in the cell cycle or render them senescent, we asked if γH2AX signals and MCM2 expression are correlated. Nuclear fluorescence values generated by the image analysis software was used to accurately compute the Pearson’s correlation coefficient (r) between the two markers. Intriguingly, MCM2 and γH2AX signals had a varied relationship across difference samples and were positively correlated in two samples (sample ID #6; r=+0.66, p<0.00001 and sample ID #7; r=+0.68, p<0.00001), and had no clear correlation in others. Manual examination further confirmed the heterogeneous relationship between MCM2 and γH2AX signals and imply that despite activated DDR signalling many IM lesions may remain MCM2 positive and do not necessarily exit the cell cycle. The potential implication of these observations to IM progression is discussed below (‘Discussion’).
The intriguing observation of reduced DDR signalling in genome-unstable lesions led us to hypothesise that these IM lesions may have elevated expression of CD44v9, a variant form of CD44. CD44 is complex gene comprising of multiple variant forms of CD44 (CD44v), of which CD44v9, an exon 9 containing variant isoform has been shown to be a functional gastric stem cell marker and predictive of recurrence in early gastric cancers.34–36 CD44v9 has been shown to detoxify chronic inflammation-mediated ROS and accelerate cancer progression by increasing ROS defence.22 We hypothesised that higher expression of CD44v9 in the genome-unstable IM lesions may defend these cells from inflammation-generated ROS and facilitate their escape from tumour-suppressive consequences of DDR signalling.
We tested the hypothesis that genome-unstable samples with attenuated DDR signalling have higher CD44v9 expression. The expression of CD44v9 and its relationship to γH2AX levels was studied in IM lesions. IM samples were subjected to qIHC analyses with the antibodies against EpCAM/pan-Cytokeratin, CD44v9 and γH2AX. Due to insufficient patient material, five samples each from the genome-stable and genome-unstable groups were used. Clear positive regions of membrane-associated CD44v9 staining were seen within the IM regions (figure 5F). Following image quantification, percent positivity of CD44v9 was higher in the genome-unstable group (%CD44v9 in genome-stable vs genome-unstable, 2.57±1.94 and 13.3±12.59, respectively, p=0.0278) (figure 5G, left). Similarly, fluorescence intensity of CD44v9 was also higher in the genome-unstable group (M.F.I CD44v9 in genome-stable vs genome-unstable, 0.015±0.008 and 0.072±0.054, respectively, p=0.0476) (figure 5G, right).
Next, since CD44v9 expression promotes ROS defence, we asked whether CD44v9 staining and γH2AX are negatively correlated and performed correlation analysis between the two markers. Interestingly, γH2AX and CD44v9 intensities were inversely correlated across all the samples and the values reached statistical significance (r values ranged from −0.476 to −0.70, p<0.001, online supplementary table 9).
Then, towards our effort to integrate IHC-based analysis with (epi)genomic characterisation we examined whether DDR genes are mutated or if their promoters undergo hypermethylation in IM samples. A list of genes found mutated in the IM lesions used for this study were compiled (online supplementary appendix 1). An overlap of the mutated genes from genome unstable group with manually curated DNA repair gene-set (online supplementary appendix 2) revealed that ATM, FANCA, HLTF, POLE and REV3L were mutated in two of the samples from the genome-unstable group (ATM in sample ID #10 and FANCA, HLTF, POLE and REV3L in sample ID #11 from genome-unstable group).
Supplemental material
Lastly, we also asked if genome-unstable IM samples displayed epigenetic inactivation of DDR genes through promoter hypermethylation. In our earlier study, DNA methylation levels of IM lesions was compared with normal samples, and DNA methylation levels were categorised as ‘low’, ‘intermediate’ or ‘high’ relative to normal gastric tissue.20 Around 2537 regions were hypermethylated in the methylation-high IMs relative to normal antral tissues. Of note, methylation-high antral IMs showed more mutational accumulation and CNAs leading us to test here whether IM-associated promoter hypermethylation of DDR genes is higher in the genome-unstable group.
The DNA repair genes WRN, MLH1 and RAD52 showed modest but consistent increase in promoter hypermethylation in the genome-unstable IM samples when compared with 39 normal control gastric tissues (delta β values for WRN, MLH1 and RAD52 following comparison between genome unstable vs normal samples was 0.15±0.14, 0.079±0.042 and 0.073±0.044). On the other hand, the aforementioned DNA repair genes has minimal hypermethylation in the genome-stable samples as compared with normal controls (delta β values WRN, MLH1 and RAD52 following comparison between genome stable vs normal samples was 0.009±0.019, 0.005±0.012 and 0.005±0.008). The promoter methylation differences between genome stable and unstable samples was statistically significant (p<0.05) (online supplementary appendix 3). Taken together, reduced DNA damage signalling possibly through the increased expression of CD44v9, along with mutational/epigenetic alterations in DNA repair genes may be factors contributing towards the greater genome instability of some IM lesions. An integrated view of the major alterations observed in genome-unstable IM lesions based on genomic analysis and qIHC findings is compiled in online supplementary table 10.
Discussion
Here, we interrogate the relationship of DDR signalling to mutational accumulation and gain insights on the tumour-suppression mechanisms operational in IM. In earlier studies, activated forms of DDR signalling factors were shown to accumulate and engage tumour suppressive networks in premalignant lesions. It was proposed that the DDR creates an inducible barrier against cancer progression by preventing the evolution of malignant mutants from DNA damage-afflicted premalignant cells.37 38 However, due to the difficulty in procuring sufficient precancerous tissue for concurrent genomic and IHC study, it has been difficult to test if DDR signalling indeed prevents mutational accumulation. By conducting qIHC analysis of DDR signalling and cell proliferation, our studies reveal that IM lesions with higher levels of DDR signalling have a lower mutational accumulation. By linking γH2AX-positivity indicative of DDR activation to the degree of mutational accumulation, this work provides evidence for DDR as an anti-cancer barrier in preneoplastic lesions.
Our studies with the genome-stable IM lesions reinforce previous studies on DDR as anti-cancer barrier in lung, colon, breast, urinary bladder and prostate cancers.39–42 In these lesions, oncogene-induced DNA replication stress and the ensuing double strand breaks were seen as the main stimuli for DDR signalling activation. However, gastric IMs are unique in that they have a very low mutational burden (less than ~5% of samples) and classic oncogene activation is seldom seen.20 Thus, chronic inflammation-elicited ROS, instead of oncogene-induced replication stress, is likely to be the major activator of DDR signalling in precancerous gastric lesions. Supportive of this assumption, γH2AX-positivity and chronic inflammation were strongly correlated, suggesting an important role for chronic inflammation as the driver of gastric DDR signalling (figure 4). Intriguingly, many of the cells positive for γH2AX in IM lesions were also MCM2-positive (figure 5), indicating that despite exhibiting activated DDR signalling, such cells do not exit the cell cycle. Instead, we speculate that cells with an activated DDR signalling are arrested in the cell cycle and may turn into a future reservoir of malignant clones once their DDR signalling is turned off due to mutations or epigenetic alterations in DDR/ cell cycle checkpoint components. Examining the status of cell cycle checkpoint proteins such as pCHK1 or pCHK2 and senescent markers in IM lesions, especially in longitudinal studies can provide greater clarification.
Our studies with the genome-unstable IM lesions suggest a role for CD44v9 in attenuating DDR signalling arising from chronic inflammation. This is because CD44v has been shown to detoxify chronic inflammation-mediated ROS, by interaction with xCT (glutamate-cystine transporter) and increasing intracellular glutathione levels.22 43 Interestingly, CD44v9 expression was found to be an important marker of recurrence in primary early gastric cancer.35 Indeed, CD44v9 expression was found to be higher in the genome-unstable lesions and showed negative correlation with γH2AX staining intensities (online supplementary table 9). Thus, greater ROS adaptability and the concomitant attenuation in tumour-suppressive DDR signalling could be a major risk factor for IM lesions. Additionally, DNA repair gene mutational inactivation (2/5 samples) coupled with epigenetic inactivation of DDR genes (4/5 samples) could potentially collaborate with elevated ROS defence and facilitate IM progression (Model, online supplementary figure S5B and S5C). It is to be noted that despite being statistically significant (p<0.05), the degree of promoter hypermethylation is modest in genome-unstable IM because our study has used very early precancerous lesions and compared their promoter methylation with normal samples. Also, since IM lesions have relatively lower levels of genomic instability, our sample numbers had to be restricted. More studies on larger cohorts are needed to further clarify the role of the above-identified risk factors in IM to GC progression.
Supplemental material
Lastly, the epithelial segmentation protocol and algorithms described here for quantitative IHC are broadly applicable to any epithelial cancer. The value of MCM2 as an early marker of cancer proliferation has been demonstrated for several precancerous lesions tissues such as bronchial dysplasia, premalignant lung lesions, human papillomavirus-infected squamous lesions of the cervix, epithelial dysplasia of the tongue.44–47 MCM2 was identified as a sensitive proliferation marker of gastric cardia cancer in a previous study and possibly with potential prognostic value.48 Our study re-enforces the view that MCM2 and Ki67 staining should be combined to obtain a better measure of cancer cell proliferation.
The origins of intestinal-type gastric cancer reflect the interplay between bacterial infection, chronic inflammation, tumour-associated epigenetic/epigenomic changes and host factors.49 50 Of these, chronic inflammation is a well-known perpetrator of DNA damage and genomic instability. Our observations imply that the competence with which IM cells respond to inflammation-dependent ROS through DDR signalling likely determines the mutational status and future fate of premalignant lesions. An integrated approach that combines multiplex γH2AX/MCM2/CD44v9 profiling with genomic data on larger cohorts will shed more light on the biological determinants of IM to GC evolution.
Acknowledgments
The Singapore Gastric Cancer Consortium (SGCC) is a national translational research group comprising clinicians and scientists working in gastric cancer research from academic medical centres, universities, hospitals and research institutes across Singapore.
References
Supplementary materials
Footnotes
DXEL, PMH and SS contributed equally.
Correction notice This article has been corrected since it published Online First. The fourth author's affiliation details have been amended.
Contributors IHC data acquisition and analysis, DL, PMH, VK and SS; Pathological interpretations and grading of biopsy tissues, SS and MT; Imaging platform and staining optimisation, PMH, VK and ADJ; Mouse data acquisition, JM; Genomic analysis, KKH and PT; Clinical data collection, ZF, JS, CK, ST, KMF and TLA; Data interpretation, VK, SS, ADJ, MT and TI; Drafting and writing manuscript, VK and YI; Revising work, VK, PMH, SS and MT; Conceptualisation and design, YI, YKG and VK; Final approval for publishing work, YKG and YI.
Funding This study was funded by National Research Foundation Singapore under its Translational and Clinical Research (TCR) Flagship Programme, administered by the Singapore Ministry of Health’s National Medical Research Council.
Competing interests None declared.
Patient consent for publication Not required.
Provenance and peer review Not commissioned; externally peer reviewed.
Data availability statement All data relevant to the study are included in the article or uploaded as supplementary information.