Article Text

Abstract
Objective The gut microbiota has been proposed as an interesting therapeutic target for metabolic disorders. Inulin as a prebiotic has been shown to lessen obesity and related diseases. The aim of the current study was to investigate whether preintervention gut microbiota characteristics determine the physiological response to inulin.
Design The stools from four obese donors differing by microbial diversity and composition were sampled before the dietary intervention and inoculated to antibiotic-pretreated mice (hum-ob mice; humanised obese mice). Hum-ob mice were fed with a high-fat diet and treated with inulin. Metabolic and microbiota changes on inulin treatment in hum-ob mice were compared with those obtained in a cohort of obese individuals supplemented with inulin for 3 months.
Results We show that hum-ob mice colonised with the faecal microbiota from different obese individuals differentially respond to inulin supplementation on a high-fat diet. Among several bacterial genera, Barnesiella, Bilophila, Butyricimonas, Victivallis, Clostridium XIVa, Akkermansia, Raoultella and Blautia correlated with the observed metabolic outcomes (decrease in adiposity and hepatic steatosis) in hum-ob mice. In addition, in obese individuals, the preintervention levels of Anaerostipes, Akkermansia and Butyricicoccus drive the decrease of body mass index in response to inulin.
Conclusion These findings support that characterising the gut microbiota prior to nutritional intervention with prebiotics is important to increase the positive outcome in the context of obesity and metabolic disorders.
- gut microbiota
- inulin
- faecal material transfer
- obesity
- metabolism
This is an open access article distributed in accordance with the Creative Commons Attribution Non Commercial (CC BY-NC 4.0) license, which permits others to distribute, remix, adapt, build upon this work non-commercially, and license their derivative works on different terms, provided the original work is properly cited, appropriate credit is given, any changes made indicated, and the use is non-commercial. See: http://creativecommons.org/licenses/by-nc/4.0/.
Statistics from Altmetric.com
Significance of this study
What is already known on this subject?
Disturbances of the gut microbial ecosystem are associated with obesity and related metabolic disorders.
The efficacy of dieting in obese patients is dependent on the initial gut microbiota composition.
Supplementation with fermentable inulin-type dietary fibres leads to the improvement of obesity and related metabolic disorders, but the contribution of specific bacteria in the health improvement by inulin remains unknown.
What are the new findings?
A dietary intervention with inulin in a multicentric cohort of obese patients reveals responders and non-responders in terms of improvement of body mass index and metabolic disorders.
Improvement in metabolic disorders by inulin depends on the presence of specific consortia of bacteria but not on bacterial diversity.
The transplantation of the gut microbiota from obese individuals to high-fat diet-fed mice reveals which changes of the gut microbiota are associated with the improvement of metabolic alterations by inulin and reveals key molecular targets involved in inulin effects on insulin sensitivity, steatosis and adiposity.
How might it impact on clinical practice in the foreseeable future?
The efficacy of nutritional advice in the management of obesity is not optimal. We propose that the measurement of specific consortia of faecal bacteria can preclude the efficacy of prebiotic dietary fibres intervention in obese patients. Moreover, we have elucidated gut microbial bacteria that can be considered as new targets in the improvement of major metabolic alterations linked to obesity.
Introduction
The interaction between nutrients and the gut microbes is involved in the regulation of host metabolism, namely in the context of obesity and related metabolic diseases.1 One interesting strategy to envisage weight control is the elaboration of nutritional interventions/recommendations with dietary fibres considered as prebiotics, defined as ‘substrates that are selectively utilized by host microorganisms conferring a health benefit’.2–7 The administration of inulin as prebiotic reduces adiposity and obesity-associated metabolic disorders in preclinical and human studies. Gut microbiota modulation by inulin-type fructans differ between individuals following the pattern of dietary fibre intake.8 However, in view of the existing data, it is difficult to evaluate which changes in the gut microbiota driven by inulin are involved in the improvement of obesity and metabolism in humans.9–14
Gut microbiota characteristics explain the variable response toward several dietary interventions. Indeed, the initial gut microbiota influences the glycaemic response to real-life meals or bread as well as microbiota changes on resistant starch supplementation.15–17 A recent study highlighted that similar foods induced different effects on microbiome, suggesting that the interactions between diet and microbiome are personalised.18
In this context, we tested the hypothesis that the preintervention gut microbiota composition could influence the metabolic and microbial response to inulin supplementation in obese subjects. Faecal material was taken from obese individuals prior to intervention and transferred into microbiota-depleted mice (hum-ob for humanised obese mice). The metabolic and microbial response of hum-ob high-fat diet (HFD)-fed mice toward inulin supplementation was evaluated and compared with the response to inulin intervention in obese patients. We also analysed the preintervention characteristics of the gut microbiota that drive the improvement of body weight in obese patients treated with inulin (ClinicalTrial.gov identifier: NCT03852069).
Methods
Additional protocols and complete procedures are described in the online supplementary material and methods section.
Supplemental material
Experimental model and subject details
Mice
Specific pathogen-free (SPF) C57BL/6J male mice (Janvier Labs, Le Genest St Isle, France) were housed in a controlled environment (three per cage, 12 hours daylight cycle) with free access to food and water. Young mice (aged 4 weeks) were used to optimise the gut microbiota engraftment.19 Mice were divided into nine groups: one control group (SPF) and eight groups of mice inoculated with the faecal material of obese patients (hum-ob, figure 1A). According to previous procedures,19 20 the intestinal microbiota was first depleted by antibiotic treatment and cleansing with polyethylene glycol (PEG). Stool samples from four obese patients were inoculated three times (one time per day every 2 days). Control mice received water by gavage at the same time. After the first inoculation with stool samples, all groups of mice including the control mice were fed a HFD (45% kcal fat; E15744-347, ssniff, Soest, Germany) for 4 weeks. For each donor, one subgroup was supplemented with 0.2 g/day per mouse of native inulin (Fibruline, Cosucra, Pecq, Belgium) in the drinking water for 4 weeks.
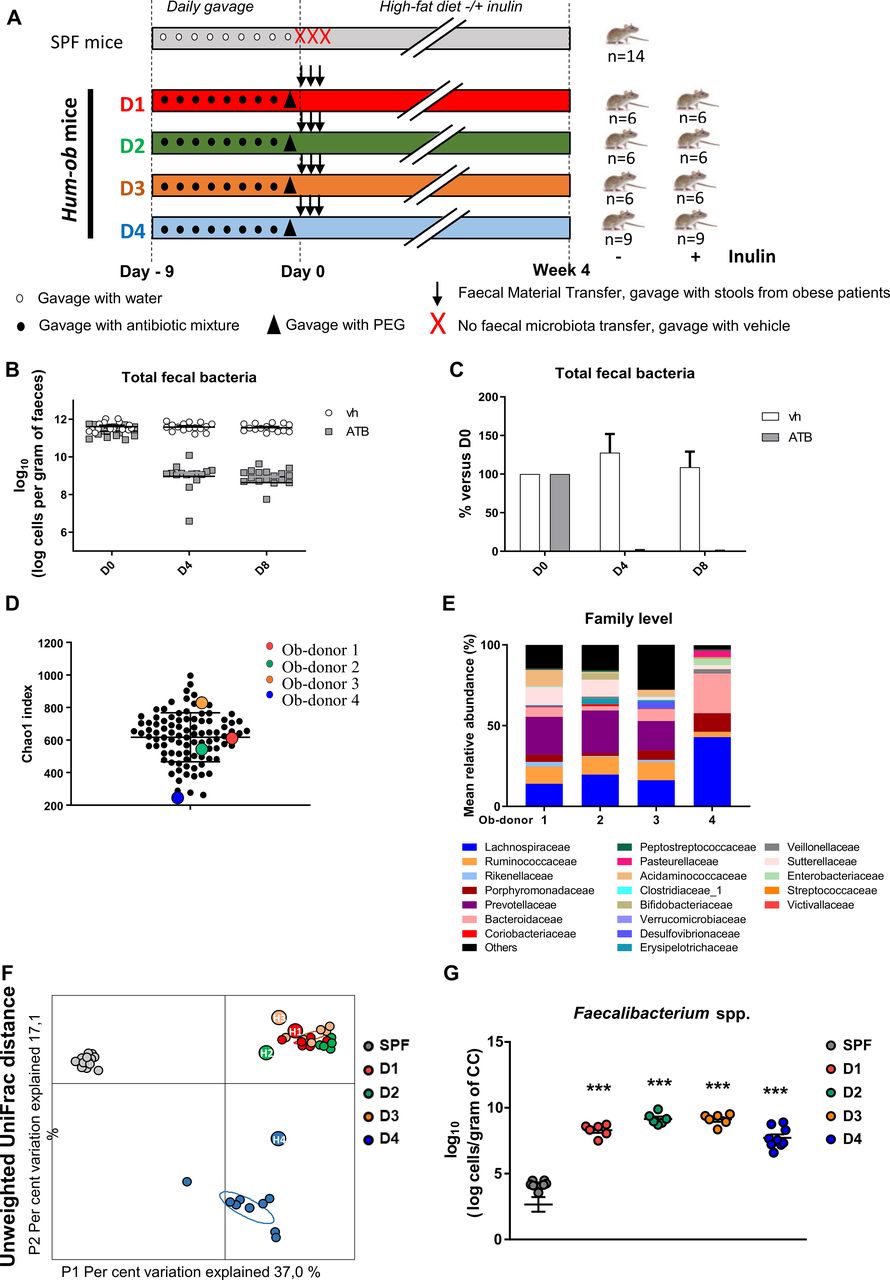
FMT from obese donors into antibiotic-pretreated mice. (A) Experimental design. (B and C) Total faecal bacteria analysed by qPCR in DNA extracted from faeces of antibiotic-treated mice at different time points (D0: before treatment, D4, D8: 4 or 8 days of antibiotic treatment). (B) Represents number of cells per gram of faeces. (C) Represents percentage of total faecal bacteria compared with D0. Results are expressed as mean±SEM. (D) α-diversity is estimated using the chao-1 index in the entire cohort, at baseline. Donors selected for FMT are represented by circles coloured red, green, orange and blue corresponding to donors 1, 2, 3 and 4, respectively. (E) Barplots for relative abundance of family levels accounting for more than 1% for each donor. (F) Principal coordinate analysis of the β-diversity index Unweighted UniFrac, coloured by mouse group. Small circles represent individual mice and larger circles represent human donors (D1, D2, D3, D4 for mice samples and H1, H2, H3, H4 for their respective human donor samples). (G) Quantification of Faecalibacterium spp by qPCR in DNA extracted from CC, 4 weeks after FMT. For five SPF mice, the levels remained undetectable. ***p<0.001 versus SPF mice (one-way ANOVA followed by Tukey post hoc test). ANOVA, analysis of variance; ATB, antibiotic treatment; CC, caecal content; FMT, faecal microbiota transfer; hum-ob mice, humanised obese mice; PEG, polyethylene glycol; qPCR, quantitative PCR; SPF, specific pathogen free; Vh, vehicle.
Metabolic measurements
Plasma insulin and glucose were measured. The subcutaneous adipose tissue (SAT) was stained with H&E for adipocyte size quantification. Liver lipids were stained with oil red O; lipids were extracted from muscle gastrocnemius and liver prior enzymatic quantification. Protein extraction and immunoblotting of protein of interest were performed in liver and gastrocnemius muscle. Total RNA was isolated from different sections of SAT, brown adipose tissue (BAT), liver and skeletal muscle prior reverse transcriptase quantitative PCR (qPCR) analysis.21 The full procedures are detailed in online supplementary information.
Human cohort
The clinical intervention consisted of a 3-month, multicentric, single-blind, placebo-controlled randomised intervention in male and female obese patients (see online supplementary section for inclusion and exclusion criteria). One hundred and six patients were randomised to receive either 16 g/day of native inulin (Cosucra, Belgium) or 16 g/day of maltodextrin (Cargill, Belgium). Fifty-five patients were randomised in the placebo group and 51 patients were assigned to the inulin group. Written informed consent was obtained from all participants before inclusion in the study.
Statistical analysis
Mice experiments: One-way analysis of variance (ANOVA) was performed between the SPF group and humanised untreated mice to evaluate the effect of faecal microbiota transfer (FMT), followed by a Tukey post hoc test. Effect of inulin supplementation was assessed using a Student’s t-test between the two groups of mice colonised with the same donor.
Microbiota analysis: Significantly affected taxa or amplicon sequence variants (ASVs) by inulin were identified using a Welch’s t-test in R, between untreated and treated groups for each donor. The p-value of the Welch’s t-test was adjusted (q-value, significant if q<0.05) to control for the false discovery rate (FDR) for multiple tests according to the Benjamini and Hochberg procedure.22
Correlation between the variation of genera or ASVs significantly regulated by inulin and other metabolic variables was assessed by Spearman’s correlation tests with an FDR correction. A significance level of q<0.05 (adjusted p-value) was adopted for all analyses.
Human cohort: Responders and non-responders to inulin treatment were discriminated according to the body mass index (BMI) median value. Principal component analysis (PCA) and partial least square discriminant analysis (PLS-DA) models were built based on selected variables in R. For PLS-DA, a loading >0.35 was chosen.
Results
Characterisation of mice microbiota after FMT
We first selected four donors from the cohort of obese patients prior inulin intervention, who differed by the gut microbiota composition to perform FMT in antibiotic-PEG pretreated mice (figure 1A). Antibiotic-PEG efficiency was confirmed by the drastic decrease in total bacteria, supporting the elimination of more than 99.8% of faecal bacteria (figure 1B,C). Except for the SPF control group, all mice were recolonised by FMT with stools of obese patients. Donors were obese, drug-naive diabetic or non-diabetic, displaying different faecal bacterial gene richness (Chao1 index, figure 1D) and differences in gut microbiota composition at the family level (figure 1E). The metabolic features also differed between donors, despite a similar BMI, as shown in online supplementary table 1. Four weeks after the FMT, similarities between the caecal microbiota of recipient mice and faecal microbiota composition of their respective donors were assessed. Unweighted UniFrac distance confirmed a different distribution between SPF and hum-ob mice (figure 1F), hum-ob mice gut microbiota being very close to their respective donors. Moreover, the level of Faecalibacterium prausnitzii, bacteria that are present in high proportion in humans but minimally in mice, clearly increased in all hum-ob mice, confirming that human bacteria colonised the recipient mice (figure 1G).
Supplemental material
Differential response to inulin on body weight and adiposity in hum-ob mice
Despite similar food, water and inulin intake between groups (online supplementary figure 1A–C), the response to HFD in terms of body weight gain and adiposity differed between donors. Body weight significantly increased only in mice inoculated with stools from donor 1 (D1) compared with SPF mice and was restored by inulin supplementation only in this group (figure 2A). Regarding adiposity, FMT increased both SAT and epididymal adipose tissue in D1 hum-ob mice (figure 2B,C), whereas inulin supplementation reduced adiposity in D1 and D4 recipients. Visceral adipose tissue weight remained similar in all groups (figure 2D). In SAT, the mean adipocyte area was increased in D1 mice, an effect completely prevented by inulin (figure 2E,F). Gene expression was measured in adipose tissues (online supplementary table 2). Inulin treatment significantly reduced cd11c expression in both D1 and D4 hum-ob mice, suggesting that inulin reduced activated macrophage infiltration in SAT (figure 2G). Inulin also reduced the expression of inflammatory markers (tnfa and ccl2) in SAT of D1 recipients compared with untreated counterparts (figure 2G). In D1 hum-ob mice, inulin decreased mRNA levels of cd36, a fatty acid (FA) receptor. Pparg mRNA, regulating adipocyte differentiation and lipogenesis, decreased with inulin in both D1 and D4 hum-ob mice. In BAT, inulin specifically enhanced the expression of thermogenesis markers (ucp1, prdm16 and ppargc1a) in D1 mice, a phenomenon that can promote FA oxidation (figure 2H; online supplementary table 2).
Supplemental material

Differential response on body weight gain and adiposity with inulin in hum-ob mice. Mice were fed a HFD for 4 weeks following the FMT and supplemented or not with inulin. (A) Body weight gain for SPF and humanised mice supplemented or not with inulin. (B–D) Weight of subcutaneous, epididymal and visceral adipose tissues. (E) Representative H&E-stained pictures of SAT. Scale bar=100 µm. (F) Adipocyte mean area (µm) in SAT. (G and H) Gene expression measured by qPCR in SAT and BAT. The data are presented as fold change of expression level versus the level measured in tissue of SPF mice (mean SPF group=1, see also online supplementary table 2). For each analysis, results are expressed as mean±SEM. FMT effect: *p<0.05, **p<0.01 and ***p<0.001 for untreated hum-ob mice versus SPF mice (one-way ANOVA followed by a Tukey post hoc test). Inulin effect: $p<0.05 and $$p<0.01 for comparison between the group receiving inulin and their counterpart for each donor (Student’s t-test). ANOVA,analysis of variance; BAT, brown adipose tissue; FMT, faecal microbiota transfer;HFD, high-fat diet; hum-ob mice,humanised obese mice; INU, inulin; qPCR, quantitative PCR; SAT, subcutaneous adipose tissue;SPF, specific pathogen free.
Inulin decreases hepatic lipid accumulation in D1 and D4 hum-ob mice
Inulin reduced lipid (triglyceride and cholesterol) accumulation only in D1 and D4 hum-ob (figure 3A-D). D1 mice had increased acetyl CoA carboxylase (ACC) phosphorylation on serine 79 residue, an effect further promoted by inulin and signing AMP-activated protein kinase (AMPK) activation23 (figure 3E). Inulin also decreased nuclear sterol-regulatory element-binding proteins 1 c and 2 (Srebp-1c and Srebp-2) in D1 and D4 mice (figure 3F,G). In D1 mice, inulin reduced cd36 and ppargc1a mRNA, two proteins involved in FA uptake and oxidation (figure 3H), and mRNA levels of markers controlling triglycerides synthesis, such as acaca, scd1, dgat2 and elovl3 (figure 3H; online supplemental table 2). Inulin also decreased scd1 and dgat2 mRNA in D4 mice. These data suggest that inulin reduces hepatic lipid content in D1 and D4 mice by regulating the expression of genes involved in lipogenesis and FA oxidation.

Inulin decreases hepatic lipid accumulation in D1 and D4 hum-ob mice. (A) Histochemical detection of neutral lipids in liver sections, scale bar=100 µm. (B–D) Total lipid, triglyceride and cholesterol contents of the liver. Data are expressed as mean±SEM. (E–G) Immunoblotting and quantification of pACC, and nuclear expression of Srebp-1c or Srebp2. β-actin or Ponceau staining was used as protein loading control. The black dotted line represents the mean obtained for SPF mice. Data are expressed as mean±SEM. (H) Gene expression measured by qPCR in liver. The data are presented as fold change of expression levels in tissue of SPF mice (mean SPF group=1, see also online supplementary table 2). For each analysis, results are expressed as mean±SEM. FMT effect: *p<0.05, **p<0.01 and ***p<0.001 for untreated hum-ob mice versus SPF mice (one-way ANOVA followed by a Tukey post hoc test). Inulin effect: $p<0.05 and $$p<0.01 for comparison between the group receiving inulin and their counterpart for each donor (Student’s t-test). ACC, acetyl coA carboxylase; ANOVA, analysis ofvariance; FA, fatty acid; FMT, faecal microbiota transfer; hum-obmice, humanised obese mice; INU, inulin; pACC, phospho-acetyl coA carboxylase; qPCR, quantitative PCR; SPF, specific pathogen free; Srebp: sterol-regulatory element-binding protein.
Inulin improves muscle insulin sensitivity in D1 hum-ob mice
Biochemical analysis of gastrocnemius skeletal muscle highlighted an increase of intramuscular lipid and triglyceride content only in D1 hum-ob mice compared with SPF control mice, which was abrogated by inulin (figure 4A,B). In line with these findings, inulin robustly increased the phosphorylation of both protein kinase B, Akt (serine 473) and mammalian target of rapamycin, mTOR (serine 2448) in D1 hum-ob mice, indicating insulin signalling stimulation (figure 4C,D). As in the liver, inulin decreased cd36 mRNA expression in the soleus of D1 mice. Pparg mRNA was increased in D1 muscle and decreased by inulin in both D1 and D4 hum-ob mice (figure 4E; online supplemental table 2). Cpt1b mRNA increase in hum-ob mice was counteracted by inulin in D1 mice only (figure 4E). Those data support that inulin improves insulin sensitivity in the muscle of D1 mice by decreasing FA uptake, limiting the availability of ligands of PPARg (peroxisome proliferator-activated receptor gamma). Notwithstanding these effects, we did not observe significant changes in fasting glycaemia and insulinaemia with the treatment (online supplementary figure 1D,E).
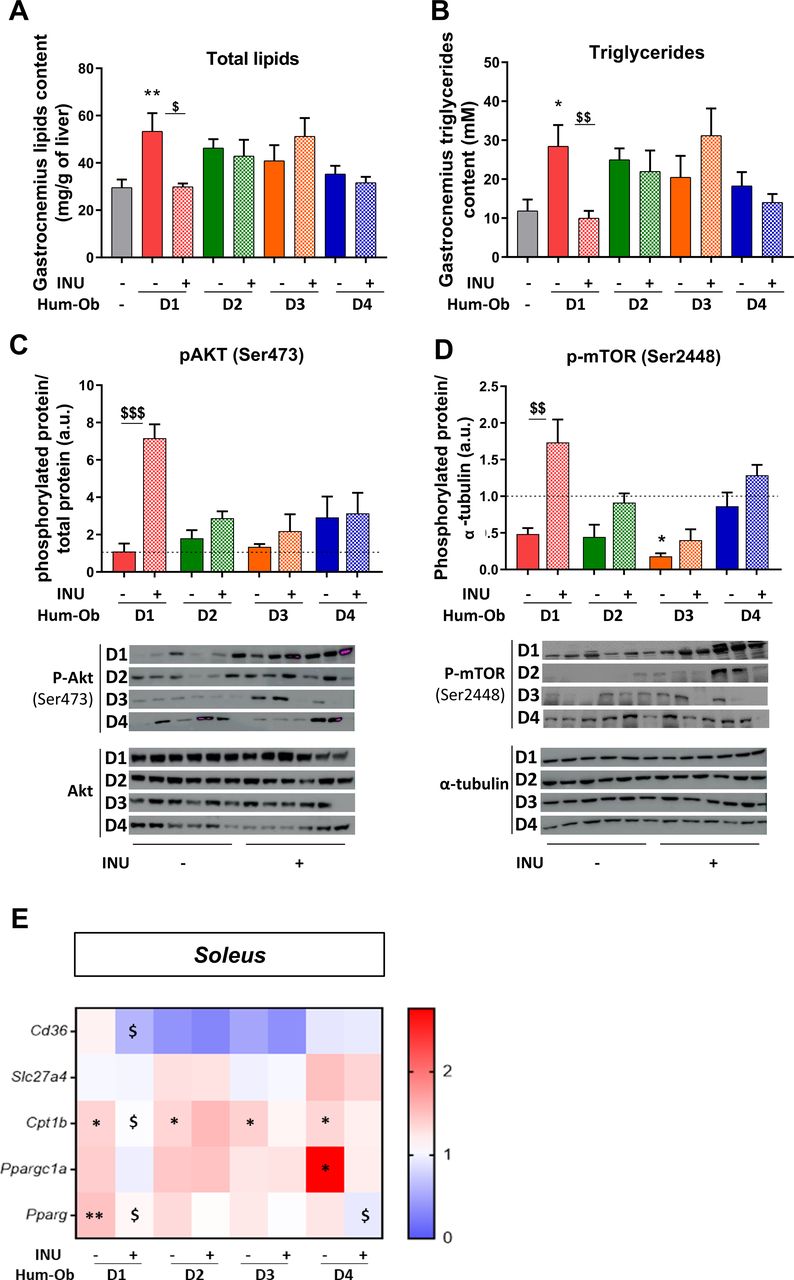
Inulin improves muscle insulin sensitivity in D1 hum-ob mice. (A and B) Total lipid and triglyceride content in the gastrocnemius muscle. (C and D) Immunoblotting and quantification of the ratio of pAkt to total Akt protein and p-mTOR to α-tubulin. The black dotted line represents the mean obtained for SPF mice. Data are expressed as mean±SEM. (E) Gene expression measured by qPCR in soleus muscle. The data are presented as fold change of expression levels in tissue of SPF mice (mean SPF group=1, see also online supplementary table 2). For each analysis, results are expressed as mean±SEM. FMT effect: *p<0.05 and **p<0.01 for untreated hum-ob mice versus SPF mice (one-way ANOVA followed by a Tukey post hoc test). Inulin effect: $p<0.05, $$p<0.01 and $$$p<0.001 for comparison between the group receiving inulin and their counterpart for each donor (Student’s t-test). ANOVA, analysis of variance; FMT, faecal microbiota transfer; hum-ob mice, humanised obese mice; INU,inulin; pAkt, phospho-protein kinase B; p-mTOR, phospho-mammalian target ofrapamycin qPCR, quantitative PCR; SPF, specific pathogen free.
Inulin does not alter overall microbiota composition but induces donor-specific changes in microbiota composition
Caecal content and tissue weights were increased by inulin in all groups, signing a similar inulin fermentation (figure 5A,B). FMT decreased microbial α-diversity (Chao1 and Shannon indices) in all hum-ob mice, compared with control mice (figure 5C,D). Evenness dropped further with inulin in D2 and D4 mice. Unweighted UniFrac distance showed clusters due to interpersonal variation between donors (figure 5F).

Inulin does not alter overall microbiota composition but induces donor-specific changes. (A and B) Caecal content and tissue weight. (C and D) Measure of alpha-diversity indexes: chao-1 and Shannon. (A–D) Data are expressed as mean±SEM. The effect of FMT was calculated using a one-way ANOVA followed by a Tukey post hoc test, *p<0.05 and ***p<0.001 for untreated hum-ob mice versus SPF mice. The effect of inulin was then calculated using a Student’s t-test, $p<0.05 and $$$p<0.001 for comparison between the group receiving inulin and their counterpart for each donor. (E) Barplots of relative abundance of family levels accounting for more than 1%, for each group. (F) Principal coordinate analysis of the β-diversity index Unweighted UniFrac, coloured by mice group. (G) Heatmap of Spearman’s correlations between genera significantly modified by inulin treatment (FDR correction, q value) and the most significant metabolic changes observed with inulin. *q<0.05, **q<0.01 and ***q<0.001 for significant correlations between parameters. ANOVA, analysis of variance; BAT, brown adipose tissue; BW, body weight; FDR, false discovery rate; FMT, faecal microbiota transfer; GAS, gastrocnemius muscle; hum-ob mice, humanised obese mice; INU,inulin; SAT, subcutaneous adipose tissue; SPF, specific pathogen free.
Univariate analyses revealed that inulin induced donor-specific changes at the phylum and family level in hum-ob mice (figure 5E; online supplementary table S3). We also identified a subset of 18 genera differently regulated by inulin (FDR correction, q value <0.05), depending on the donor. Inulin increased Bifidobacterium and decreased Barnesiella, Butyricimonas, Bilophila, Hungatella and Victivallis in D1 mice (online supplemental table S4). In D2 mice, Alistipes, Coprobacter and Parabacteroides decreased with inulin, whereas Bacteroides increased. In D3 mice, inulin decreased Paraprevotella and Murimonas. In D4, inulin increased Parabacteroides, Clostridium XIVa, Raoultella, Blautia and Akkermansia and decreased Bacteroides, Clostridium XVIII and Oscillibacter. In addition, the analysis of ASVs showed that the most abundant ASV and related genera are similarly regulated by inulin (online supplemental table S4). In addition, three ASVs belonging to Ruminococcus 2, Parasutterella and Collinsella, respectively, were decreased by inulin in D2 mice and one ASV from Desulfovibrio genus decreased with inulin in D3 group (online supplemental table S5). Forty other ASVs not be classified at the genus level were modified by inulin, including one ASV from Enterobacteriaceae family that largely decreased on inulin in all hum-ob mice (ASV12; online supplemental table S5). Highly abundant ASV5 from Firmicutes and the unclassified ASV7 also dramatically decreased on inulin treatment in some hum-ob mice.
Some specific bacteria, known to be regulated by inulin, were also quantified by qPCR. FMT clearly decreased the level of Lactobacillus spp and increased Faecalibacterium spp in all hum-ob mice (online supplementary figure 2D,E). Inulin increased total bacteria and Bifidobacterium spp in D1 and D4 groups (online supplementary figure 2A,B). Roseburia spp was increased by inulin in all hum-ob mice (online supplementary figure 2C). Finally, inulin specifically raised the levels of Faecalibacterium spp, Lactobacillus spp and Akkermansia muciniphila in D4 mice (online supplementary figure 2D–F).
Supplemental material
Correlation analysis between the most significant metabolic effects and the 18 genera regulated by inulin was performed. Among several correlations identified (q-value <0.05), some genera positively correlated with hepatic lipid accumulation (Barnesiella, Butyricimonas, Bilophila, Hungatella and Victivallis) and are those significantly decreased by inulin in D1 mice, the group exhibiting the better metabolic response to inulin (figure 5; online supplementary table S4). Moreover, the four genera negatively correlated with hepatic lipid content (Clostridium XIVa, Raoultella,Blautia and Akkermansia) were specifically increased in D4 mice, the second inulin-responder group of mice. Correlation analysis was also performed between biological parameters and all ASVs modulated by inulin and belonging to other genera or unclassified as genus. ASV218 from Desulfovibrio negatively correlated with cd36 level in SAT (online supplementary figure 3). The other unclassified ASVs correlated with metabolic features were not similarly regulated by inulin in D1 and D4 groups. Only the ASV12 was regulated in all hum-ob mice but did not correlate with biological parameters (online supplementary table S5 and online supplementary figure 3).
Supplemental material
Microbiota-related criteria drive the metabolic response to inulin treatment in hum-ob mice and in humans
The model of FMT in mice did not allow to identify the bacteria that could be implicated in body weight changes. For this, we used the whole human cohort of obese patients treated with inulin, to verify whether some bacteria could be linked to the BMI regulation by inulin.
Donors used for FMT have been enrolled in a large clinical intervention on the impact of 3-month inulin supplementation (16 g/day) in obese patients, combined with dietary advice to consume vegetables enriched in inulin-type fructans. The impact of inulin treatment in donors was consistent with the response in hum-ob mice: donor 1 had better clinical measures after inulin, including decreased BMI and fat mass, improved hepatic steatosis and decreased energy intake (table 1). For donors 2 and 3, despite a loss of 3–4 kg, no metabolic or anthropometric changes were observed. Surprisingly, for donor 4, the effect of inulin differed from the hum-ob mice since inulin did not improve fat mass or hepatic lipid accumulation (table 1). Actually, donor 4 largely increased her energy intake as lipids and carbohydrates, and reduced her physical activity during the intervention. This probably explains the different impact of inulin between mice and donor.
General characteristics and metabolic variables of obese donors during intervention
At the end of the intervention, we subdivided participants in the inulin arm (n=51), according to the median of the BMI change into non-responders (unchanged BMI) and responders (decreased BMI; figure 6A). Chao1 index, reflecting the richness of the gut microbiota, was similar between non-responder and responder groups (figure 6B). Surprisingly, PCA using the variation (difference between baseline and 3-month intervention) of all bacterial genera during the clinical intervention did not allow to separate non-responders and responders (figure 6C). Interestingly, the PCA taking into account only the variation of genera with inulin highlighted in hum-ob mice (ie, 18 genera identified by taxonomic analysis + 4 with ASV analysis) tended to separate non-responder and responder groups (Monte Carlo test, p=0.06, figure 6D). The PLS-DA, based on the variation of the same subset of genera (identified in mice) during the human protocol, indicated that the main variations responsible for the different BMI response seem to be the increase in Bifidobacterium spp associated with a decrease in Collinsella, Barnesiella, Akkermansia and Bilophila in responders (figure 6E). Univariate analysis confirmed a significant decrease in Collinsella and Akkermansia in responders compared with non-responders (figure 6F). To assess whether some genera could predict the response to inulin, we performed a PLS-DA analysis based on all genera present before the intervention (figure 6G). A clear separation was observed between non-responders and responders; among the main variables (loading >0.35) responsible for this specific clustering, we found some genera outlined above, such as Collinsella, Bifidobacterium, Akkermansia, Bacteroides and other new genera such as Butyricicoccus that seems highly present in responders (figure 6G). Univariate analysis only show a significant higher basal presence of Akkermansia and Butyricicoccus and a lower level of Anaerostipes in responders, compared with non-responders. These data support that a subset of bacteria involved in the specific response to inulin probably plays an important role in the interindividual response in terms of BMI observed in the human cohort.

Intervention study with inulin in a multicentric human cohort reveals inulin responders (R) and non-responders (NR) in term of body mass index (BMI) improvement and changes in the gut microbiota. (A) Variation of BMI, after 3 months of intervention, in the inulin arm: NR (n=26) and R (n=25) patients were separated using the median change in BMI. ***p<0.001 versus placebo and $$$p<0.001 versus NR. (B) Chao1 index (alpha-diversity) in NR (n=23) and R (n=24). (C–D) Principal component analysis of the gut microbiota composition based on all the genera (C) or selected genera (D) in NR and R patients. Statistical analysis was assessed by a Monte Carlo rank test. (E) Partial least square discriminant analysis (PLS-DA) of the variation of selected genera (selection from the humanised obese mice (hum-ob) mice model) during the intervention with inulin in NR and R patients. (F) Variation of the most discriminant genera after 3 months of intervention. Data are expressed as mean±SEM and analysed with a Mann-Whitney test in R compared with NR subjects. (G) PLS-DA of all genera, before the intervention, in NR and R patients. The main variables (cut-off: 0.1% of relative abundance, loadings >0.35) explaining the clustering are represented. (H) Relative abundance of bacterial genera, at baseline, selected (by the previous PLS-DA and the in vivo model of hum-ob mice) in NR and R patients. Data are expressed as mean±SEM and analysed with a Mann-Whitney test in R compared with NR subjects.
Discussion
Inulin-type fructans have been proposed as an interesting dietary fibre with prebiotics properties, since many animal data and some intervention studies with inulin support their potential interest in the management of body weight and obesity-related diseases. The link with the gut microbiota changes occurring on inulin intervention remains elusive.24 A previous study demonstrated that short-chain fructans decreased the body weight gain, fat mass accumulation and increased caecal content in axenic mice inoculated with stools from one healthy lean adult.25 The authors propose that the results may depend on the human gut microbiota used for the inoculation and may not be generalisable. We show in our study that the inulin response is highly variable across ‘humanised’ mice colonised with the stools from different obese patients, providing evidence that the gut microbiota composition prior to intervention influences the health outcome. For this, we inoculated mice with samples from different obese donors, and body weight gain of hum-ob mice on HFD was differently affected by inulin, even when mice exhibit the same dietary behaviour. Inulin differently regulated metabolic changes in adipose tissues, liver and skeletal muscle. Finally, the observed interindividual variability was accompanied by specific gut microbiota changes with inulin in hum-ob mice.
In two groups of mice (D2 and D3), inulin had no effect, whereas the two other groups (D1 and D4) responded with a positive impact of inulin, the metabolic improvement being more prominent in D1. The two groups of responders in mice received the gut microbiota from one diabetic donor (D1) and one pre-diabetic donor (D4), but mice receiving stools from another diabetic donor (D2) did not respond to inulin supplementation, suggesting that the diabetic status is not the main driver of the metabolic response to inulin. However, this hypothesis must be challenged in future intervention studies with a large number of patients with diabetes versus without diabetes. In D1 mice, FMT exacerbated the impact of HFD, and inulin counteracted the majority of these effects such as body weight and fat gain and hepatic and muscular lipid accumulation. Recent study demonstrated that the response of gut microbiota to resistant starch-containing dietary supplement differed depending on the initial gut microbiota from healthy donors used to inoculate mice.26 In our study, we could recapitulate the importance of the selective changes in microbiota to explain the metabolic response to inulin (online supplementary figure 4). In D1 group, inulin preferentially decreased bacteria positively correlated with detrimental metabolic features. Among them, inulin decreased Bilophila and Barnesiella and increased Bifidobacterium genera. In conventional mice fed a HFD, prebiotic treatment led to an increase in Bifidobacterium spp associated with a decrease in Bilophila.27 Vandeputte et al also demonstrated that inulin selectively increases Bifidobacterium and decreased Bilophila in mildly constipated individuals, an effect linked to improved constipation-related quality of life.28 Our data support that, in humanised mice, the changes of those bacteria is important to get interesting health effects, even beyond the context of obesity. Interestingly, the strong effect of inulin in D1 mice was also observed for the donor 1 during the intervention. Even if it is clear that the increase of physical activity by donor 1 could improve metabolic parameters during the intervention, the hum-ob mice model supports that the gut microbiota from this donor is favourable for metabolic response to inulin.
Supplemental material
In D4 mice, even if FMT did not aggravate the impact of HFD, inulin improved fat mass and hepatic steatosis. In this group, inulin preferentially upregulated bacteria known to be associated with beneficial effects on host metabolism,29 30 such as A. muciniphila, which negatively correlated with fatty liver in our study. In agreement, it has been shown that Akkermansia administration prevents the development of obesity and reverses metabolic disorders in HFD-fed mice.29 30 Interestingly, the responder group from the whole cohort was characterised by a higher abundance of Akkermansia at baseline, but its abundance decreased on intervention. Dao et al also showed that obese subjects with a higher abundance of Akkermansia at baseline had a greater improvement in metabolic alterations during a low-caloric diet intervention, but Akkermansia was also decreased in this group during the intervention.31 This suggests that the higher abundance of Akkermansia prior to intervention could determine the successful rate of dietary intervention, but that an increase in Akkermansia on inulin treatment is not the driver for the metabolic improvement.
In D4 mice, inulin also increased the levels of Faecalibacterium spp, Lactobacillus spp and Bifidobacterium spp. This was consistent with previous works showing that F. prausnitzii is lower in obese patients and in patients with diabetes and increases after weight loss.32 33 Moreover, inulin-type fructans intervention versus placebo increased Bifidobacterium spp and Faecalibacterium in a cohort of obese women.14 Finally, improvement of obesity and metabolic disorders was also observed during probiotic intervention studies with Lactobacillus species.34 35
The biological effects of inulin in D1 and D4 hum-ob mice shared some similarities but not all. Inulin reduced hepatic lipid content by decreasing nuclear expression of srebp1 and srebp2 proteins and mRNA expression of lipogenic genes in both groups. Previous data showed that genes involved in lipogenesis, FA elongation and desaturation were decreased in mice colonised with a simplified human gut microbiota, and treated with inulin.36 In D1 mice, we found that these changes could be mediated by a regulation in hepatic ACC phosphorylation by inulin, controlling both FA synthesis and oxidation.23 However, in D4 mice, the mechanism appeared to be ACC-independent. This suggests that an inulin intervention may drive improvement of steatosis and hepatic diseases, but depending on the initial microbiome, the molecular mechanism behind it could be different. Decreased muscle triglyceride content and improved insulin sensitivity was only observed in D1 hum-ob mice, confirming a different response pattern between the two responder groups. Once again, linking the gut microbial changes to inulin response shows a positive correlation between Butyricimonas, Victivallis and Bilophila with myosteatosis, three genera decreased by inulin in D1 mice.
Among several hypotheses explaining the variable response to nutrients, and more specifically to inulin, different basal gut microbial diversity or basal Bifidobacteria level have been proposed as criteria. In our study, the richness chao1 index was similar at baseline and inulin did not modify it neither in hum-ob mice, nor in the human cohort. Previous studies suggested an inverse correlation between the initial faecal bifidobacterial numbers and the magnitude of increase of bifidobacteria with inulin or oligofructose-enriched inulin in healthy humans,8 37 38 suggesting that inulin might induce a greater metabolic response in individuals with lower bifidobacteria at baseline. In our human cohort, the baseline level of Bifidobacterium spp was not lower in responders. Actually, only three genera were significantly different at baseline between responders and non-responders (Anaerostipes, Akkermansia and Butyricicoccus), even if other bacteria at baseline seem to drive the separation between both groups (PLS-DA analysis). We believe that the magnitude of response could be influenced by a subset of bacteria (rather than one specific bacterium) simultaneously affected by prebiotics. Consistent with this, Zhao et al demonstrated that a set of short-chain fatty acid (SCFA)-producing bacteria was promoted by dietary fibres and was key to improve host glycaemic control.39 They identified 15 strains of SCFA producers, belonging to Faecalibacterium, Lactobacillus, Bifidobacterium or Ruminococcus genera, which were suggested to exert beneficial effects on the one hand and keep detrimental bacteria away on the other. Accordingly, we found increased F. prausnitzii, Lactobacillus spp and Bifidobacterium genus in one group of responder mice.
The current data highlight that specificities of the gut microbiota drive the metabolic and microbial response to inulin. Choosing a specific nutritional strategy to manage non-alcoholic fatty liver disease, glucose homeostasis or adiposity would require to pay more attention not only on the initial gut microbiota but also on the potency of the gut microbiota to be modified adequately by specific prebiotics. In our study, the patient D4 met all the ‘microbial criteria’ to respond to inulin intervention but it was unsuccessful for this patient, because he did not follow dietary and behavioural advices. The consequence was an increase in body weight and fat mass, which could counteract the potential beneficial effect of inulin on metabolic disorders.
This means that a successful dietary intervention, namely with prebiotics, has to be considered as one of the tools to improve metabolic health but patient’s motivation remains crucial. One limitation of our study could be that all human donors were women, whereas the transplantation of the faecal material was performed in male mice only. This was motivated by the fact that all previous experiments testing inulin in HFD mice had been performed in male mice that are more prone to develop metabolic disorders than the female ones.40 41 In addition, no difference was observed in terms of improvement of BMI on inulin treatment following the gender in the human cohort (data not shown).
In conclusion, a personalised approach should be developed for prebiotic interventions to target obese patients prone to have a favourable response and to avoid discouraging negative outcomes. The identification of bacterial consortia within this complex ecosystem that drive the metabolic response towards prebiotics is of particular interest to implement adequate nutritional advices for personalised management of metabolic disorders in obesity.
Acknowledgments
We thank Remi Selleslagh, Véronique Allaeys, Isabelle Blave and Bouazza Es Saadi for their precious implication in the study. We thank the UCLouvain’s platform “Support en méthodologie et calcul statistique” and more specifically Céline Bugli and Lieven Desmet for their helpful advice concerning statistical analyses. We also thank Coralie Frenay, Marie Barea and Marjorie Fadeur, the dieticians involved in the clinical trial.
References
Supplementary materials
Supplementary Data
This web only file has been produced by the BMJ Publishing Group from an electronic file supplied by the author(s) and has not been edited for content.
Footnotes
Twitter @JulieRdz1213, @Titicaccae, @MicrObesity, @Laure_Bindels
Contributors JR and NMD conceived and designed the experiments, interpreted the data and wrote the manuscript. JR performed the experiments and data analysis. AMN and LBB participated to design and to experiments. TLR designed the FMT protocol. JR, SH, BDP, MAG, MC, NP, NL and J-PT participated to the acquisition of the clinical data. AMN, TLR, SAP, QL and LBB participated to the analysis and interpretation of data. AMN, PDC, MC, NP, NL, J-PT and LBB provided intellectual input on the paper and reviewed the paper. NMD supervised the overall project.
Funding This research is supported by the competitive cluster Wagralim from Wallonia (FOOD4GUT 518 project, convention 1318148). NMD is a recipient of grants from Wallonia (FOOD4GUT project; 519 FiberTAG project from European Joint Programming Initiative 'A Healthy Diet for a Healthy 520 Life') and from Belgium National Scientific Research Fund (FRS-FNRS; convention PDR 521 T.0068.19). PDC is a senior research associate at FRS-FNRS (Fonds de la Recherche 522 Scientifique), Belgium, and supported by the Funds Baillet Latour (Grant for Medical Research 523 2015). TLR is a postdoc fellow funded by FRFS-WELBIO (WELBIO-CR-2017C-02).
Competing interests None declared.
Patient consent for publication Not required.
Ethics approval Trial registered at ClinicalTrial.gov as NCT03852069 was approved by the 'Comité d’éthique Hospitalo-facultaire de Saint-Luc'.
Provenance and peer review Not commissioned; externally peer reviewed.
Data availability statement For the gut microbiota analysis, raw sequences can be accessed in Sequence Read Archive database (SRA accession numbers PRJNA594535, PRJNA595949).