Article Text

Abstract
Objective Neutralising antibodies are key effectors of infection-induced and vaccine-induced immunity. Quantification of antibodies’ breadth and potency is critical for understanding the mechanisms of protection and for prioritisation of vaccines. Here, we used a unique collection of human specimens and HCV strains to develop HCV reference viruses for quantification of neutralising antibodies, and to investigate viral functional diversity.
Design We profiled neutralisation potency of polyclonal immunoglobulins from 104 patients infected with HCV genotype (GT) 1–6 across 13 HCV strains representing five viral GTs. Using metric multidimensional scaling, we plotted HCV neutralisation onto neutralisation maps. We employed K-means clustering to guide virus clustering and selecting representative strains.
Results Viruses differed greatly in neutralisation sensitivity, with J6 (GT2a) being most resistant and SA13 (GT5a) being most sensitive. They mapped to six distinct neutralisation clusters, in part composed of viruses from different GTs. There was no correlation between viral neutralisation and genetic distance, indicating functional neutralisation clustering differs from sequence-based clustering. Calibrating reference viruses representing these clusters against purified antibodies from 496 patients infected by GT1 to GT6 viruses readily identified individuals with extraordinary potent and broadly neutralising antibodies. It revealed comparable antibody cross-neutralisation and diversity between specimens from diverse viral GTs, confirming well-balanced reporting of HCV cross-neutralisation across highly diverse human samples.
Conclusion Representative isolates from six neutralisation clusters broadly reconstruct the functional HCV neutralisation space. They enable high resolution profiling of HCV neutralisation and they may reflect viral functional and antigenic properties important to consider in HCV vaccine design.
- hepatitis C
- HCV
- liver
- genotype
- immunology in hepatology
Data availability statement
Data sharing not applicable as no datasets generated and/or analysed for this study. Data are available upon reasonable request. All data relevant to the study are included in the article or uploaded as supplementary information. Sequences of the reporter viruses were submitted to the NCBI GenBank database.
This is an open access article distributed in accordance with the Creative Commons Attribution Non Commercial (CC BY-NC 4.0) license, which permits others to distribute, remix, adapt, build upon this work non-commercially, and license their derivative works on different terms, provided the original work is properly cited, appropriate credit is given, any changes made indicated, and the use is non-commercial. See: http://creativecommons.org/licenses/by-nc/4.0/.
Statistics from Altmetric.com
Significance of this study
What is already known about this subject?
Humoral and cellular responses are critical to protect from chronic HCV infection.
HCV is genetically highly diverse.
Different assays are used to measure virus neutralisation in vitro.
What are the new findings?
Six reference viruses representing six functionally distinct virus neutralisation clusters reconstruct the functional HCV neutralisation space.
The virus sequence does not predict mapping to these functional clusters.
Functional diversity differs from genetic diversity.
How might it impact on clinical practice in the foreseeable future?
These reference viruses facilitate the characterisation of the role of antibodies in HCV protection and prioritisation of vaccine candidates.
Vaccine candidates addressing viral functional diversity rather than genetic diversity may induce superior protective immunity.
Disclaimer: this video summarises a scientific article published by BMJ Publishing Group Limited (BMJ). The content of this video has not been peer-reviewed and does not constitute medical advice. Any opinions expressed are solely those of the contributors. Viewers should be aware that professionals in the field may have different opinions. BMJ does not endorse any opinions expressed or recommendations discussed. Viewers should not use the content of the video as the basis for any medical treatment. BMJ disclaims all liability and responsibility arising from any reliance placed on the content.
Introduction
HCV has chronically infected an estimated 71 million people worldwide and is therefore a global health problem.1 Of those who are infected, 50%–80% progress to chronicity and are at risk to develop liver cirrhosis and hepatocellular carcinoma.
The advent of highly effective direct-acting antivirals (DAAs) has revolutionised patient care.2 However, providing access to DAAs for all patients worldwide remains a major public health challenge. In addition, in rare cases, therapy fails due to resistance-associated variants3 and HCV reinfection is possible after treatment-induced cure.4 5 Thus, a prophylactic vaccine is important for control of HCV disease burden. One approach of vaccine development capitalises on the induction of broadly neutralising antibodies (bNAbs) targeting envelope glycoproteins E1 and E2. Multiple studies support an important role of neutralising antibodies for spontaneous HCV clearance.6–9 Moreover, passive immune-prophylaxis studies in animals confirm the importance of antibodies in protecting from HCV infection.10–12
HCV is highly variable and viral isolates are classified into eight genotypes (GTs) and multiple subtypes.13 The envelope proteins are targets of neutralising antibodies and represent the most variable proteins of the virus. For successful vaccine design, it is crucial to elicit cross-protective antibodies against diverse HCV variants, and recent vaccination approaches take this requirement into account. However, use of different experimental systems for quantification of antibody responses complicates comparison of vaccine efficacy. Typically, either infection assays based on retroviral HCV pseudoparticles (HCVpp) or cell culture-derived HCV (HCVcc) particles are used to quantify antibody efficacy. In recent years, several panels of HCVpp or HCVcc were developed.14 In part, these panels include a large number of different E1-E2 proteins.15 However, in some cases, these panels only encompass GT1-derived glycoproteins.16 17 It is unclear if these GT-selective panels adequately report the entire functional diversity of globally sampled HCV, including GT 1 to 7 strains. In other cases, viruses with E1-E2 genes carrying cell culture-adaptive changes, which may influence virus antibody neutralisation, are included.18 Moreover, there are well-documented functional differences between cell entry of HCVpp and HCVcc, including dependence on entry factors19 and susceptibility to membrane fusion inhibitors.20 21 Although there are studies attesting a good congruence between HCVpp and HCVcc neutralisation,14 HCVpp tend to be more neutralisation sensitive than HCVcc,17 22 and the above-mentioned differences may preclude assessment of important determinants and features of the virus–antibody interplay. Therefore, we aimed to develop a reference panel of viruses for rigorous and balanced quantification of breadth and potency of HCV-specific antibodies across the diversity of globally sampled HCV strains.
Materials and methods
Human samples
We obtained patient sera from the HCV Research UK Biobank and from patients treated at the University Clinics of Bonn, Cologne and the Hannover Medical School.
Patients or the public WERE NOT involved in the design, or conduct, or reporting or dissemination plans of our research.
Cross-neutralisation index
Both breadth and potency are important characteristics of neutralising antibodies. Therefore, here we introduced a novel score, the ‘cross-neutralisation index’ (CNI) that takes into account both potency and breadth of neutralising antibodies. We defined breadth of neutralisation as the % of viral strains neutralised by more than 50% at a fixed concentration of antibody preparation (ie, 500 µg/mL of polyclonal serum-derived antibodies). Potency of antibodies was reported as average HCV neutralisation (in %) across all viral strains used in the assay. Applying the following formula for calculation of the CNI prioritises polyclonal antibodies with strong neutralisation across the majority of strains over antibodies that exhibit a strong neutralisation against a fraction of strains only: CNI = (Average neutralisation*N)+1)/100. Here, N is the % of viruses neutralised by more than 50%.
Multidimensional scaling
We had 104×13 neutralisation pairs, with individual values representing the residual infectivity of a virus at a fixed concentration (500 µg/mL) of the patient-derived antibodies for specific virus–patient–antibody pairs. From these data, we created a neutralisation map reflecting the efficacy of the patient-derived polyclonal antibodies in terms of ease of neutralisation of the 13 viruses using metric multidimensional scaling (MDS).23 MDS has been used previously to create antigenic maps for influenza viruses.24 The residual infectivities are similar to proximity measures (similarity/dissimilarity) and not necessarily Euclidean distances, but it can be assumed that these proximities are like measured distances.25 MDS attempts to find a spatial configuration of the viruses and sera in an N-dimensional (typically two or three dimensional) space such that the Cartesian distances between the points best match these input proximities. The differences in the distances on the map (d) and the actual proximities (D) is known as stress. This stress is the loss function and the aim is to minimise this stress (stress majorisation). In metric MDS, the cost function is the sum total of stresses for all pairs, that is, residual sum of squares of all pairs:

where  corresponds to a weighting term, which oftentimes is set to
  for virus–serum pairs i and j, respectively. Stress majorisation can be done stepwise by gradient descent26 or iterative majorisation.27 We used iterative majorisation implemented in the SMACOF (Scaling by MAjorizing a COmplicated Function) package of R.27
To find the best low-dimensional representation of the data, we tried different numbers of lower dimensions (2, 3, 4, 12), normalisation (scaling across sera, across viruses, no scaling) and weighting schemes (1,  ) on the neutralisation matrix. As we were more interested in finding the elite neutralisers, we chose
  as the weight in the stress function, which ensures that good neutralisation pairs, that is, those with small values of
  , are given importance while optimising the distances
  with each iteration. To check the robustness of the MDS maps, leave-one-out (LOO) tests were carried out and the method that gave the least LOO error was chosen for selecting the final MDS map. In LOO tests, we leave one neutralisation pair out in each iteration and draw the full MDS map with the remaining (13×104–1) values. The LOO error is then determined as the ratio of the distance between the left-out neutralisation test virus –polyclonal immunoglobulins (pIg) pair on the map and the original distance (in the neutralisation matrix for the same pair. We repeated this until each neutralisation pair has been left out exactly once and then report the final LOO error averaged over all the 13×104 iterations as:
 .
.
For the final map, no normalisation with  as weight and N=2 was chosen as the method (table 1), as this had the least LOO error. All the codes and scripts for the method are available at https://github.com/hzi-bifo/hcv-mds.
Stress values and LOO errors obtained for different weighting and normalisation methods of the neutralisation matrix
Clustering
Following the construction of the two-dimensional (2-D) neutralisation map, similar neutralisation serotypes for the 13 viruses were identified by k-means clustering of the 2-D coordinates of the map.28 The viruses that cluster together have similar responses to the analysed patient-derived polyclonal immunoglobulins (pIg). We tried different values of k=4, 5, 6 and obtained k clusters for each value. The virus closest to the centroid of the cluster was chosen as the representative virus for that cluster. To select the final value of k, we plotted reduced MDS maps, that is, MDS maps with considering only neutralisations of 4, 5, 6 respective representative viruses for k=4, 5, 6 and chose the value for which we obtained the most robust map (least LOO error). We chose k=6 as the final value of k and obtained six clusters of viruses on the MDS map. Key data characterising the clustering are summarised in table 1.
Results
Characterisation of HCVcc screening panel using patient IgGs
To assess breadth and potency of HCV-specific neutralising antibodies, we generated 13 Renilla luciferase reporter viruses representing five HCV GTs and nine distinct subtypes (figure 1A,B and(online supplemental table S1) . Gene bank accession numbers and additional information can be accessed in the online materials and methods. Although this panel does not completely encompass the vast genetic diversity of HCV, it likely provides a broad overview of HCV diversity. We did not include the previously published GT6a (HK6a) virus chimaera because it comprises adaptive mutations in E1 and E218 which may affect interactions with antibodies. We initially included seven viruses comprising GT2-derived envelope proteins to test the hypothesis if viruses belonging to the same GT have similar neutralisation profiles. All 13 reporter viruses effectively produced infectious virus with reporter signals at least 10-fold over the assay background in a medium-scale 96-well assay format (figure 1C). We harvested reporter virus particles of three representatives 48, 72 and 96 hours after electroporation of the constructs and verified a very consistent infectivity (online supplemental figure S1A) as well as neutralisation behaviour (online supplemental figure S1B) of the individual batches. Deep sequencing of the viral RNA extracted from supernatant harvested 48 and 96 hours after electroporation demonstrated the absence of dominant variants in the E1-E2 genes that could potentially influence neutralisation phenotypes (GT2r in online supplemental figures S1C). Thus, we conclude that virus stocks collected up to 96 hours post transfection are well suited for virus neutralisation assays. Long-term passage of reporter viruses, however, is not recommended as this may lead to deletion of the transgene.
Supplemental material
Supplemental material
Supplemental material

Genetic relationship and infectivity of cell culture-derived HCV (HCVcc) reporter viruses. (A) Phylogenetic tree of E1E2 amino acid sequences. Genotypes are colour coded. The tree was constructed using the maximum likelihood method with MEGA. (B) Schematic drawing of chimeric, JFH1-based HCVcc reporter constructs. The genotype represented by the E1-E2 genes is given in front, the strain name representing these genes is given in brackets. (C) Infectivity of the given HCVcc reporter viruses quantified by luciferase reporter gene assays. Mean values of n=12 replicates and the SD are given.
To explore the sequence diversity of our virus panel at the structural level, we mapped the sequence divergence between these 13 viruses onto the crystal structure of the E2 protein ectodomain. As expected, conserved residues are distributed over the surface of the entire glycoprotein, with larger conserved patches in the CD81-binding face of the molecule (figure 2A–F).

Amino acid conservation between the 13 HCV genotypes within the large virus panel. Differences are mapped according to the conservation of chemical amino acid properties onto the E2 ectodomain structure. (A) Cartoon representation of the HCV E2 ectodomain crystallised in complex with HEPC3 and HEPC46 Fabs (PDB 6MEJ). For simplicity, the N-terminal part (aa 405–413) of E2 is not shown in (A)–(F). The composite CD81 binding site, consisting of epitope I (aa412-423; green), epitope II (aa428-446; orange) and the CD81-binding loop (aa518-542; blue), is highlighted and the HVR2 (aa459-486) is coloured in black. (B) Surface representation of the HCV E2 ectodomain with mapped amino acid conservation between the HCV genotypes included in the large virus panel. (C) Putty cartoon representation of the E2 ectodomain alignment with the amino acid represented by the tube thickness and colour coded according to the bar underneath similar to colouring according to the amino acid conservation in (B). (D)–(F) Representations of E2 according to (A)–(C), respectively, with a view turned by approximately 90 degrees along the horizontal axis. (E) The epitope contact residues of HC84.26 (PDB 5ERW) is mapped to identify its epitope, which is mapped onto the E2 surface (black contour). (G) Radar plots of individual neutralisation capacities of a panel of 8 well-known human monoclonal antibodies using all 13 cell culture-derived HCV (HCVcc) reporter viruses.
Next we profiled the reporter virus panel by neutralisation assays with a panel of well-known human monoclonal antibodies (figure 2G). As expected, we observed highly diverse strain and antibody-dependent virus neutralisation confirming that this virus panel encompasses broad sequence, structural and functional diversity. Notably, some antibodies, although targeting well-conserved epitopes, lead to vastly divergent neutralisation between viruses (eg, the HC84.26) suggesting that polymorphic residues outside of the epitopes much affect epitope recognition during infection. Superposition of the crystal structure of an epitope peptide complexed with HC84.26 Fab (PDB 5ERW) onto the E2 crystal structure identified the footprint of this antibody on E2 (black contour in figure 2E). The contact residues comprised amino acids with different degrees of conservation (ie, the fully conserved Y443 (grey), the less conserved F442 (yellow) and the hardly conserved residues in positions 444 and 446).
To determine the antigenic relationship between these viruses, we conducted neutralisation assays with polyclonal immunoglobulins (pIg) purified from 104 patients chronically infected with HCV GT 1 to 6 viruses. We had access to similar numbers of GT 1 to 4 infected patients, whereas only a few samples originated from individuals infected with GT 5 and 6 viruses (figure 3A). We used purified antibodies to avoid confounding effects caused by serum components. Our 13 reporter viruses exhibited vast differences in susceptibility to neutralisation, with GT2a (J6) being the most resistant and GT5a (SA13) the most sensitive virus (figure 3B,C). There was no correlation between infectivity of the 13 isolates and their neutralisation sensitivity (figures 1C and 3C, and online supplemental figure S2A). Moreover, binding of patient-derived antibodies to E1-E2 proteins extracted from GT5a virus transfected cells poorly correlated with neutralisation, showing that neutralisation does not directly correlate with binding to E1-E2 proteins extracted from cells (online supplemental figure S2B). With our assay configuration, 100 of 104 patient pIg neutralised GT5a (SA13) by more than 50% showing that essentially all patients mount HCV neutralising antibodies.
Supplemental material

Profiling of reporter virus neutralisation by polyclonal immunoglobulins (pIg) from 104 patients infected by GT1 to GT6 viruses. (A) Distribution of HCV genotypes of chronically infected patients in the cohort. (B) Heatmap of pIg neutralisation data with efficient virus neutralisation in red and inefficient neutralisation in blue. Crossed white rectangle, data not available. (C) Rank-ordered representation of cell culture-derived HCV (HCVcc) viruses based on their susceptibility to patient-derived pIg neutralisation. The silhouette of the violin is proportional to the number of sera with that neutralisation capacity, the solid blue bar covers 50% of all data, that is, second and third quartile, the grey dot in the middle indicates the median and ‘+’ the mean.
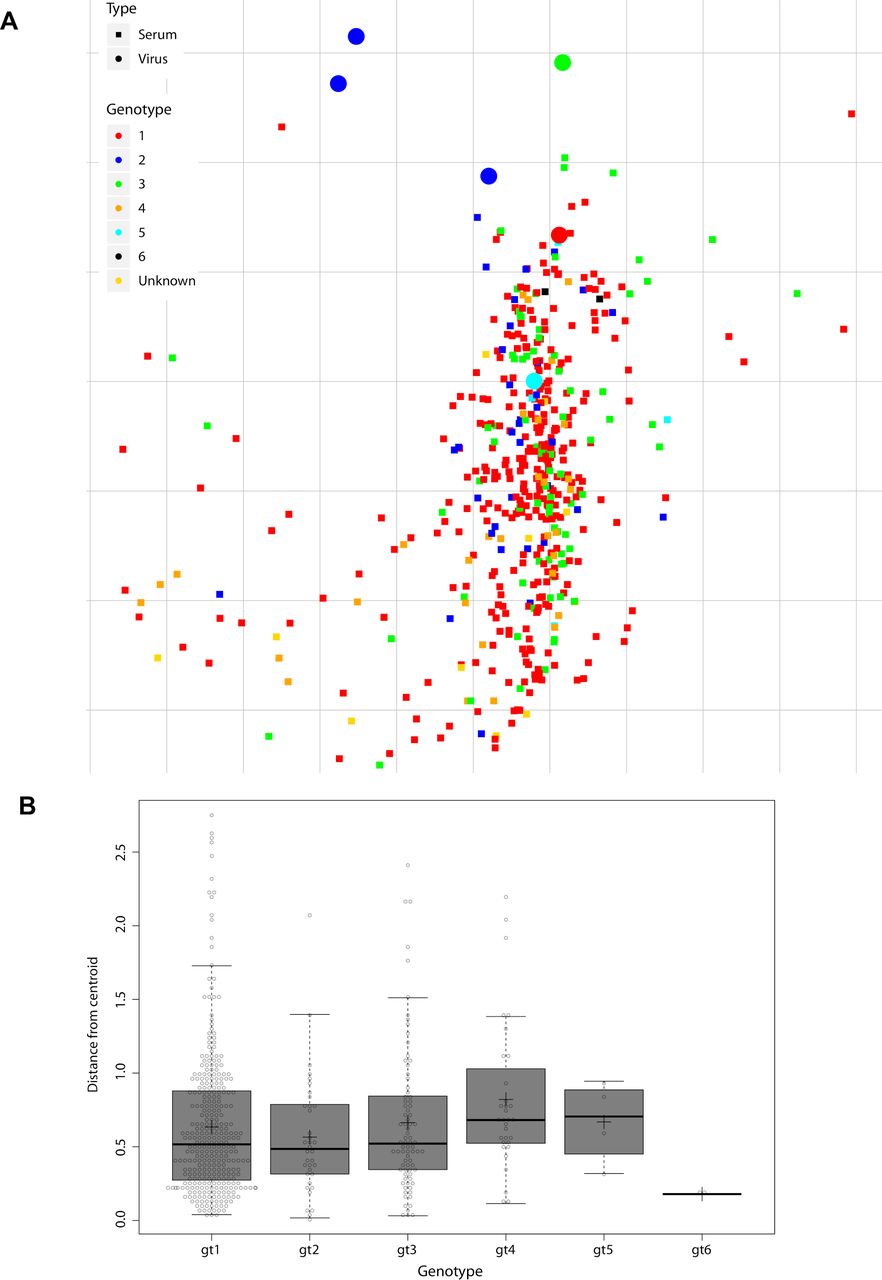
To categorise the HCVcc panel into virus groups with similar neutralisation phenotypes, we performed metric MDS, projecting the neutralisation data of virus patient–pIg pairs into a 2-D neutralisation map with one square on the neutralisation map corresponding to 10% units of residual infectivity in the neutralisation matrix (Methods; figure 4A,B). The distance between each patient-derived pIg and each virus on the map is proportional to the neutralisation efficiency, with a small distance representing very efficient neutralisation (low residual infectivity), and a large distance reflecting an inefficient neutralisation (high residual infectivity). Note that each position of a virus and a pIg sample takes into account neutralisation by all other viruses and pIg samples thus providing a comprehensive cartography. In this map, the HCVcc strains segregated into six distinct neutralisation clusters. Note that in a few cases, distances between virus and pIg sample exceeds 100%. This is caused by our weighing method, which in each iteration optimises the entire map for best fit and hereby prioritises pIg–virus pairs with lower residual distance.

Metric multidimensional scaling of neutralisation data (104 polyclonal immunoglobulins (pIg) samples and 13 viruses). (A) Two-dimensional neutralisation map (with no normalisation and 1/Dij as weight). Viruses are drawn as coloured circles, pIg as coloured squares. (B) Magnification of central cluster. (C) Representation of only the viruses shows mapping to six neutralisation clusters. Clusters are enumerated in clockwise orientation, and reference virus for each cluster is given. (D) Phylogenetic tree of E1E2 amino acid sequences of the cell culture-derived HCV (HCVcc) screening viruses. Branches of the tree are coloured according to viral genotypes. Clouds around the virus strains are coloured according to neutralisation cluster.
Notably, clustering based on neutralisation profiles did not correlate with phylogenetic relationships of viruses (figure 4C,D). For example, the seven GT 2 isolates belong to four distinct neutralisation clusters and some clusters consist of isolates of four different GTs (figure 4C). On one hand, this finding dismissed the above hypothesis that viruses belonging to the same GT have similar neutralisation behaviour. On the other hand, the MDS suggested that antibodies isolated from patients infected with GT1 viruses share common neutralisation behaviour, since these antibodies clustered somewhat more closely together compared with antibodies derived from GT2, 3 or 4 infected individuals.
CNI and selection of reference viruses
To permit efficient and balanced evaluation of potency and breadth of neutralising antibodies, we next examined if a subset of reference viruses reconstructs the HCV neutralisation space of the entire virus panel. To this end, we selected one HCV isolate, which grows to a high virus titre per neutralisation cluster, and thereby reduced the number of isolates from 13 to 6 (figures 4C and 5). In contrast to previous studies which spread their panels according to genetic diversity, this six virus panel primarily reflects HCV functional antigenic diversity rather than sequence diversity.

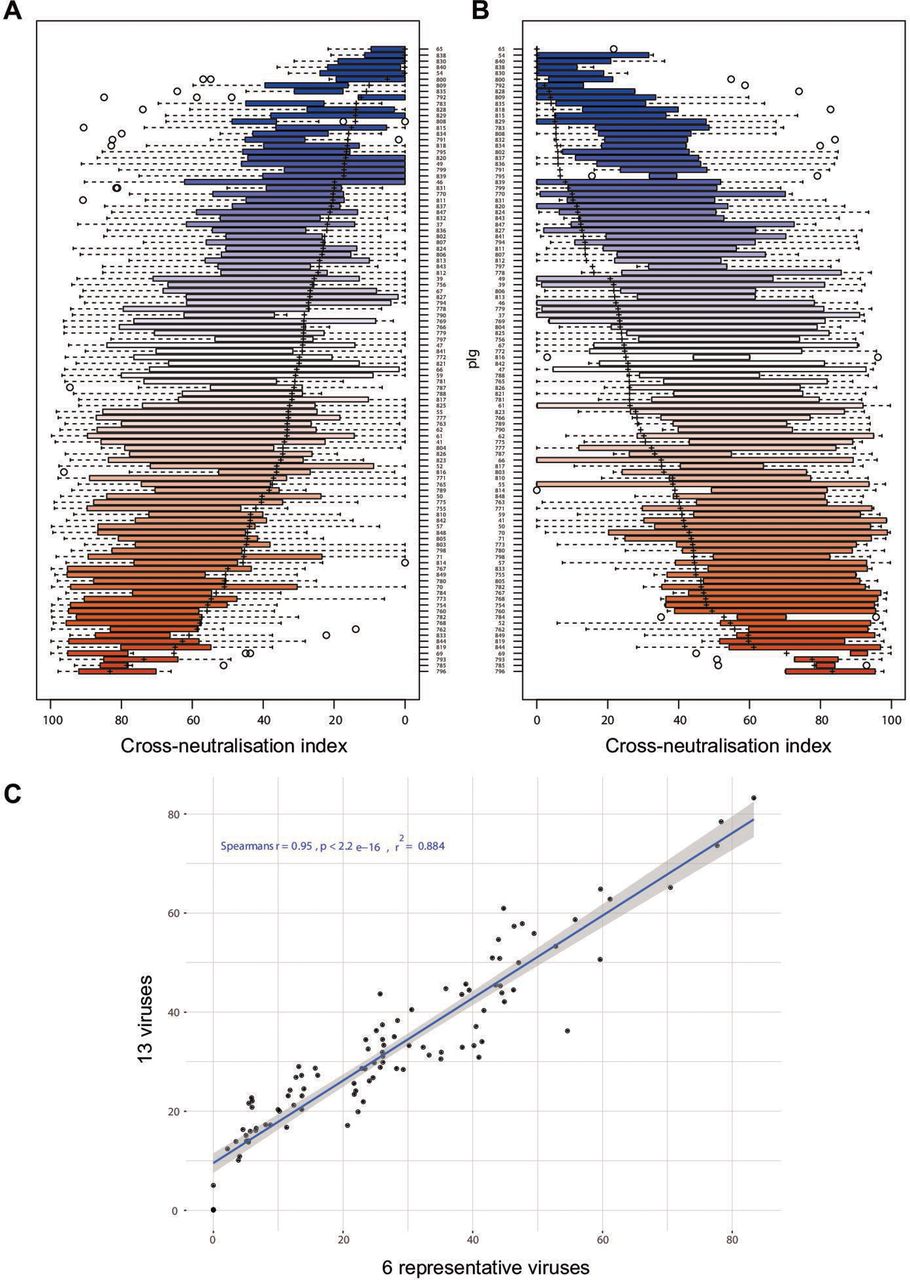
HCV reference panel faithfully reproduces data of large virus panel. (A) Rank-ordered representation of patient-derived polyclonal immunoglobulins (pIg) based on the cross-neutralisation values against all 13 cell culture-derived HCV (HCVcc) strains. (B) Rank-ordered representation of patient-derived pIg based on the cross-neutralisation of six reference viruses. The solid rectangle is the data range for second and third quartile, the dotted line indicates the date range in first and fourth quartile, ‘+’ indicates the mean cross-neutralisation and individual points outside the whiskers are outliers. (C) Correlation between patient-derived pIg rankings based on 13 HCVcc strains and the 6 reference HCVcc strains.
Both breadth and potency are important characteristics of antibody responses. Therefore, here we introduced a ‘cross-neutralisation index’ (CNI) for reporting the efficiency of virus cross-neutralisation that quantifies both features (for details, see the Materials and methods section). In essence, the CNI reports the average neutralisation across all viral strains divided by the percentage of strains neutralised by more than 50%. Using this method, antibodies with broad and potent neutralisation are favoured over antibodies with exquisite potency but selectivity to only a few strains.
Rank ordering of patient sera according to their CNI measured with the 13-virus panel (figure 5A) or the 6-virus panel (figure 5B) revealed a very high congruence between both panels. A Spearmann’s correlation analysis of the CNI indicated that results obtained with the 6-virus panel are very similar to those of the complete 13-virus panel (Spearmann’s r=0.95; p<0.0001; figure 5C). The correlation between the 6-virus panel and the 13-virus panel was also very good when using average neutralisation (Spearmann’s r=0.89; p<0.0001) for reporting cross-neutralisation (online supplemental figure S3). Therefore, reduction of the number of strains did not compromise the precision of scoring both breadth and potency of neutralising antibodies.
Supplemental material
We tested if we could also use the most resistant virus of our panel (GT2a [J6]) as a single virus for screening. However, the correlation between the 13-er panel and JcR-2a was modest (Spearman’s r=0.44, p<0.0001) (online supplemental figure S4A). Among all viruses in our panel, neutralisation of the GT2r (2r) reporter virus best correlated with the CNI of the entire 13-er panel (Spearman’s r=0.83, p<0.0001), suggesting that a prescreening with only this virus might be a cost-effective alternative (online supplemental figure S4B).
Supplemental material
There have been conflicting reports whether antibodies from patients infected with a specific viral genotype would preferentially neutralise test viruses of the cognate genotype.14 To test this, we used the data of the complete 13-virus panel against the 104 reference pIg and compared the CNIs for viruses of the cognate infecting genotype and the CNI across those viruses from all differing genotypes. We focused on polyclonal antibodies from GT1 (33 specimen) or GT2 (21 specimen) infected individuals, because three of 13 viruses belong to GT1 and seven of 13 viruses to GT2. We plotted the ratio between CNI of the cognate infecting GT to the one of the other GTs for each antibody preparation and rank ordered the specimen according to global CNI value of the entire 13-virus panel (online supplemental figure S5). The majority of antibody preparations derived from GT1-infected individuals displayed a CNI ratio greater than 1, suggesting a modest preference towards cross-neutralisation of test viruses from GT1 over non-GT1 test viruses. In contrast, except for one specimen, all antibody preparations from GT2-infected individuals displayed a CNI ratio smaller than one. Finally, we did not observe a correlation between CNI ratio and global CNI.
Supplemental material
Identification of elite neutralisers and validation of screening panel
To validate the performance of our 6-virus HCVcc screening panel, we evaluated cross-neutralisation of polyclonal IgGs prepared from 392 patients infected with GT 1–5 viruses (figure 6A). We rank-ordered patient-pIg based on CNI across the 6-virus panel and selected the top 2% polyclonal IgGs as top neutralisers (ie, pIg from nine patients) (figure 6A,B). To prove that our screening with the 6-virus panel identified patients with full spectrum cross-neutralisation efficacy, we tested neutralisation across 12-virus HCVcc strains. Indeed, all elite neutralisers had cross-neutralising antibodies suppressing infection of these viruses by more than 50% (figure 6B). This was a strong indication that our screening approach is reliable. Next, we used the entire data set including all patient-pIg (496 patients with 330 from GT1, 36 from GT2, 80 from GT3, 32 from GT4, 4 from GT5 and 2 from GT6) to validate balance and performance of the 6-virus panel. Projecting the neutralisation data of virus–patient immunoglobulin pairs into a 2-D map, we observed a dense cloud with samples from patients infected with differing GTs well intermixing with each other, suggesting absence of genotype-dependent subclustering of patient samples (figure 7A). For each pIg specimen, we calculated the weighted distance from the central point of its cognate genotype (figure 7B). Using this approach, we noted almost identical average distances between specimens to the centroid of their cognate GT cluster within the 2-D map, suggesting a very similar diversity of polyclonal antibody responses among patients infected with different GTs. Finally, we examined the average CNI of polyclonal antibodies from GT1-GT6-infected patients against the 6-virus panel. Samples from GT1-GT4-infected individuals exhibited comparable average CNIs ranging between 7 and 25 (online supplemental figure S6). Due to a low sample number, we cannot make rigorous statements for GT5 and GT6. Specimens from GT2-infected individuals had the highest average CNI which was significantly higher than GT1 (p=0.0039) and GT4 (p=0.0006). Despite of the modest GT dependence of CNI, this calibration suggested that the 6-virus panel reports HCV neutralisation in a very balanced manner across highly diverse human specimen.
Supplemental material

Identification of elite neutralisers using six reference viruses. (A) Heatmap of virus neutralisation by 392 patient-derived polyclonal immunoglobulin (pIg) against given six reference viruses. (B) Confirmation that the 2% best patient-derived pIg samples efficiently neutralise 12 different cell culture-derived HCV (HCVcc) strains.
Metric multidimensional scaling of neutralisation data (496 polyclonal immunoglobulin (pIg) samples and 6 reference viruses). (A) Two-dimensional neutralisation map (with no normalisation and 1/Dij as weight). Viruses are drawn as coloured circles, pIg as coloured squares. (B) Distance of each pIg specimen to the central point (ie, centroid) of the pIg cluster of its cognate genotype. Cognate genotype means the genotype of the infecting virus of the patient that the sample was drawn from. The box covers 50% of the data range, that is, the second and third quartile, whiskers indicate the complete data range from first to fourth quartile, thick black bar indicates the median and ‘+’ the mean. The points outside the whiskers are outliers.
Discussion
Several studies described the use of HCV screening panels for characterisation of HCV-specific antibodies. In most cases, HCVpp were used,14 and screening panels were entirely focused on GT1-derived E1-E2 sequences16 or had a strong preference for this GT.22 In addition, some HCVcc panels exist,29 30 but studies using these panels for assessing the diversity of human polyclonal antibodies across multiple donors and viral genotypes are lacking. Finally, these previous panels are based on the genetic relationship of viruses and not on functional antigenic properties. Currently, there is substantial variation between HCV neutralisation tests in use, complicating standardised measurement of viral cross-neutralisation and in turn comparison between studies. This is particularly problematic because immune competent in vivo models for assessment of vaccine-induced protection are lacking. This limitation augments the need for predictive in vitro assays for instance to prioritise vaccine candidates based on quantitative measures of virus cross-neutralisation.
Here, we aimed to establish a robust method for rigorous, balanced and comparative quantification of potency and breadth of human anti-HCV antibody responses across diverse human donors. To this end, we created a panel of HCVcc reporter viruses encompassing 13 strains. These viruses represent five of seven GTs and nine independent subtypes, thus encompassing a large portion of HCV genetic diversity. Although these reporter viruses differ in absolute efficiency of virus production up to 100-fold (figure 1C), each produces sufficiently high titres for medium throughput 96 well-based screening assays. Unlike in a previously established HCVpp panel,22 we did not observe a correlation between virus infectivity and susceptibility to neutralisation in the 13-er panel, ruling out confounding effects due to differential virus infectivity (online supplemental figure S2A).
To judge the performance of this novel HCVcc screening panel, we profiled virus neutralisation across purified pIg from 104 chronically infected patients (GT1 (33 patients), GT2 (21 patients), GT3 (25 patients), GT4 (21patients), GT5 (2 patients) and GT6 (2 patients)). This revealed vast differences in virus neutralisation between patient specimen and in viral susceptibility to neutralisation (figure 3). Rank ordering of all viruses according to neutralisation sensitivity showed that the panel encompasses a wide and evenly distributed spectrum of neutralisation susceptibility. Of note, essentially all patients (approximately 96%) mounted detectable neutralising antibodies, although their breadth and potency was variable. Virus neutralisation by pIg did not correlate with pIg binding to E1-E2 proteins from cell extracts (online supplemental figure S2B), indicating that other factors such as the site of antibody binding determine neutralisation. Because polyclonal antibodies were used, it is possible that presence of non-neutralising antibodies influenced the neutralisation assay thus contributing to this discrepancy. There is some controversy about whether the infecting viral genotype skews heterologous neutralisation towards more efficient neutralisation of test viruses of the cognate genotype.14 Therefore, we examined if pIg from GT1 or GT2 virus-infected patients preferentially neutralise test viruses of these GTs over the other remaining GTs. This was the case for the GT1 but not for the GT2-derived samples (online supplemental figure S5). We do not know the reason for these differences between GT1 and GT2 samples. One possibility is that the selection of strains in our 13-virus panel with a large proportion of GT2-derived viruses accounts for this. The overall HCV cross-neutralising activity as quantified by the CNI did not correlate with more or less cognate-genotype-centric neutralisation. In other words, neither a preference for the cognate infecting GT nor the absence of such a preference precludes broad and potent neutralisation.
To discover functional differences between viruses concerning antibody neutralisation, we used metric MDS projecting the complete neutralisation data of virus–patient immunoglobulin pairs into a 2-D map. Using this approach, we made two important observations. First, viruses mapped to six distinct neutralisation clusters representing distinct viral biotypes in relation to their interplay with pIg from HCV-infected patients. This analysis enabled reduction of our large 13-virus panel to a much more compact screening system comprising a single reference virus representing each of the six neutralisation clusters. Second, the MDS revealed a tighter clustering of pIg from GT1-infected patients compared with pIg from other GTs (figure 4A,B). This difference was also evident when analysing the average distance of pIg specimen to the centroid of their respective genotype (ie, distance of GT1 pIg sample to centroid of GT1 pIg cluster, and so on; online supplemental figure S7A). Together, this suggested that pIg from GT1 patients are more related to each other than those from other GTs. We do not know the reason for this, but suspect that a bias of the 13-virus panel for viruses with certain functional properties may account for this: four viruses of the 13-virus panel represent neutralisation cluster 1, and three cluster 4, whereas all remaining clusters are represented by two or one virus only (figure 4C). Notably, MDS of the complete dataset including all 496 patient-derived pIg analysed with the 6-virus panel—in which each neutralisation cluster is represented by a single virus—did no longer show an unusually dense clustering of GT1-derived pIg specimen (figure 7A,B). Moreover, MDS analysis of the neutralisation data of 104 specimen and only the 6-reference viruses changed the average centroid distance of GT1 samples such that it closely matched the ones of the other GTs (online supplemental figure S7B). Thus, although both the large 13-virus cluster and the compact 6-virus cluster deliver congruent results (figure 5), we believe that the 6-virus cluster reports HCV cross-neutralisation in an even more balanced manner. Moreover, we show that a large screening of 392 specimen with the 6-virus panel readily identified elite neutralisers that efficiently cross-neutralised a broad spectrum of strains. Taken together, these results justify the use of this set of six reference viruses as a robust, efficient and balanced method to score HCV neutralisation.
Supplemental material
We observed some differences in the average potency and breadth of pIg depending on which GT a patient was infected (online supplemental figure S6). Given limited sample numbers, we are unable to make rigorous statements about GT5 or GT6-derived specimens. However, for GT1 to GT4, sample size was relatively large and we observed in part significant differences in cross-neutralisation: pIg samples from GT2-infected patients exerted significantly greater cross-neutralisation compared with GT1 or GT4. The reason for this is unknown. One possibility is that indeed GT2 viruses may induce somewhat more potent antibody responses. This may have to do with specific features of GT2-derived envelope proteins or other features of GT2 viruses. Alternatively, these modest differences may be a reflection of a modest bias in our screening panel. Additional studies involving more virus strains and patient pIg will help to resolve this question. It will be useful to integrate such additional data into the current HCV neutralisation map to find out if additional viral neutralisation clusters exist. In the end, it will be very interesting to explore if these six functional neutralisation clusters represent distinct viral antigenic clusters. If this was the case, vaccination approaches aiming at induction of broad neutralising antibodies may benefit from combining glycoproteins from viruses representing these clusters.
The high resolution profiling of almost 500 patient-derived pIg specimen allowed us to develop, calibrate and validate a novel screening method for quantitative comparison of antibody responses to HCV. The screening system composed of six reference viruses should substantially facilitate standardised evaluation of HCV neutralisation across different laboratories. The discovery of six functionally discernible virus neutralisation clusters suggests the existence of distinct viral biotypes in regard to interplay with neutralising antibodies. The MDS-based evaluation of antibody responses against diverse viruses opens the door for deep phenotyping of HCV infection and vaccine-induced antibodies. This should help in the development of vaccines inducing HCV protective antibodies.
Data availability statement
Data sharing not applicable as no datasets generated and/or analysed for this study. Data are available upon reasonable request. All data relevant to the study are included in the article or uploaded as supplementary information. Sequences of the reporter viruses were submitted to the NCBI GenBank database.
Ethics statements
Patient consent for publication
Ethics approval
In case of HCV Research UK, the study protocol was approved by the National Research Ethics Service (NRES) Committee East Midlands (reference 11/EM/0323). Use of the sera from Cologne, Bonn and Hannover was approved by the local ethical committees (ethical vote 017/16, Bonn Department of Internal Medicine I; ethical vote 11-312, Cologne Department of Virology; ethical vote 2148-2014, Hannover Medical School).
References
Supplementary materials
Supplementary Data
This web only file has been produced by the BMJ Publishing Group from an electronic file supplied by the author(s) and has not been edited for content.
Footnotes
DB and AB are joint first authors.
ACM and TP are joint senior authors.
DB and AB contributed equally.
Contributors Conceived and designed experiments: DB, TP, AM. Performed the experiments: DB, MD, CG, TKh, ML. Analysed the data: DB, AB, DT, ML, AM, TP. Contributed reagents/material/analysis tools: PB, MC, LD, FK, LS, TKh. Wrote the manuscript: DB, AB, AM, TP. Computational experimental design: AM.
Funding Twincore is a joint venture of Hannover Medical School and the Helmholtz-Centre for infection research. TP, AM and TK are funded by the Deutsche Forschungsgemeinschaft (DFG, German Research Foundation) under the Germany’s Excellence Strategy – EXC 2155 “RESIST” – Project ID 39087428. They also receive support through the German Center of Infection Research in the HCV vaccine project (TTU 05.808). TP is also funded by the Helmholtz-Alberta initiative for infectious disease research (HAI-IDR). LJS is funded by the Deutsche Forschungsgemeinschaft – Projektnummer 158989968 - SFB 900, project B10. The funding organisations had no involvement in the study design, the collection of data, their analysis and interpretation, the writing of the article and the decision to submit the article for publication.
Competing interests MC reports personal fees from Abbvie, personal fees from Gilead Sciences, personal fees from Janssen-Cilag, personal fees from Merck, MD, personal fees from Biogen, personal fees from Falk Foundation, personal fees from Siemens, personal fees from Spring Bank, personal fees from GlaxoSmithKline, outside the submitted work.
Provenance and peer review Not commissioned; externally peer reviewed.
Supplemental material This content has been supplied by the author(s). It has not been vetted by BMJ Publishing Group Limited (BMJ) and may not have been peer-reviewed. Any opinions or recommendations discussed are solely those of the author(s) and are not endorsed by BMJ. BMJ disclaims all liability and responsibility arising from any reliance placed on the content. Where the content includes any translated material, BMJ does not warrant the accuracy and reliability of the translations (including but not limited to local regulations, clinical guidelines, terminology, drug names and drug dosages), and is not responsible for any error and/or omissions arising from translation and adaptation or otherwise.