Article Text

Abstract
Objective The involvement of HBV DNA integration in promoting hepatocarcinogenesis and the extent to which the intrahepatic HBV reservoir modulates liver disease progression remains poorly understood. We examined the intrahepatic HBV reservoir, the occurrence of HBV DNA integration and its impact on the hepatocyte transcriptome in hepatitis B ‘e’ antigen (HBeAg)-negative chronic hepatitis B (CHB).
Design Liver tissue from 84 HBeAg-negative patients with CHB with low (n=12), moderate (n=25) and high (n=47) serum HBV DNA was analysed. Covalently closed circular DNA (cccDNA), pregenomic RNA (pgRNA) were evaluated by quantitative PCR, whole exome and transcriptome sequencing was performed by Illumina, and the burden of HBV DNA integrations was evaluated by digital droplet PCR.
Results Patients with low and moderate serum HBV DNA displayed comparable intrahepatic cccDNA and pgRNA, significantly lower than in patients with high HBV DNA, while hepatitis B core-related antigen correlated strongly with the intrahepatic HBV reservoir, reflecting cccDNA quantity. Whole exome integration was detected in a significant number of patients (55.6%, 14.3% and 25% in high, moderate and low viraemic patients, respectively), at a frequency ranging from 0.5 to 157 integrations/1000 hepatocytes. Hepatitis B surface antigen >5000 IU/mL predicted integration within the exome and these integrations localised in genes involved in hepatocarcinogenesis, regulation of lipid/drug metabolism and antiviral/inflammatory responses. Transcript levels of specific genes, including the proto-oncogene hRAS, were higher in patients with HBV DNA integration, supporting an underlying oncogenic risk in patients with low-level to moderate-level viraemia.
Conclusions HBV DNA integration occurs across all HBeAg-negative patients with CHB, including those with a limited HBV reservoir; localising in genes involved in carcinogenesis and altering the hepatocyte transcriptome.
- chronic viral hepatitis
- hepatitis B
- liver biopsy
- hepatocellular carcinoma
This is an open access article distributed in accordance with the Creative Commons Attribution Non Commercial (CC BY-NC 4.0) license, which permits others to distribute, remix, adapt, build upon this work non-commercially, and license their derivative works on different terms, provided the original work is properly cited, appropriate credit is given, any changes made indicated, and the use is non-commercial. See: http://creativecommons.org/licenses/by-nc/4.0/.
Statistics from Altmetric.com
Significance of this study
What is already known on this subject?
Hepatitis B ‘e’ antigen (HBeAg)-negative phase of HBV infection is associated with a wide disease spectrum, ranging from quiescent low viraemic disease to chronic HBeAg-negative hepatitis, with a high risk of evolution to cirrhosis and hepatocellular carcinoma.
Hepatitis B surface antigen (HBsAg) and hepatitis B core-related antigen (HBcrAg) are increasingly used as surrogates of the intrahepatic HBV reservoir.
HBV DNA integration is believed to play a key role in hepatocarcinogenesis.
What are the new findings?
HBV DNA integration in the whole exome is detected in a significant proportion of HBeAg-negative patients, including low viraemic patients with a limited HBV reservoir.
HBV DNA integrations occur in regions crucial for human gene expression and involve genes regulating cell proliferation, carcinogenesis in addition to antiviral immunity and hepatocyte metabolism.
High levels of HBsAg (>5000 IU/mL) can predict HBV DNA integration events in HBeAg-negative patients.
How might it impact on clinical practice in the foreseeable future?
The demonstration of HBV DNA integration in patients with chronic hepatitis B perceived as low risk mandates a re-evaluation of treatment candidacy.
Future studies will have to dissect the role of HBV DNA integration in hepatocarcinogenesis and how this can be mitigated against.
Novel HBV therapies should target both integrated HBV DNA in addition to covalently closed circular DNA to enhance treatment outcomes and reduce hepatocellular carcinoma risk.
Introduction
Chronic hepatitis B (CHB) virus infection is a dynamic disease reflecting the balance between the virus itself and the host immune response. In CHB, the hepatitis B ‘e’ antigen (HBeAg)-negative phase is associated with a spectrum of clinical outcomes spanning from HBeAg-negative chronic infection (serum HBV DNA <2000 IU/mL and normal alanine aminotransferase (ALT)) to HBeAg-negative chronic hepatitis characterised by a higher risk of disease progression, the development of cirrhosis and hepatocellular carcinoma (HCC).1
There remains a paucity of data on the extent and productivity of the intrahepatic HBV reservoir (in terms of covalently closed circular DNA (cccDNA), intrahepatic total HBV DNA (itHBV DNA) and pregenomic RNA (pgRNA)) in the HBeAg-negative phase of CHB. Unravelling this issue is critical since the intrahepatic HBV reservoir plays a pivotal role in modulating liver disease progression.2 3 Elucidating the accuracy of novel non-invasive HBV biomarkers in predicting the intrahepatic HBV reservoir also remains an unmet clinical need.4 5 HBV replication can promote HBV DNA integration into the genome of the human hepatocyte, considered a key mechanistic step underlying HBV-mediated carcinogenesis, even in the absence of necroinflammation.6–8 Indeed, HBV DNA integration can compromise cell genome stability and modify the expression of genes regulating cell cycle/proliferation, predisposing the hepatocytes to pre-neoplastic transformation.7
HBV DNA integration has been detected in the early phases of CHB virus infection.9 Importantly, a recent study from our group demonstrated high rates of HBV DNA integration along with clonal hepatocyte expansion in patients with HBeAg-positive chronic infection, highlighting a potential carcinogenetic risk in these patients, often considered to be in a benign disease phase, devoid of disease progression.9 A lower rate of HBV DNA integration has been observed in HBeAg-negative patients with CHB.10 Although controversial, it has been hypothesised that, during the immune clearance phase and HBeAg seroconversion, the development of a strong immune response may favour the selection of those hepatocytes in which HBV DNA integrations confer a survival advantage, thus potentially contributing to liver cancer development.8 11 12
The occurrence and localisation of HBV DNA integration in the later phases of CHB virus infection and particularly in those considered to have quiescent disease, such as HBeAg-negative patients with low-level viraemia, remains understudied. A better understanding of this disease phase is critical in order to determine the risk of HCC development. Moreover, there is a need to define the localisation of integrated HBV DNA in genes regulating hepatocyte function other than proliferation (such as cell metabolism or recognition by the immune response) and the impact of HBV DNA integration on perturbing cellular gene expression.
In light of this knowledge gap, we studied HBeAg-negative patients across the disease spectrum, including those with low-level to moderate-level viraemia, in order to provide a comprehensive characterisation of the intrahepatic HBV reservoir and to investigate how this might determine the extent and localisation of HBV DNA integration in the whole exome. Furthermore, we report for the first time on the role of HBV DNA integration in altering the transcriptome profile of human hepatocytes in these patients. This highlights the importance of a more circumspect approach in the management of low-to-moderate viraemic HBeAg-negative CHB and whether greater consideration should be given to lowering treatment thresholds in these patients.
Materials and methods
Study population
Eighty-four HBeAg-negative patients with CHB were recruited from Viral Hepatitis clinics at The Royal London Hospital (Barts Health NHS Trust) UK from 2013 to 2016. All patients underwent a liver biopsy and tissue surplus to diagnostics was used for experimental assays as described. Matched serum samples were also collected (online supplemental figure S1 depicts the patient cohort and virological analyses that were performed). All patients with CHB were treatment-naïve and monitored for ≥2 years with virological and biochemical parameters for disease stratification prior to tissue sampling. Patients were HBV mono-infected; and co-infection with HCV, HIV and hepatitis Delta virus was excluded. Patients were stratified according to serum HBV DNA levels (calculated as the mean value obtained by consecutive measurements during a 2-year period of monitoring before undergoing liver biopsy):
Supplemental material
Group 1: patients with serum HBV DNA persistently <2000 IU/mL; low viraemia (n=12).
Group 2: patients with serum HBV DNA between 2000 and 20 000 IU/mL; moderate viraemia (n=25).
Group 3: patients with serum HBV DNA persistently >20 000 IU/mL; high viraemia (n=47).
DNA and RNA isolation from liver biopsy tissue
Total intrahepatic DNA and RNA were isolated from patients’ liver tissues by using AllPrep DNA/RNA Mini Kit (QIAGEN, Hilden, Germany) (procedure described in online supplemental material (SM)).
Supplemental material
Quantification of intrahepatic HBV markers: total HBV DNA, cccDNA and pgRNA
Intrahepatic DNA was used to perform itHBV DNA and cccDNA quantification as described in SM. pgRNA levels were determined for 41/84 liver biopsies with an available RNA sample, by applying an in-house digital droplet (dd)-PCR assay (described in SM). itHBV DNA, cccDNA and pgRNA values were normalised to cell number, according to the quantification obtained by Albumin-based ddPCR copy number assay: Alb, Human (Bio-Rad, Pleasanton, California, USA) and, thus reported as itHBV DNA, cccDNA and pgRNA copies/1000 cells. At least three negative controls and one positive control were included in each real-time and ddPCR reaction to verify the amplification efficiency and to exclude sample contamination.
Serological HBV markers: quantification of HBV DNA, HBsAg and HBcrAg
Serum HBV DNA quantification was performed by a real-time PCR using the Cobas Ampliprep/Cobas TaqmanHBV assay (Roche Diagnostics, Manheim, Germany; lower limit of quantitation (LLOQ): 20 IU/mL). Serum hepatitis B surface antigen (HBsAg) was quantified with Elecsys HBsAg II kit/Cobas (Roche Diagnostics; LLOQ: 0.05 IU/mL). Hepatitis B core-related antigen (HBcrAg) was quantified by a chemiluminescent assay, Lumipulse GHBcrAg assay (Fujirebio Europe, Gent, Belgium; LLOQ: 3 logU/mL).
Assessment of liver fibrosis
Liver fibrosis was assessed by a specialist liver histopathologist using the Ishak scoring system. Values from 0 to 2 were considered as absence of or mild fibrosis only, while values from 3 to 6 were considered as moderate-to-severe fibrosis/cirrhosis.
HBV genotyping
For each patient, HBsAg population-based sequencing (226 amino acids) was performed on DNA extracted from serum sample, following a protocol previously described.13 A phylogenetic approach was used to determine HBV genotype.
Whole exome sequencing
Whole exome sequencing (WES) was carried out for 40/84 liver biopsies where adequate DNA was available, by applying a well-consolidated next-generation sequencing approach, based on Illumina technology routinely used for diagnostic purposes at Eurofins Genoma group in Rome, Italy (detailed description in SM). This procedure contains a crucial step for capturing the exome-amplified fragments, allowing an in-depth analysis of the coding fraction of human genome and its flanking intronic/intergenic regions.14 Overall, median (IQR) coverage of exome sequencing was 115× (90×–140×). A stringent bioinformatic pipeline, described in SM and schematised in figure 1, was applied to determine HBV integration sites. The functionality of genes involved in HBV integration was retrieved by querying three different online available databases: Gene Cards, Protein Atlas and Kyoto Encyclopedia of Genes and Genomes (KEGG) databases (figure 1).15–17 The publicly available Virus Integration Site DataBase (VISDB) was used to verify if the observed HBV DNA integrations occurred in genes described as targets of HBV DNA integrations in previous studies analysing liver samples (tumour/peritumour/non-tumour). Indeed, VISDB collects information from literature on high-quality viral integration sites in the human genome and related malignancies (https://bioinfo.uth.edu/VISDB/index.php/homepage). For HBV, VISDB has data on 20 558 integration sites from 45 publications.
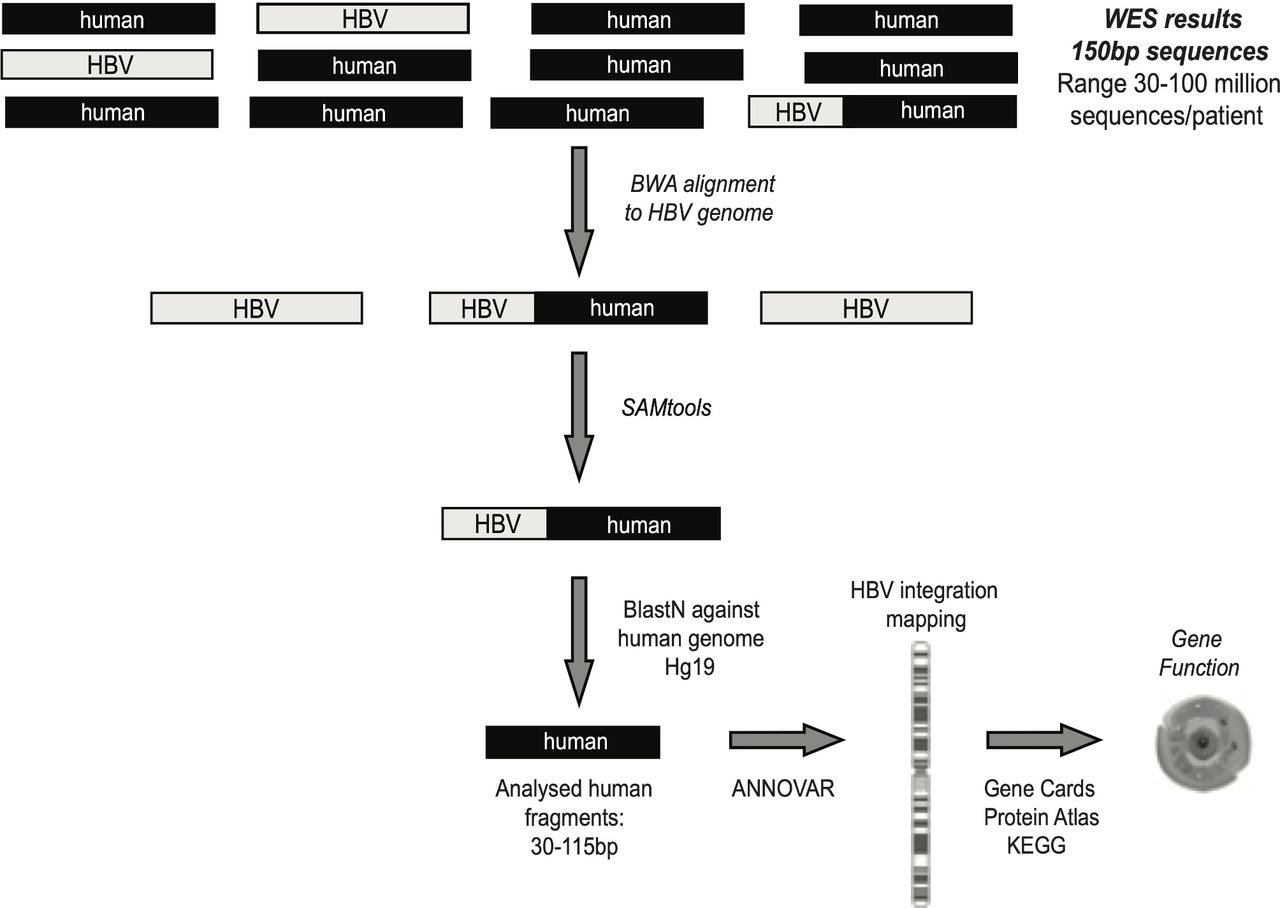
Bioinformatic workflow for the identification of chimeric HBV human sequences. Following quality control (by Trimmomatic), sequencing reads were aligned to virus-specific genome by Burrows Wheeler Aligner-Maximal Exaxt Matches (BWA-MEM) in order to extract all reads that contained HBV fragments. SAMtools software was applied to extrapolate all chimeric HBV human sequences, representing the HBV integrations into human genome. ANNOVAR software was used to map HBV integrations at chromosome and gene level. The functionality of genes involved in HBV integration was retrieved by Gene Cards, Protein Atlas and KEGG databases. WES, whole exome sequencing.
Quantification of HBV integrations by a digital droplet PCR approach
For HBV DNA integrations occurring in intronic/exonic human genomic regions detected by WES, ad hoc ddPCR assays were designed in order to further confirm their presence and to quantify the total number of hepatocytes harbouring HBV DNA integration events (detailed description provided in SM).
Whole transcriptome analysis
Whole transcriptome sequencing was performed on a subset of 15 patients with available material: 7 patients with confirmed HBV DNA integration in the whole exome and 8 without confirmed HBV DNA integration in the whole exome in order to evaluate the differential expression of overall mRNAs in liver biopsies. RNA libraries were sequenced with Illumina Hiseq 2000 (Illumina, California, USA). Approximately 45–60 million paired-end 150 base pair reads were obtained per sample. The relative abundance of each annotated transcript for each sample was reported in units of transcripts-per-million (TPM) (detailed description in SM).
Statistical analysis
Mann-Whitney test for continuous variables and χ2 test for discrete variables were applied to define statistically significant differences. The area under the receiver operating characteristics (AUROC) was used to define the thresholds of peripheral parameters with the best performance in predicting intrahepatic reservoir (cccDNA <1.5 log copies/1000 cells) and the threshold of HBsAg levels with the best performance in predicting the occurrence of HBV integration into the human genome.
Results
Characterisation of serum and intrahepatic HBV markers
Eighty-four HBeAg-negative CHB treatment-naïve patients, stratified according to viral load (see ‘Materials and methods’ section) were included in the study. There were no significant differences in clinical and demographic data between the patient groups (table 1). Importantly, no/mild fibrosis (F0-2) was found in 83.3% of the study patients.
Patient characteristics
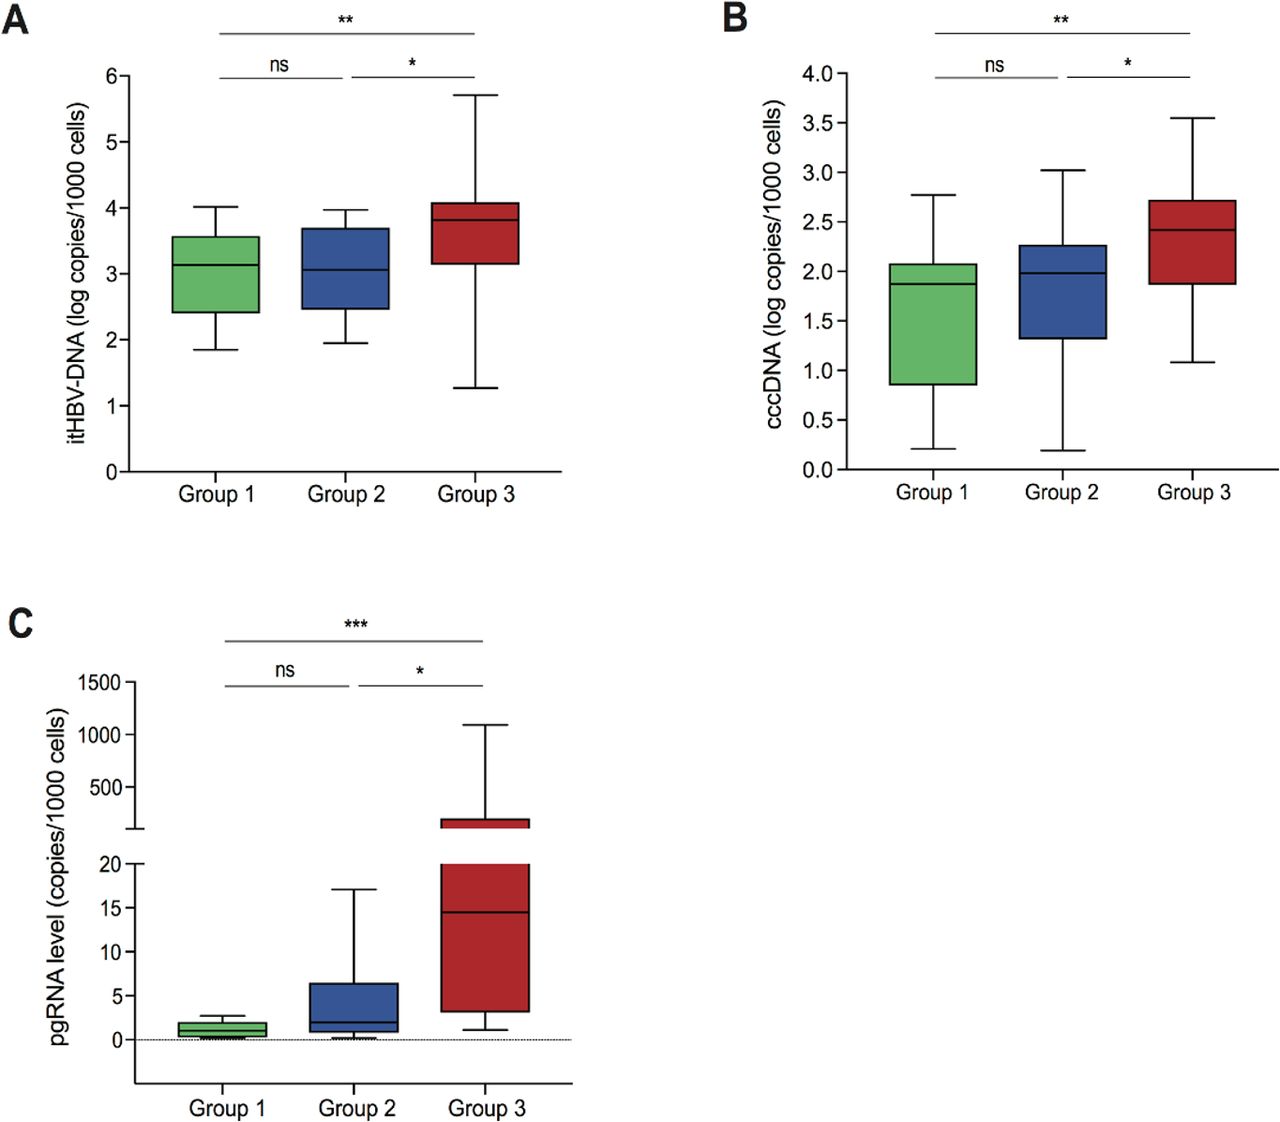
HBsAg levels were comparable between all patient groups, however, most patients in groups 1 and 2 displayed HBcrAg <3 logU/mL (indicating a negative result) (66.7% and 81.1%, respectively; p=0.38). Conversely, HBcrAg levels were significantly greater in high viraemic patients, median (IQR) HBcrAg 4.1 (3.3–4.8) logU/mL (p=0.03 for group 1 vs group 3 and p<0.001 for group 2 vs group 3) (table 1). Similarly, patients with low-level and moderate-level viraemia demonstrated comparable median levels of itHBV DNA and cccDNA (figure 2A,B), which were significantly lower than those observed for patients with high viraemia (p=0.004 to 0.02) (figure 2A,B). Likewise, pgRNA levels were comparable between groups 1 and 2, although the distribution of pgRNA was narrower in group 1 (figure 2C). Analogous to HBcrAg levels, patients in group 3 were characterised by significantly higher pgRNA levels than the other two groups (group 3 vs group 2, p=0.002; group 3 vs group 1, p<0.001) (figure 2C). By AUROC, the combination of serum HBV DNA <20 000 IU/mL, HBcrAg <3 logU/mL and HBsAg <1000 IU/mL identified a limited HBV reservoir (defined as cccDNA <1.5 log copies/1000 cells) with 84.3% diagnostic accuracy, 90% positive predictive value (PPV) and 83.3% negative predictive value (NPV) (online supplemental table S1).

Distribution of intrahepatic HBV markers in the patient groups. Box plots displaying the distribution of intrahepatic total HBV DNA (itHBV DNA) (A), covalently closed circular DNA (cccDNA) (B) and pregenomic RNA (pgRNA) (C) in group 1, group 2 and group 3, respectively. Statistically significant differences were assessed by Mann-Whitney U test. Significant changes marked with asterisks, *p<0.05; **p<0.01; ***p<0.001; ns, not significant.
The intrahepatic HBV reservoir was also evaluated across HBV genotypes. In particular, patients infected with HBV genotype D were characterised by a lower cccDNA and intrahepatic HBV DNA compared with genotypes A and E (for cccDNA: 1.9 (0.9–2.6) vs 2.7 (2.0–3.2) and 2.4 (2.1–2.7) log copies/1000 cells, p=0.007 and p=0.004; for intrahepatic DNA: 3.2 (2.9–3.7) vs 4.1 (3.7–4.2) and 3.9 (3.5–4.0) log copies/1000 cells, p=0.005 and p=0.02). Similarly, the profile of HBV genotype D correlated with a lower pgRNA than genotype A (3 (1.4–11) vs 19 (7–32) copies/1000 cells, p=0.05). Conversely, data from genotype D patients showed a comparable intrahepatic reservoir in respect to HBV genotypes B and C.
HBV integration events occur throughout the spectrum of HBeAg-negative CHB
HBV DNA integration was then investigated in the whole exome (defined by exons, exon-flanking intronic regions and intergenic regions located at <500 kilobase pairs from exons) obtained from 40 out of 84 patients, where sufficient DNA was available for WES analysis. Next-generation sequencing technologies are used by WES and have contributed to unveiling the landscape of genetic and epigenetic aberrations.18 The subset of 40 patients included in the analysis, accurately reflected the overall study population in disease stratification according to serum HBV DNA levels (online supplemental table S2). Median (IQR) sequence coverage depth was 115× (90×–140×), with a median (IQR) number of paired-end reads of 70 (54–84) millions per patient, consistent with the recommendation for WES.19 20 At least one HBV DNA integration event in the whole exome was detected in all patient groups with the highest prevalence in group 3 (55.6%, 10/18). Notably, HBV DNA integration was also evident in 14.3% (2/14) and 25% (2/8) of patients in groups 2 and 1, respectively, despite lower viraemia and a more limited intrahepatic reservoir. HBV DNA integration profiles were also evaluated across HBV genotypes; integration was detected more frequently in genotype D patients (38.9%) followed by genotype E (33.3%) and genotype C patients (22.2%). For HBV genotype A and B, HBV DNA integration was analysed in two patients each, where integration events were detected in both (2/2) patients infected with genotype A, but in neither of those with genotype B HBV infection.
Differential localisation of HBV DNA integration events in the whole exome
The identified HBV DNA integrations were mapped with regard to the cellular chromosomes. Integration events were detected in 12 chromosomes without evidence of preferential chromosomal hotspots (figure 3A). A total of 16 HBV integration events were detected. Most HBV DNA integration events (68.7%, 11/16) occurred within exon-flanking introns. Among them, eight HBV DNA integrations were detected within or in close proximity to signal sequences necessary for the RNA splicing, an event crucial for mRNA synthesis and in turn for protein functionality (table 2). Furthermore, HBV DNA integration was also detected in exons (6.3%, 1/16) and in intergenic regions (25%, 4/16). The HBV DNA integration events occurring in regions crucial for mRNA synthesis were also quantified by ddPCR (eight within or in close proximity to signal sequences necessary for RNA splicing and the single event in the exon) (table 3). The quantification of these HBV DNA integration events ranged from 0.5 to 157 integrations per 1000 hepatocytes (median=5 integrations per 1000 hepatocytes) (table 3).
Location of HBV DNA integrations in coding regions of the human genome by whole exome sequencing
Quantification of HBV DNA integrations involving intron/exon human regions by droplet digital PCR

Visualisation of HBV DNA integrations with regard to human chromosomes and the viral genome. (A) Each line defines HBV integration breakpoints at particular loci in the human genome (hg19). (B) The histogram reports the frequency of integration for each nucleotide position of HBV genome. The locations of the genes encoding HBV polymerase (green), core (violet), S (pink) and X (red) proteins are shown.
By gene ontology, HBV DNA integrations localised in human genes regulating cell proliferation (NUP85, ANKRD52, ELAC2, COL18A1 and AGBL5) in five patients, including those patients with low-level and moderate-level viraemia (table 2). Notably, by using the publicly available database VISDB, collecting 20 558 HBV integration sites in tumour/peritumour/non-tumour liver samples from 45 publications; the ANKRD52, COL18A1 and AGBL genes involved in HBV DNA integration were previously detected in tumour or peritumour liver samples. Integrated HBV DNA was also found in genes regulating drug or lipid metabolism (CYP2UI, LMF-1) and in modulating antiviral or inflammatory responses (NR3C1, IFITM1) (table 2). According to VISDB, LMF-1 and NR3C1 genes were also involved in HBV DNA integration events.
Viral genomic regions are integrated within the human whole exome
The HBV DNA integrations were then mapped into the viral genome. Most HBV DNA integrations (62.5%, 10/16) occurred between HBV nucleotide positions 1590 and 1840 corresponding to the viral genomic region spanning the direct repeat 2 (DR2) and direct repeat 1 (DR1) (figure 3B). This region contains the enhancer II, known to upregulate the expression of viral genes21 and corresponds to the C-terminus of hepatitis B X protein (HBx), the expression of which is associated with the onset of liver cancer.22 23 HBV integration events were also observed in the open reading frame preC/Core (ORF C) (in 3/16), ORF P (in 2/16) and in the ORF P genomic region overlapping with ORF S (in 1/16).
Two distinct HBV DNA integration events were detected in two patients. In patient no. 40, the viral genome regions encompassing the nucleotides 1665–1746 and 1951–2039 were both detected integrated in intron 1 of IFITM1 gene with a frequency of 4 and 5 integrations per 1000 hepatocytes (table 3). The viral genome regions including the nucleotides 1684–1775 and 2716–2769 were both detected integrated in intron 7 of ANKRD52 gene, with a frequency of 158 and 157 integrations per 1000 hepatocytes in patient no. 62 (table 3). The localisation in the same human gene with a superimposable burden supports the integration of a long portion of viral genome of at least 354 and 1085 nucleotides.
HBV DNA integration events correlate with serum HBsAg levels
Intrahepatic HBV markers were correlated with HBV DNA integration events and noted to be comparable in patients with or without evidence of HBV DNA integration within the whole exome (table 4). Conversely, among serum HBV markers, HBsAg was significantly higher in patients demonstrating integrated HBV DNA in the whole exome (3.9 (3.8–4.2)logIU/mL vs 3.2 (2.9–3.7)logIU/mL, p<0.001) (table 4). Furthermore, by AUROC, HBsAg >5000 IU/mL identified the occurrence of HBV integration in the whole exome with the best diagnostic accuracy (86.5%), 70.6% PPV and 94.7% NPV (figure 4). No correlation, however, was noted between the occurrence of HBV DNA integration and ALT or Ishak fibrosis stage. Moreover, no correlation was observed for patient’s age [34(26-39) years for those with HBV DNA integration vs 37 (30-43) years for patients without integration, p=0.16).
Correlation of intrahepatic and serological markers with the occurrence of HBV DNA integration
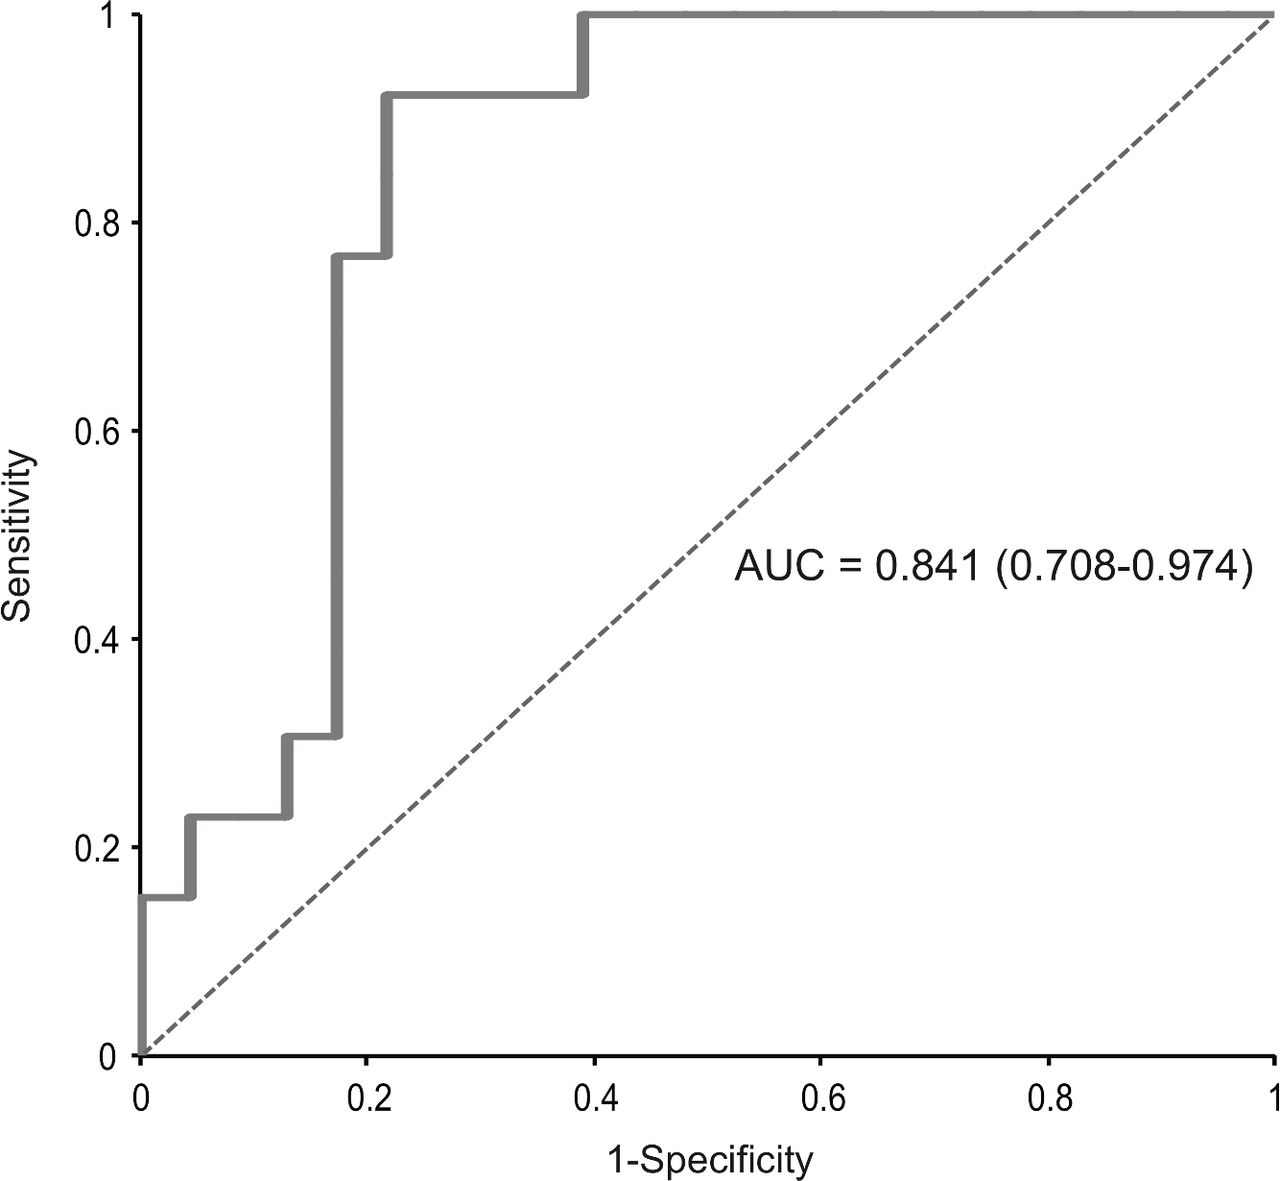
Area under receiver operating characteristics (AUROC) curve of hepatitis B surface antigen (HBsAg) levels and occurrence of HBV integration. HBsAg levels >5000 IU/mL were able to identify patients with HBV integration (n=14) with the best diagnostic accuracy (83.5%): positive predictive value=70.6%; negative predictive value=94.7%; area under the curve (AUC)=0.841 (0.768–0.974); sensitivity=92.3%; specificity=78.3%.
HBV DNA integration impacts the transcriptome profile of human hepatocytes
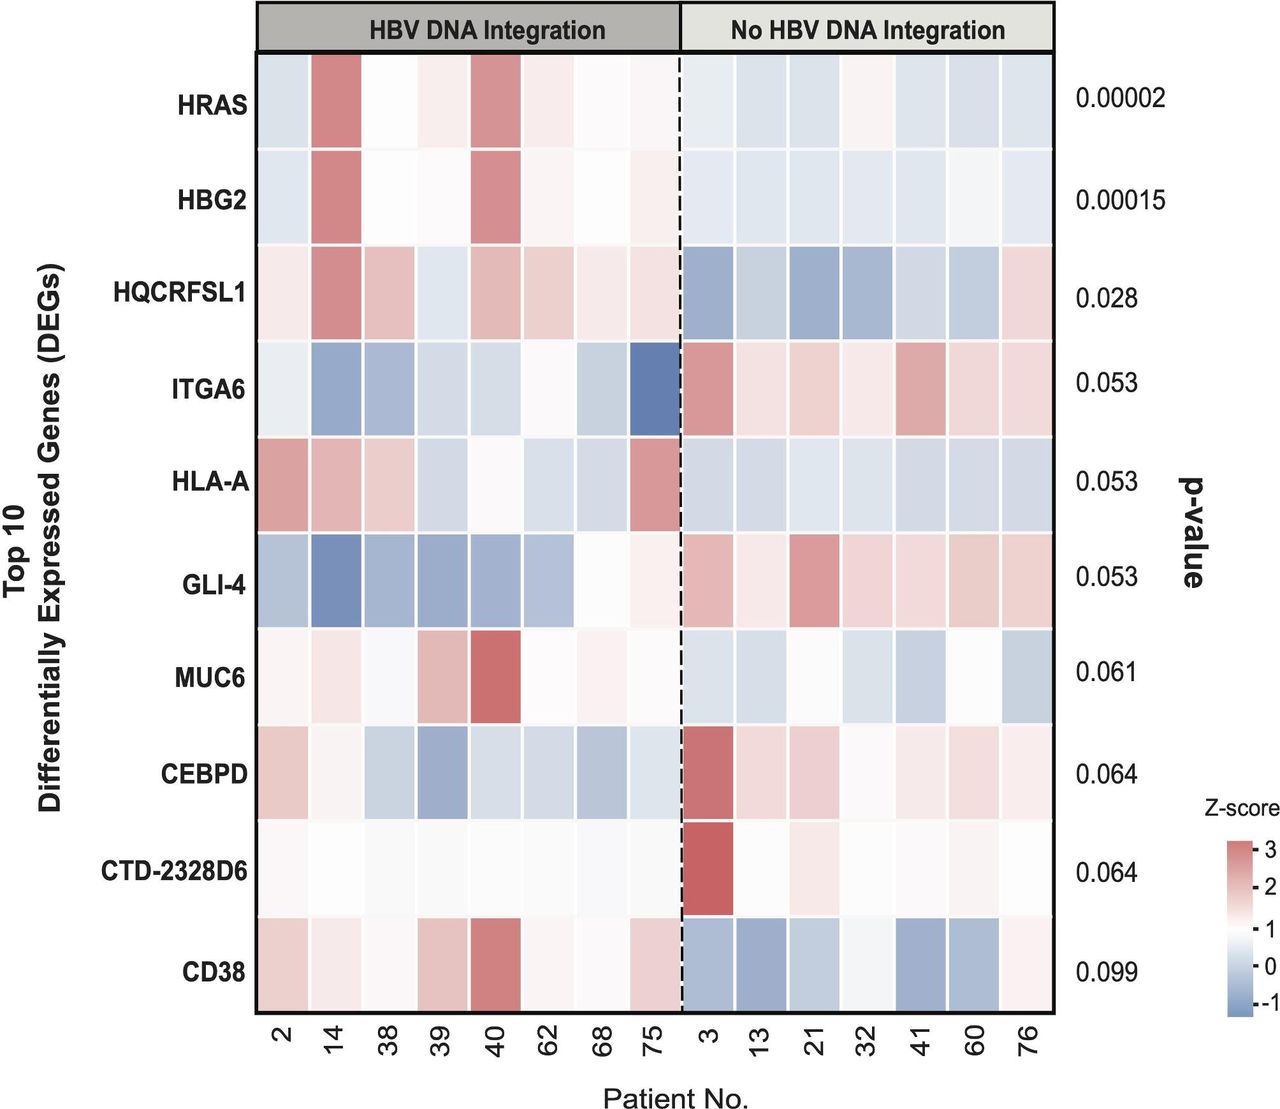
Cellular gene expression was evaluated in a subset of 15 out of 40 patients analysed for WES, where adequate tissue was available. These patients were stratified according to the presence (n=8) or absence (n=7) of HBV DNA integration as indicated in the heatmap (figure 5). A median (IQR) number of 55 (52–61) million paired end reads for each patient were obtained and a total of 52 268 expressed genes were analysed. Among them, hRAS (encoding the oncoprotein p21) and HGB2 (encoding fetal haemoglobin) were the only genes whose transcript levels were significantly higher in patients with HBV DNA integration than in patients with no HBV integrants (median (IQR): 255 (151–539) vs 32.1 (24.3–33.7) TPM, adjusted p=0.00002 for hRAS and 37.5 (20.1–115) vs 2.5 (0.9–3.1) TPM, adjusted p=0.00014 for HGB2, respectively). We then investigated the quantitated expression of cellular genes in those patients where there was evidence of HBV DNA integration by WES. In the patient with HBV DNA integration in the cellular gene ELAC2, its transcript levels were lower than those observed in patients without any HBV DNA integration (92 vs a median (IQR) value of 217 (186–232) TPM in those without HBV DNA integration, adjusted p=0.05).

Heatmap of the top 10 differentially expressed genes in the presence or absence of HBV DNA integration. The colour from red to blue refers to the z-score calculated for each gene in each patient according to the following formula: X−(mean X)/SD, where X stands for transcripts per million. The heatmap reports the top 10 genes with differential expression in patients with or without evidence of HBV DNA integration and their respective p values.
Similarly, in the patient with HBV DNA integration in ANKRD52, the transcript levels of this gene were lower than those observed in patients without any HBV DNA integration, although not reaching statistical significance (119 vs a median (IQR) value of 220 (155–243) TPM in those without HBV DNA integration, p=0.20). Conversely, in the patient with HBV DNA integration in the cellular gene IFITM1, the transcript levels were higher (111 vs a median (IQR) value of 42 (36–50) TPM in those without HBV DNA integration, p=0.02). Indeed, no further differences in transcript levels were observed for the other genes analysed in transcriptome analysis.
Discussion
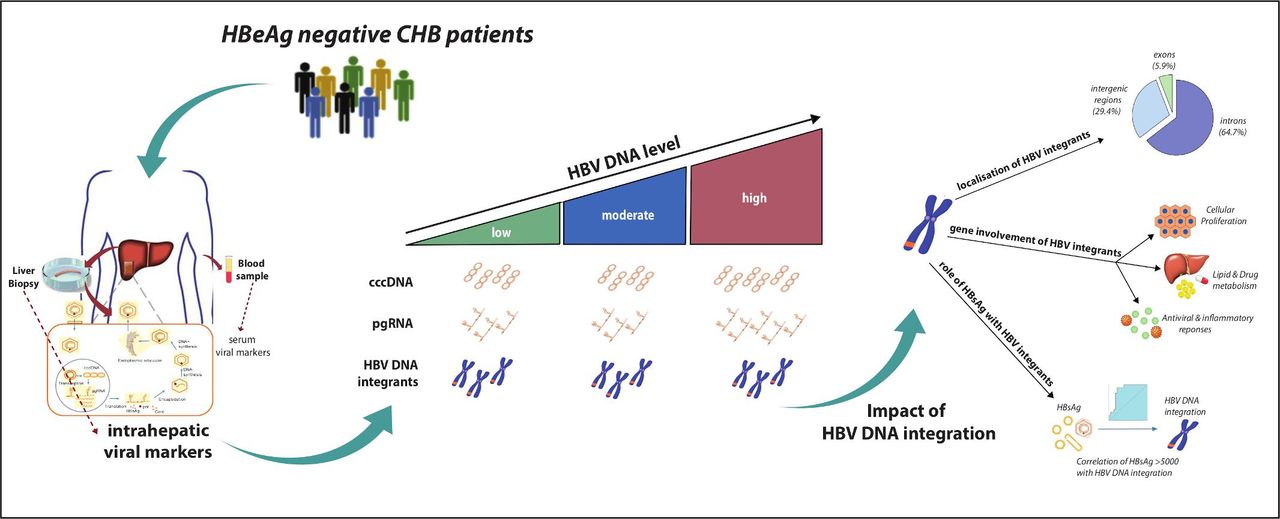
In this study, we provide an in-depth characterisation of the intrahepatic HBV reservoir and its impact on HBV DNA integration in HBeAg-negative patients with CHB. Our data show that patients with low-level and moderate-level HBV DNA were characterised by a comparable intrahepatic HBV reservoir in terms of total intrahepatic HBV DNA and cccDNA, which was significantly lower than that observed in patients with higher viraemia. This finding is in keeping with previous clinical studies showing that most patients in the so-called grey zone (serum HBV DNA ranging between 2000 and 20 000 IU/mL) tend to have a benign clinical outcome characterised by limited liver disease progression.24 25 Interestingly, despite comparable cccDNA levels, pgRNA is widely distributed between low and moderately viraemic patients, suggesting a stricter epigenetic control of cccDNA transcriptional activity with low levels of HBV DNA. Again, this corroborates previous clinical studies showing that a number of patients with serum HBV DNA from 2000 to 20 000 IU/mL (13% within 1 year according to a recent study24) progress to HBeAg-negative chronic hepatitis. Furthermore, our data show that HBcrAg along with serum HBV DNA and HBsAg can predict a limited intrahepatic HBV reservoir. This is consistent with recent data showing that in HBeAg-negative patients with CHB, HBcrAg can reflect the extent of cccDNA transcriptional activity.5 While this underlines the importance of incorporating serum HBV biomarkers into clinical practice for a more precise stratification of HBeAg-negative patients with CHB, less is known about the impact of the HBV reservoir on HBV DNA integration, which is an important factor to consider in disease progression and more specifically in the development of HCC figure 6.

Infographic summary highlighting the key points of the data.
Using WES coupled with ddPCR in this study, we provide the unique opportunity to finely unravel in HBeAg-negative patients with CHB, both the occurrence and burden of HBV DNA integration in the most relevant parts of the human genome. The whole exome represents the protein-coding regions composed of 180 000 exons where approximately 85% of genomic alterations associated with human genetic diseases are localised.26 27 Thus, HBV DNA integration in the whole exome has the highest probability to alter human gene expression and, in turn, to be of clinicopathological significance. Furthermore, recent studies found that tumour tissues were characterised by an irregular enrichment of HBV DNA integration events in coding/functional regions of the human genome, compared with non-tumour tissues, suggesting that HBV integration in these regions could confer a selective advantage during tumourigenesis.7 28
Our data show that HBV integration in the whole exome occurs in a notable proportion of patients with high HBV DNA (55.6%), and at significant levels in patients with low (25%) and moderate viraemia (14.3%), despite their limited HBV reservoir. By ddPCR, we found that HBV DNA integrations occurred with a prevalence ranging from 0.5 up to 158 events per 1000 hepatocytes, supporting a clonal expansion of hepatocytes harbouring these HBV DNA integrations. Notably, HBV DNA integration was detected in human genes such as NUP85, ANKRD52, ELAC2 and AGBL5 involved in the regulation of cell proliferation. It is conceivable that the enrichment of HBV DNA integration in these genes may enhance hepatocyte survival thus allowing persistence of an intrahepatic viral reservoir and long-term production of infectious progeny, as previously shown for other viral infections.29 30 At the same time, this may pose the basis for clonal selection of hepatocytes harbouring these HBV DNA integrations, contributing to the development of liver cancer. In line with this concept, the altered expression of the aforementioned genes has been associated with the onset or worse prognosis of HCC.16 31–34 Notably, by interrogating the publicly available database VISDB, we confirmed some of these genes were involved in HBV DNA integration events detected in tumour or peritumour liver samples in previous studies, supporting their role in hepatocarcinogenesis.
Most HBV DNA integrations were detected in exon-flanking intronic regions where signal sequences crucial for RNA splicing (such as the branching site) are localised. A plausible concept is that HBV DNA integration in these regions can affect the correct synthesis of mRNAs, thus altering cellular gene expression. In line with this hypothesis, among the genes noted, transcriptome analysis revealed a significantly lower expression of ELAC2 in the patient with HBV DNA integration within this gene. This result could be explained by the fact that HBV DNA integration resides within the so-called branching site, an intronic region crucial for the proper folding of RNA during the splicing process. By applying the ‘Human Splicing Finder’ (a consolidated and robust algorithm to predict the branching site within a given intron), we found that HBV DNA integration in ELAC2 determines a 3-nucleotide shift in the branching site of the intron involved in HBV integration and reduces stability of this domain.
Interestingly, recent studies have shown that an aberrant expression of ELAC2 plays a role in the neoplastic transformation of different cell types including hepatocytes.31 35
Analysing the whole transcriptome in patients according to the presence or absence of HBV DNA integration, a significant upregulation of the cellular genes hRAS and HBG2 (encoding fetal haemoglobin) was highlighted in those with HBV DNA integration. Both these genes are associated with increased cell proliferation,15 16 in addition, the upregulation of hRAS, a proto-oncogene, has been associated with neoplastic transformation in several human cancers.36 37 Furthermore, it has been demonstrated that the aberrant activation of cellular signalling processes such as Ras/Raf/MAPK.72 plays a pivotal role in HCC development.38 Similarly, a moderate-to-strong cytoplasmic positivity to fetal haemoglobin (usually not expressed in adults) was described in patients with HCCs.16 The increased expression of these genes could be favoured by genome instability, promoted by HBV DNA integration.11 39 This concept is in keeping with a recent study showing the capability of HBV DNA integration to act as bridge for interchromosomal translocations.40 hRAS upregulation can also be related to the overexpression of the viral protein HBx, whose ORF was found integrated in the vast majority of patients. Indeed, this is in line with previous data showing that an elevated HBx production can favour the cytoplasmic accumulation of p21 (encoded by hRAS), providing the basis for the neoplastic transformation of hepatocytes.41 Notably, an interesting case is patient 40, characterised by a co-localisation of integrated HBV DNA (within the gene encoding IFITM1) along with the differentially expressed genes HRAS, HBG2 and MUC6 in chromosome 11. In this patient, the variation in the expression levels of HRAS, HBG2 and MUC6 was particularly marked, further supporting the role of HBV DNA integration in altering transcriptome profiles. Finally, changes in transcriptome profiles were also observed in patients with HBV DNA integration in intergenic regions. This may be attributable to the potential of HBV DNA integrations to modify the accessibility of cell chromatin and/or to alter the production of regulatory RNAs, typically encoded by intergenic regions of human genome.42 Overall, these findings support the concept that HBeAg-negative CHB patients, even with low levels of HBV DNA, still carry a potential risk of neoplastic transformation of hepatocytes.
It is noteworthy that HBV DNA integration was also detected in genes regulating antiviral immunity and hepatocyte metabolism. In this regard, transcriptome analysis highlights a higher expression of the interferon-associated gene IFITM1 in the patient with HBV DNA integration involving this gene. Notably, by analysing the region of HBV genome integrated within IFITM1, we found that this event involves an HBV region enriched of promoters (nucleotides: 1665–1746), including the enhancer II, recognised by transcription factors critical in favouring gene expression. A plausible concept is that HBV DNA integration in the first intron of IFITM1 (upstream of the gene) can enhance the expression level of IFITM1, being responsible for the increased transcript levels observed in our study.
These findings shed new light on the potential impact of HBV DNA integration on cellular function. Thus, despite being a replicative dead-end product of HBV replication,8 HBV DNA integration can have multiple downstream effects on cell homeostasis, metabolism and the innate antiviral immune response. Regarding integrated portions of the HBV genome, as previously discussed, most HBV DNA integrations involved the HBV genomic region spanning DR1 and DR2; recognised as the recombination proficient region of HBV genome.43 This region also encodes the HBx C-terminus, of which the overexpression has been reported to induce stem cell-like properties,44 transformation and inhibition of apoptosis.45 This further supports the potential risk of neoplastic transformation of hepatocytes even in patients with low levels of HBV DNA. Notably, the integration of a long portion of viral genome of at least 354 and 1085 nucleotides was detected in two patients. This is consistent with recent data highlighting integrations are not restricted to partial regions, but also involve the full viral genome, further supporting the contribution of integrated HBV DNA to human genomic alterations.40
In conclusion, in HBeAg-negative CHB, HBV DNA integration in the whole exome occurs frequently in highly viraemic patients, and is observed in a considerable proportion of patients with low viraemia. Localisation of HBV integrations suggests that this event is not restricted to hepatocarcinogenesis and but can also be implicated in mechanisms regulating antiviral immunity, the inflammatory response and hepatocyte metabolism (figure 6). Our findings underline the clinical challenges associated with the management of HBeAg-negative CHB. In particular, the evidence of HBV integration in low viraemic patients with a limited HBV reservoir is a timely reminder that these patients who do not meet treatment criteria, remain at risk of disease progression and the development of liver cancer.
Acknowledgments
The authors are grateful for helpful discussions, advice and critical review of this manuscript from Professor William Mason (Fox Chase Cancer Center) and Dr Carla Usai (Blizard Institute, Barts and The London SMD, QMUL). The authors would also like to thank all patients, their families and the staff at The Royal London Hospital who have supported this work.
References
Supplementary materials
Supplementary Data
This web only file has been produced by the BMJ Publishing Group from an electronic file supplied by the author(s) and has not been edited for content.
Supplementary Data
This web only file has been produced by the BMJ Publishing Group from an electronic file supplied by the author(s) and has not been edited for content.
Footnotes
Twitter @druppygill, @drpkennedy
VS and RS contributed equally.
Correction notice This article has been corrected since it published Online First. Figure has been added.
Contributors Study concept and design: VS, PTFK. Acquisition of data: VS, RSa, LP, AB, LCo, RSc, USG. Analysis and Interpretation of data: VS, RSa, LP, AB, LCo, RSc, USG, PTFK. Mathematical and statistical analysis: VS, RSa, LCa. Obtained funding: VS, USG, PTFK. Administrative/technical/material/ethics support: VS, RSa, LCa, MS, VC, AN, NH, FC-S, CFP, USG, PTFK. Study supervision: VS, PTFK. Drafting of manuscript: VS, RSa, USG, PTFK. Critical revision of manuscript: VS, RSa, LP, LCa, AB, LCo, RSc, MS, VC, AN, NH, FC-S, CFP, USG, PTFK.
Funding This work was supported by funding from Italian Ministry of Instruction, University and Research (FIRB project: RBAP11YS7K_001), National Research Council (Progetto Bandiera PB05) to VS, A Wellcome Trust Clinical Research Training Fellowship (107389/Z/15/Z), NIHR Academic Clinical Lectureship (018/064/A), Academy of Medical Sciences Starter Grant (SGL021/1030) and Seedcorn funding Rosetrees/Stoneygate Trust (A2903) awarded to USG; Barts Charity Project Grants (723/1795 and MGU/0406) and an NIHR Research for patient benefit award (PB-PG-0614-34087) to PTFK.
Competing interests PTFK has collaborative grant funding from Gilead, participates in advisory boards/provides consultancy to Gilead, Janssen and is an investigator for industry-led trials with Gilead, Janssen, Alere, Assembly Biosciences, GSK and Roche.
Patient consent for publication Not required.
Ethics approval The study was approved by the local research ethics committee (Brent Research Ethics committee, reference: 09/H0717/32) and complied with the Declaration of Helsinki. All participants provided written informed consent.
Provenance and peer review Not commissioned; externally peer reviewed.
Data availability statement Data are available on reasonable request. All data relevant to the study are included in the article or uploaded as supplementary information. All clinical data have been collected in an anonymous database available at The Blizard Institute, Barts and The London SMD, QMUL. Responsible: PTFK
Supplemental material This content has been supplied by the author(s). It has not been vetted by BMJ Publishing Group Limited (BMJ) and may not have been peer-reviewed. Any opinions or recommendations discussed are solely those of the author(s) and are not endorsed by BMJ. BMJ disclaims all liability and responsibility arising from any reliance placed on the content. Where the content includes any translated material, BMJ does not warrant the accuracy and reliability of the translations (including but not limited to local regulations, clinical guidelines, terminology, drug names and drug dosages), and is not responsible for any error and/or omissions arising from translation and adaptation or otherwise.