Article Text

Abstract
Objective Liver stiffness measurement (LSM) is a tool used to screen for significant fibrosis and portal hypertension. The aim of this retrospective multicentre study was to develop an easy tool using LSM for clinical outcomes in advanced chronic liver disease (ACLD) patients.
Design This international multicentre cohort study included a derivation ACLD patient cohort with valid two-dimensional shear wave elastography (2D-SWE) results. Clinical and laboratory parameters at baseline and during follow-up were recorded. LSM by transient elastography (TE) was also recorded if available. The primary outcome was overall mortality. The secondary outcome was the development of first/further decompensation.
Results After screening 2148 patients (16 centres), 1827 patients (55 years, 62.4% men) were included in the 2D-SWE cohort, with median liver SWE (L-SWE) 11.8 kPa and a model for end stage liver disease (MELD) score of 8. Combination of MELD score and L-SWE predict independently of mortality (AUC 0.8). L-SWE cut-off at ≥20 kPa combined with MELD ≥10 could stratify the risk of mortality and first/further decompensation in ACLD patients. The 2-year mortality and decompensation rates were 36.9% and 61.8%, respectively, in the 305 (18.3%) high-risk patients (with L-SWE ≥20 kPa and MELD ≥10), while in the 944 (56.6%) low-risk patients, these were 1.1% and 3.5%, respectively. Importantly, this M10LS20 algorithm was validated by TE-based LSM and in an additional cohort of 119 patients with valid point shear SWE-LSM.
Conclusion The M10LS20 algorithm allows risk stratification of patients with ACLD. Patients with L-SWE ≥20 kPa and MELD ≥10 should be followed closely and receive intensified care, while patients with low risk may be managed at longer intervals.
- liver cirrhosis
- clinical decision making
- chronic liver disease
- liver failure
- portal hypertension
This is an open access article distributed in accordance with the Creative Commons Attribution Non Commercial (CC BY-NC 4.0) license, which permits others to distribute, remix, adapt, build upon this work non-commercially, and license their derivative works on different terms, provided the original work is properly cited, appropriate credit is given, any changes made indicated, and the use is non-commercial. See: http://creativecommons.org/licenses/by-nc/4.0/.
Statistics from Altmetric.com
Significance of this study
What is already known on this subject?
To date, the existing tools to stratify liver disease patients into different risks for clinical outcomes, such as the model for end-stage liver disease (MELD), may fail to predict the outcome, especially in well-compensated patients.
The value of liver shear wave elastography (L- SWE) has only been established in the classification of liver fibrosis and clinically significant portal hypertension.
No studies have assessed the prognostic value of SWE for different etiologies and stages of liver disease.
What are the new findings?
This international multicenter cohort study provides an efficient and easy algorithm (M10LS20 algorithm) for risk stratification of advanced chronic liver disease (ACLD) with the combination of MELD with liver stiffness measured by shear wave elastography (SWE).
The combined MELD 10 and liver-SWE (L-SWE) 20kPa cutoff (M10LS20) algorithm was confirmed in compensated and decompensated patients and was validated by TE measurements. It was externally validated in an addtional cohort of patients with point SWE.
This M10LS20 algorithm provides early identification of at-risk patients and allows for early treatment, filling the gap in the risk stratification for complications and mortality in patients with ACLD.
Significance of this study
How might it impact on clinical practice in the foreseeable future?
This study provides a straightforward algorithm for bed-side stratification of patients with ACLD based on MELD and L-SWE.
Patients with L-SWE ≥20kPa combined with MELD ≥10 should be followed closely and receive more intensified care, while patients with low risk may be managed at longer intervals.
The M10LS20 algorithm supports clinicians in identifying populations at low-risk for complications as well as mortality, possibly enabling sparing of health care resources.
Background
Advanced chronic liver disease (ACLD) is associated with high mortality due to decompensations, which are consequences of liver failure and portal hypertension.1 In these patients, predictors of outcomes are needed to stratify care and to allocate specific therapy and liver transplantation. The model for end-stage liver disease (MELD) is widely used to predict the prognosis of liver cirrhosis patients.2–5 An MELD score above 15 is usually an indication of evaluation for liver transplantation. However, since the MELD score was originally designed to predict 90-day mortality after transjugular intrahepatic portosystemic shunt, it may fail to predict the outcome, especially in patients with compensated cirrhosis, who have a lower MELD score.6
Liver stiffness measurement (LSM) by transient elastography (TE), point shear wave elastography (p-SWE) or two-dimensional SWE (2D-SWE) is an established non-invasive technique to assess significant fibrosis in patients with chronic liver disease.7–13 Moreover, it has proven to be a useful surrogate marker to diagnose clinically significant portal hypertension,14 mostly shown for TE and recently for liver SWE (L-SWE).15 Ideally, short-term and long-term risk of decompensation and mortality should be predicted to plan patient management. Also, decompensated patients with ascites may have a different natural course of disease.16 Some patients may improve and not require intensified care. Since LSM not only reflects fibrosis or portal hypertension but also inflammation,3 11 and given that inflammation is a marker of disease progression, LSM could be used as a predictive tool for outcomes in decompensated patients.16–18 While LSM has been used previously to predict clinical decompensation and death in patients with compensated ACLD, data in decompensated patients are lacking. This is mostly due to TE’s technical limitations, which cannot be applied to patients with ascites. L-SWE is not affected by ascites and can be applied to evaluate LSM similar to TE,12 19 20 and it has the additional benefit of using ultrasound for HCC screening and portal vein evaluation (one-stop-shop examination).21 22
Therefore, the aim of this multicentre observational study was to provide a simple algorithm using L-SWE for risk stratification of all patients with ACLD, including decompensated patients with ascites.
Method and patients
Study design and participants
We established a derivation cohort from a multicentre international study conducted in 16 centres, 14 of which are located in Europe, and two in China. Patients aged over 18 years, with suspected or confirmed chronic liver disease of viral and/or steatotic origin, requiring percutaneous liver biopsy, or who had received a liver ultrasound at baseline, were screened from July 2007 to September 2017. Inclusion criteria were presence of ACLD of any aetiology as defined in the Baveno VI concensus,14 valid LSM measured by 2D-SWE at baseline, and at least 28 days of follow-up of outcome after the index L-SWE measurement. All of the enrolled patients received standard treatment according to the respective hospital protocols. The flow chart of patient enrolment is depicted in online supplemental figure 1. Some patients of this cohort were included in another, recently published study.23 The number of patients from each participating centre as well as intercentre and interobserver reliability are shown in online supplemental tables 1 and 2. In centres where L-SWE is not the standard of care, patients signed written informed consent. The study has been registered in ClinicalTrials.gov as NCT03389152.
Supplemental material
Clinical and laboratory parameters were assessed at baseline. These included demographic data, aetiologies, clinical decompensations (hepatic encephalopathy, ascites, variceal bleeding, hepatorenal syndrome, spontaneous bacterial peritonitis and/or other infections), routine blood tests, liver, kidney and coagulation function parameters and mean values of the various elastography measurements. Definitions of the non-invasive scores including fibrosis-4 index (FIB-4), aspartate aminotransferase to platelet count ratio index (APRI) and albumin-bilirubin score (ALBI) at baseline were shown in online supplemental methods.
2D-SWE and TE procedure and additional cohort of p-SWE
L-SWE measurements were conducted according to the European Federation of Societies for Ultrasound in Medicine and Biology.24 One-dimension TE was measured using Fibroscan (Echosens, Paris, France). TE measurements were performed at baseline as per EASL-ALEH clinical practice guideline.3 20 Details of the procedure for 2D-SWE and TE in derivation cohort are summarised in online supplemental methods.
An additional cohort from the Medical University of Vienna undergoing LSM by p-SWE was included (online supplemental figure 1). The same clinical data were obtained from 121 patients from September 2017 to January 2020, and 119 patients were finally included into analysis. The protocol for pSWE of the liver utilising the Elast PQ module on the Philips system was previously described25 26 and is found in online supplemental methods.
Outcome evaluation
After L-SWE measurement, the study patients were regularly followed for at least 28 days. The primary outcome was all-cause mortality of the patients in the cohort with 2D-SWE, and mortality or liver transplantation in the cohort with p-SWE. Development or worsening of complications and decompensations were assessed and recorded during follow-up and were set as the secondary outcome. Hepatic encephalopathy was assessed and scored according to West Haven criteria in the follow-up hospital admission.27 Worsening of ascites was recorded by physical examination and abdominal ultrasound. Episodes of variceal bleeding, hepatorenal syndrome and bacterial infections were assessed and recorded during follow-up and compared with baseline decompensation.
Statistical analysis
Data were presented as median with IQR or number with percentage. Mann-Whitney test or χ2 test was used for intergroup comparison where appropriate. We followed the Transparent Reporting of a Multivariable Prediction Model for Individual Prognosis or Diagnosis statement for multivariate prediction model development and validation. Univariate and multivariate Cox proportional hazard regression analyses were performed to identify independent predictors of survival. We evaluated all potential risk factors in our regression analysis from a literature review, and the variables included are shown in online supplemental table 3. Patients with missing data or lost to follow-up were excluded in the corresponding analysis (online supplemental table 4). The cumulative incidence curve for secondary outcome of decompensations were plotted and compared using Gray’s test with death as the competing event.
For the selection of cut-off values, we evaluated the receiver’s operating characteristics (ROC) of vital status at 2 years, and the highest Youden index was determined. Sensitivity, specificity, positive predictive value and negative predictive value (NPV) were calculated together with 95% CI of each cut-off value. Model performance was assessed in the 2D-SWE and the additional p-SWE cohorts. Discrimination parameters, including the time-dependent area under the ROC (AUROC) curve, integrated AUROC and Uno’s C statistic, were evaluated and compared. Calibration was assessed using 10-fold cross-validation with 200 times of bootstrapping.
A p<0.05 was considered statistically significant. All statistical analyses were performed with SPSS V.25.0 (SPSS), R (V.4.0, R core team, Austria), and SAS V.9.4 (SAS Institute).
Results
General characteristics of compensated and decompensated patients
A total of 2148 patients from 16 centres were screened in the derivation cohort with 2D-SWE, 2032 of whom had valid L-SWE assessment at baseline. Eventually, 1827 patients with at least 28 days of follow-up were included in the study (online supplemental figure 1). The median follow-up was 33.1 (IQR 16.7–48.8) months. Baseline characteristics and follow-up measurements of all patients enrolled are summarised in table 1. Patient age was 55 years in median (IQR: 45.9–62.7), and the majority were male (62%). Of the enrolled patients, alcohol-related chronic liver disease accounted for 26.8% of cases, followed by non-alcoholic fatty liver disease (NAFLD) (25.2%) and hepatitis C virus-related (HCV) liver disease (17.3%, of which 16.8% sustained virological response patients). The median MELD score of all patients was 8 (IQR: 6–10), and the Child-Pugh score was 5 (IQR: 5–6). Patients included in the study had a median L-SWE value of 11.8 kPa (IQR: 7.4–24.5) (online supplemental figure 2). The haemodynamic baseline data of a subgroup of the patients is shown in online supplemental table 5.
Baseline characteristics of the derivation cohort
Of the 1490 (81.6%) patients who were compensated at baseline, 174 (11.7%) decompensated during follow-up. Of the 337 (28.4%) patients who were decompensated at baseline, 106 (31.5%) developed further episodes of decompensations during follow-up as defined elsewhere.16 The decompensated patients (at baseline) had significantly higher L-SWE (median 30.3 kPa vs 9.7 kPa, p<0.001) and TE (median 23.4 kPa vs 8.3 kPa, p=0.017) value at baseline than the compensated patients.
L-SWE measurement is an independent risk factor of long-term mortality
Considering all patients with valid L-SWE measurements and follow-up data, the overall 28-day, 90-day, 1-year and 2-year mortality rates were 0.4%, 1.1%, 2.9% and 7.8%, respectively. As shown by the univariate and multivariate Cox regression models in online supplemental table 6, the LSM value with L-SWE was independently associated with long-term mortality in compensated patients (2-year HR: 1. 019, 95% CI 1.010 to 1.028, p<0.001) and all patients included (2-year HR: 1.019, 95% CI 1.008 to 1.030, p=0.001). If adjusted by MELD score, L-SWE remained an independent risk factor for 28-day, 90-day and 2-year mortality (table 2). L-SWE was also shown to be an independent risk factor in decompensated patients, in short-term as well as long-term follow-up (online supplemental tables 6 and 7).
Univariate and multivariate analysis of swe with outcome of death after adjustment for platelet count, age and MELD score
Model performance of L-SWE in combination with MELD score and best cut-off values
Online supplemental figure 3 shows the highest AUC of L-SWE combined with MELD score and compared with ALBI, FIB4 and APRI score. Figure 1 and online supplemental figure 4A show the model performance of L-SWE combined with MELD score. Among compensated patients, the MELD score combined with L-SWE (integrated AUC: 0.81) had a better time-dependent AUC than the MELD score alone (integrated AUC:0.73), especially in long-term follow-up. Interestingly, the c-index of the combined model (0.825) is significantly higher than that of the MELD and the Child-Pugh score (p=0.0329 and p<0.0001, respectively). Similar results were obtained in all of the included patients. The combined model was well calibrated, as shown in online supplemental figure 4B.

(A) Time-dependent area under the curve and 95% CI of the combined algorithm based on MELD score and SEW, and MELD score alone in compensated patients only during 2 years of follow-up. (B) Time-dependent area under the curve and 95% CI of the combined model of MELD score and swe, and MELD score alone in all patients (including decompensated patients at baseline) of the cohort with 2D-SWE during 2 years of follow-up. 2D-SWE, 2-dimensional shear wave elastography; AUC, area under the curve; MELD, the model for end-stage liver disease.
To further stratify the 2-year risk of mortality, the best cut-off value of 10 points for the MELD score and best cut-off value of 20 kPa for L-SWE was found with the highest Youden index in compensated patients and all patients (online supplemental tables 8–10). Moreover, in the group with an MELD score <10 and those with an MELD score ≥10, significant differences (log-rank p<0.001) were found between patients with L-SWE measurements above and below 20 kPa over 2 years in Kaplan-Meier curves (online supplemental figure 4C,D).
Stratification M10LS20 algorithm with L-SWE and MELD score in compensated and decompensated patients
With the two cut-off values found for the MELD score and L-SWE, respectively, the algorithm (M10LS20) of a combination of L-SWE value and MELD score could easily stratify the patients into three different risks group, namely (1) patients with L-SWE measurements <20 kPa and an MELD score <10 (good prognosis group, 56.7%), (2) patients with L-SWE measurements ≥20 kPa and an MELD score ≥10 (poor prognosis group, 25.0%) and (3) the remaining patients (intermediate prognosis group, 18.3%). According to the Kaplan-Meier curve in figure 2A, the three groups have significantly different survival rates (p<0.001) both at short-term (90 days) and long-term follow-up (2 years) in compensated patients. The significant survival differences were also found in decompensated patients and in all patients (figure 2B and C). Interestingly, the density curve of time distribution of mortality shown in online supplemental figure 5A confirms that the algorithm identifies groups with different median survival time. The mean time to death was 11 months in the poor prognosis group, while it was 16 months in the good prognosis group.
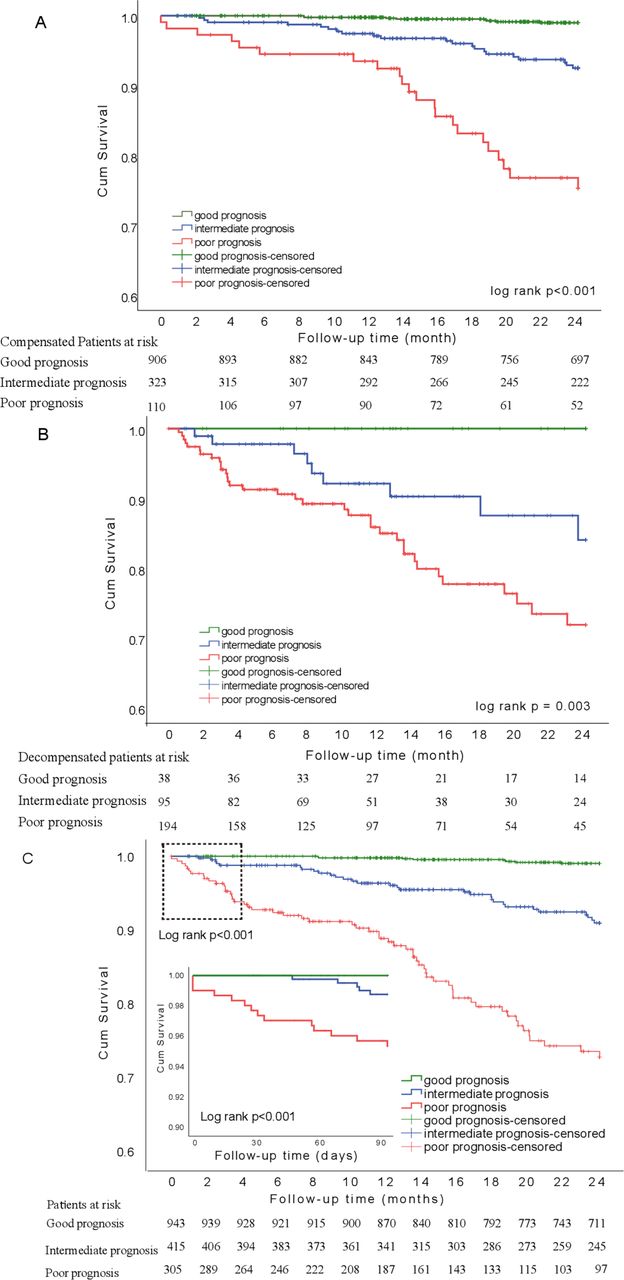
Curves of patients with good, intermediate and poor prognosis. (A) Kaplan-Meier of 2-year survival curve in compensated patients. Level of significance: log-rank p<0.001. (B) Kaplan-Meier of 2 years survival curve in decompensated patients. Level of significance: log-rank p=0.003.(C) Kaplan-Meier of 2-year and 90-day survival curve of all patients of the cohort with 2D-SWE measurements. The top left rectangle in the curve of 2 years survival indicates the area of the Kaplan-Meier curve of 90-day survival depicted in the bottom left panel. Level of significance: log-rank p<0.001. 2D-SWE, 2-dimensional shear wave elastography.
Predictive value of L-SWE combined with MELD score for first or further decompensation
As expected, the three groups showed significantly different median baseline L-SWE values of 8.2 kPa, 21.1 kPa and 36.0 kPa (p<0.001) in the good prognosis, the intermediate prognosis, and the poor prognosis group (online supplemental figure 5B), respectively. Of the 1827 study patients, 182 patients developed new episodes of decompensations or worsening of ascites or HE during the 2-year follow-up period.
Among the patients without decompensation, the model of L-SWE and MELD score had the best AUROC in the prediction of decompensation development during the follow-up, compared with the MELD score and the Child-Pugh score (online supplemental figure 6A).
When considering death as a competing risk factor for developing or worsening of decompensation, L-SWE value at baseline appeared to be a statistically significant independent risk factor in the outcome of developing decompensation, after adjustment for age, MELD score, and Child-Pugh score at baseline (HR 1.020 (95% CI 1.014 to 1.026), p=0.001) (online supplemental table 11). Moreover, in the patient groups with an MELD score< or ≥ 10 points, L-SWE (cutoff ≥20 kPa) could best stratify the cumulative incidence of decompensation for up to 2 years (Gray’s test p<0.001) (online supplemental figure 6B,C).
Using the M10LS20 algorithm, we could also stratify the patients into three risk groups for risk of decompensation: (1) good prognosis, (2) intermediate prognosis and (3) poor prognosis. Of the compensated patients, the group with poor prognosis had the highest incidence of development of decompensation (figure 3A). The cumulative incidence curves with Gray’s test also showed significant differences in the development or worsening of ascites (p<0.001) and hepatic encephalopathy (p<0.001) in these three risk groups (online supplemental figure 7A,B). Nevertheless, in decompensated patients, significant differences were also found in the risk of worsening of decompensation in these three groups (Gray’s test p=0.0025) (figure 3B). In the whole cohort, a similar effect was confirmed (figure 3C).
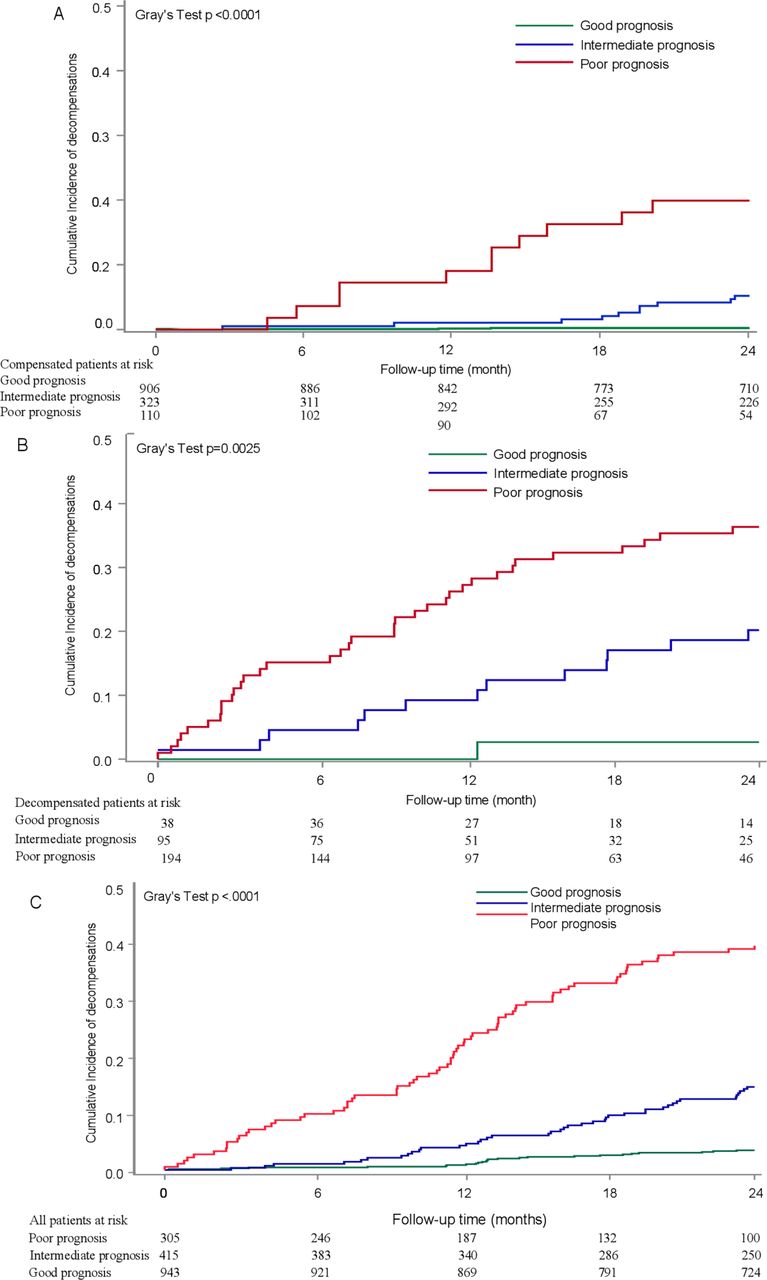
(A) Cumulative incidence of development of decompensations within 2 years of patients with good, intermediate and poor prognosis in compensated patients. Level of significance: Gray’s test p<0.0001. (B) Cumulative incidence of development of further episodes of decompensation within 2 years of decompensated patients with good, intermediate and poor prognosis. Level of significance: Gray’s test p=0.0025. (C) Cumulative incidence of development of decompensations within 2 years of all patients included in the cohort with 2D-SWE measurements with good, intermediate and poor prognosis. Level of significance: Gray’s test p<0.0001. 2D-SWE, 2-dimensional shear wave elastography.
Validation of the stratification M10LS20 algorithm using p-SWE
The baseline characteristics of the add groups with p-SWE are shown in online supplemental table 12). Patients in the additional cohort had higher L-SWE measured by pSWE than the 2D-SWE derivation cohort and had a higher MELD score. The pSWE combined with the MELD score model well calibrated in the additional cohort (online supplemental figure 8A) and had an integrated time-dependent AUC of 0.8407 (figure 4A and online supplemental figure 8B).

(A) Time-dependent area under the curve and 95% CI of the combined model of MELD score and p-SWE in the additional cohort validated for p-SWE during 2 years of follow-up. (B) Two-year Kaplan-Meier curves of the additional cohort validated for p-SWE of patients classified with good, intermediate and poor prognosis. Level of significance: log-rank p<0.032. (C) Cumulative incidence of development of decompensations within 2 years of all patients included in the additional cohort validated for p-SWE with good, intermediate and poor prognosis. Level of significance: Gray’s test p=0.0025. AUC, area under the curve; MELD, model for end-stage liver disease; p-SWE, point shear wave elastography.
The validity of the M10LS20 algorithm using p-SWE technology was confirmed by a significant survival difference in the three prognosis groups in the additional cohort, with a log-rank p of 0.032 (figure 4B). When considering death as a competing risk for decompensation, the cumulative incidence of development or worsening of decompensation also showed significant differences in these three groups (figure 4C). Interestingly, a similar decision tree could be established in the additional cohorts, stratifying the ACLD patients into three distinct prognosis groups (online supplemental figure 9).
Internal validation of the stratification M10LS20 algorithm in compensated and decompensated patients
For internal validation of our stratification algorithm in both compensated and decompensated patients, the combined cohorts of 2D-SWE and p-SWE were randomly divided into a 2/3 internal derivation cohort and a 1/3 internal validation cohort. This was performed for both compensated patients and decompensated patients. The baseline characteristics of both cohorts are listed in online supplemental tables 13 and 14).
Regardless whether compensated (log rank p<0.001) or decompensated (log rank p=0.042) were considered, significantly different survival functions were detected in the three different risk groups from the derivation cohorts. The strategy was subsequently validated in the 1/3 internal validation cohort, showing a significant risk of mortality within 2 years (log rank p<0.001 and p=0.038 in compensated and decompensated patients, respectively) (online supplemental figures 10 and 11).
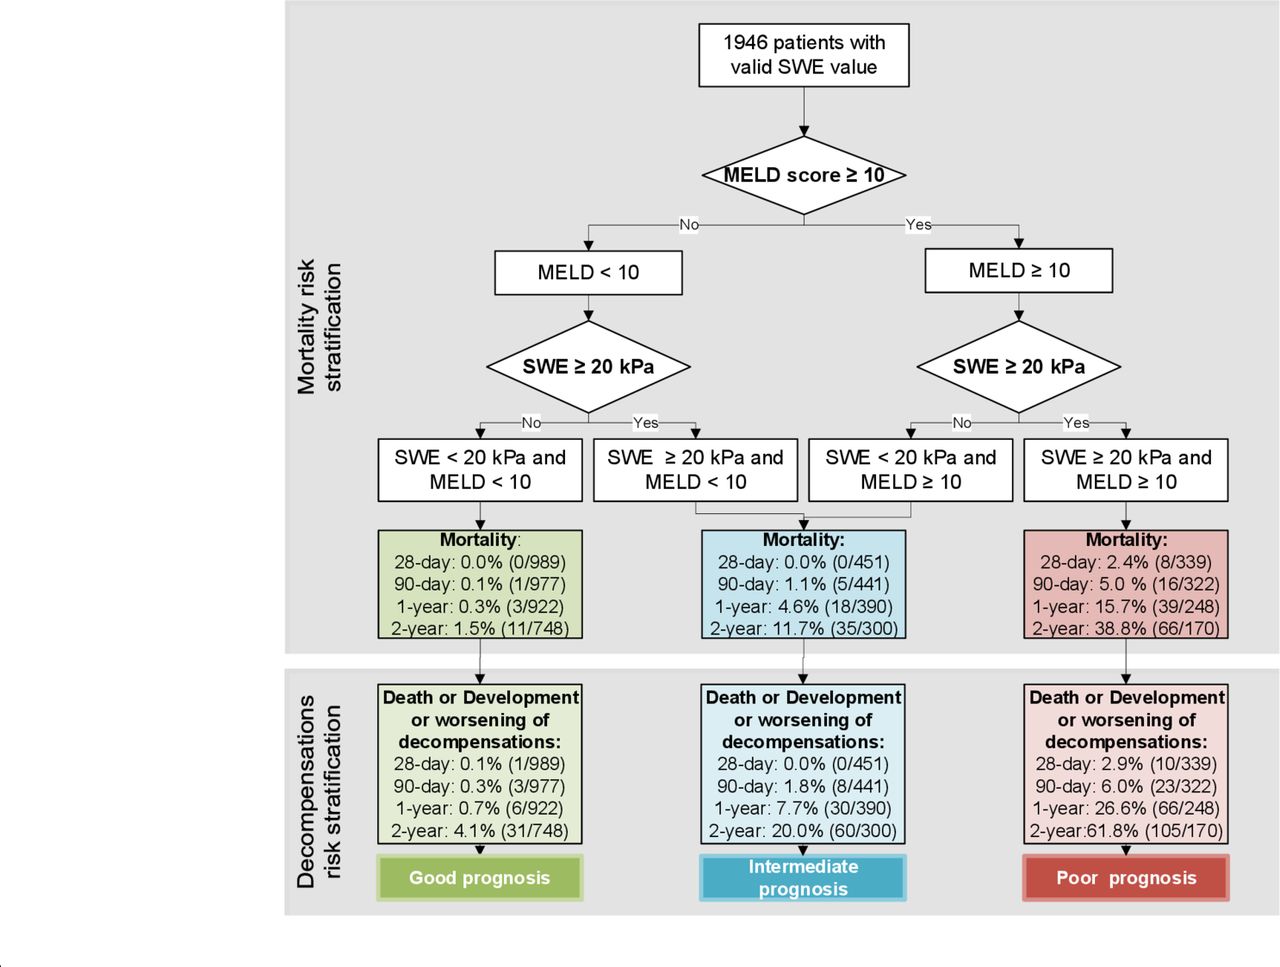
The decision tree (figure 5) shows the strategy (M10LS20 algorithm) used for mortality risk prediction stratification in the combined cohort of cohorts with 2D-SWE and the additional cohort with pSWE. It can also be applied for decompensation, evidenced by the significantly different incidences of decompensation in these three risk groups (3.5%, 18.8% and 61.8% within 2 years, respectively).
Stratification model of cohort with 2D-SWE and additional cohort with p-SWE for prediction of estimated mortality (upper panel) at 28 and 90 days as well as at one and 2 years of follow-up based on MELD score <10 vs ≥10 and L-SWE <20 vs ≥20 kPa; stratification model of cohort with 2D-SWE and additional cohort with p-SWE for prediction of first/further decompensation risk (lower panel) at 28 and 90 days as well as at one and 2 years of follow-up based on MELD score <10 vs ≥10 and L-SWE <20 vs ≥20 kPa. 2D-SWE, 2-dimensional shear wave elastography’ L-SWE, liver SWE; MELD, model for end stage liver disease; p-SWE, point SWE.
Validation of the stratification M10LS20 algorithm using TE and MELD score
Of the patients included in the cohort with 2D-SWE, 754 patients had LSM by TE at baseline. The median TE value was 8.3 kPa. As expected, decompensated patients had a significantly higher TE value than compensated patients (23.4 kPa vs8.3 kPa, p=0.017).
In the multivariate analysis adjusted by the MELD score, liver stiffness proved to be an independent risk factor predicting 2-year mortality (online supplemental table 15). TE could equally predict the long-term risk of death compared with SWE, as shown by similar time-dependent ROC (online supplemental figure 12A). Performance of the model of TE combined with the MELD score was also similar to 2D-SWE combined with the MELD score (online supplemental figure 12B).
The same algorithm of M10LS20 was applied in patients with TE measurement and MELD score, using the same cut-off of 20 kPa for TE. As depicted in online supplemental figure 9), the cut-off of 20 kPa could also stratify patients with the distinct outcome of death in patients with an MELD score above as well as an MELD score below ten points. In fact, using the same algorithm and cutoffs, three distinct groups with significantly different mortality risks could be identified (online supplemental figure 13).
Aetiological sensitivity, regional sensitivity and time-period sensitivity analysis of the stratification M10LS20 algorithm
Interestingly, the M10LS20 algorithm was confirmed in all patients with different aetiologies. As shown in online supplemental figure 14), patients with good prognosis, intermediate prognosis and poor prognosis had significantly different survival probability, regardless of aetiology as analysed separately for alcoholic-related liver disease, HCV, hepatitis B virus (HBV) and NAFLD.
When we divided the cohort with 2D-SWE into patients from Southern Europe and Northern Europe, the model still showed the highest AUROC (online supplemental figure 15A,B). Patients from Southern Europe as well as Northern Europe could be adequately stratified by the M10LS20 algorithm (online supplemental figure 15C,D).
Since our derivation cohort of 2D-SWE and the additional cohort with p-SWE were included from 2007 to 2020, we divided our cohorts into three subgroups according to different time periods of inclusion (online supplemental figure 16). The M10LS20 algorithm performed equally well regardless of the time period of inclusion, as demonstrated by the significantly different survival curves in the three stratified risk groups. Furthermore, patients with second follow-up L-SWE measurements were analysed. As shown in online supplemental figure 17), the majority of patients with good prognosis and poor prognosis remained within the same stratification group when using the M10LS20 algorithm during the follow-up. Similar results were also found in the intermediate group.
Discussion
This international multicentre cohort study establishes and validates that the combination of MELD score with LSM measured by SWE (M10LS20 algorithm) is an accurate and easy tool for stratification of ACLD. In the study, mortality and risk of decompensation in patients with L-SWE measurements below 20 kPa and an MELD score below 10 were 1.1% and 3.5%, respectively, while patients with L-SWE measurements above 20 kPa and an MELD score above 10 had a very high risk of mortality and decompensation (36.9% and 61.8%, respectively).
Patients with ACLD represent a large and heterogeneous population with various aetiologies, such as alcoholic-related liver disease, NAFLD, chronic viral hepatitis and autoimmune liver disease. Many patients deteriorate rapidly due to severe complications and decompensating episodes and may die within a short period of time. However, even patients with ascites can recompensate and show a very low rate of further decompensation.16 Therefore, in addition to clinical history, an accurate and practical tool to assess and predict short-term and long-term outcome in patients with high heterogeneity is urgently required. Such a tool can greatly help clinicians to stratify treatment options and reduce waste of medical resources. To identify such a tool for prediction of outcome, the mechanism leading to decompensations and death must first be identified. There is abundant evidence that advanced fibrosis is associated with progression towards decompensations in ACLD.28–30 Moreover, portal hypertension is a driver of decompensation and death.31 32 Finally, systemic inflammation has been identified in multiple studies as a major cause of decompensation, acute-on-chronic liver failure and death.16 33 Of note, systemic inflammation can already be present in the early stages of ACLD.18 34 Interestingly, hepatic fibrosis and inflammation are major components of liver stiffness.3 11 19 35 Although LSM by TE is currently the most widely used method, it has the limitation of a high failure rate mostly due to obesity or ascites.12 36 Our data suggest that L-SWE is useful in this complex setting. Moreover, the algorithm we established for L-SWE was also confirmed with LSM performed by TE in our study.
Additional prognostic factors in cirrhosis include the severity of liver failure and extrahepatic organ failure (eg, kidney and coagulation failure).37 38 These markers are reflected in the MELD score.2 To date, no easy algorithm has been available to stratify the risk of decompensation and mortality. Patients with an MELD score below 15 are the most heterogeneous in terms of clinical evolution and are especially at risk of being overlooked since 15 points is the cut-off value for putting forward the indication for liver transplantation.39
Our data show that LSM by 2D-SWE measurement is an independent risk predictor of death and has a high accuracy in predicting 2-year mortality. We could show that a combination of L-SWE and MELD score has the highest AUROC, superior to L-SWE alone, MELD score and Child-Pugh score. Thus, a combination of L-SWE and MELD score is an accurate tool to stratify patients with a high risk of death within 2 years. Furthermore, increased L-SWE measurements correlated with the development or further episodes of decompensation. Importantly, this large-scale multicentre study enabled the identification of an easy-to-memorise cut-off value of 10 for the MELD score and 20 kPa for L-SWE to classify heterogeneous ACLD patients into three groups with completely distinct risks of mortality. Interestingly, this cut-off value is identical to the one provided by several studies on the diagnosis of clinically significant portal hypertension.7 11 40 The extremely high NPV (98%) indicates that this cut-off value can help clinicians exclude low-risk populations, emphasising its potential role in saving clinical resources.
A further important finding of this study is that L-SWE had predictive value for the development or worsening of decompensation, which has been missing to date. Especially in patients with ascites, which defines decompensation, this algorithm is very useful.41 Our findings are in agreement with previous data suggesting that values of LSM indicating the presence of clinically significant portal hypertension (a major factor driving decompensation in cirrhosis13 42 predict clinical decompensation. We confirm that this holds true across different aetiologies and stages of disease. Thus, the present study may fill the knowledge gap of the usefulness of L-SWE in the prediction of complications. From a practical point of view, routine use of L-SWE could provide early identification of patients at risk of poor outcomes, thus helping to tailor treatment options. Since non-selective beta-blockers have recently been shown to be effective in reducing clinical decompensation in patients with compensated cirrhosis and clinically significant portal hypertension irrespective of the size of varices,43 L-SWE may be used to non-invasively select patients who could benefit from this treatment.
Of note, the M10LS20 algorithm was found to be accurate not only in compensated but also in decompensated patients. We further validated this innovative algorithm in an additional cohort with LSM measured by pSWE and confirmed the robustness and wide range of its application. The sensitivity analysis was also done in heterogeneous aetiologies and by different participating centres from various regions worldwide. Interestingly, there was no impact of aetiology on the performance and applicability of our algorithm. The M10LS20 algorithm was found to be robust for any aetiology, including alcohol-related liver diseases, chronic hepatitis C, chronic hepatitis B and non-alcoholic fatty liver disease. Hence, it has been demonstrated that the M10LS20 algorithm is appropriate for universal use and can be easily applied in daily clinical practice. This easy algorithm may affect the time interval for outpatient follow-up treatment in patients. Thus, patients with poor prognosis and at high risk of mortality should be seen more frequently (eg, every 2–3 months), while in patients with intermediate risk the frequency of visits could be lower (eg, every 3–6 months), and patients with good prognosis are only to be seen every 6–8 months. Especially in times when person-to-person contact must be reduced, for example, during a pandemic, this algorithm can be applied successfully.44 As a result, patients with chronic liver diseases would follow a more individualised clinical path after elastography evaluation and liver-related risk evaluation using the MELD score.
Despite the fact that our study is a large international multicentre study, it has several limitations. First, it is an observational study and, although the standard procedure of L-SWE measurement was followed in the centres, the size of the region of interest of L-SWE was freely chosen by the operator within the quality range in their clinical practice. However, excellent reliability was found in most of the operators and centres as shown by an intraclass correlation coefficient of above 90%. Second, the long time period of inclusion of this study could impact the results. However, when we stratified our patients into subgroups with different time periods of inclusion, we found that the M10LS20 algorithm could be accurately used in all subgroups. Additionally, we established a cut-off value in the study cohort with 2D-SWE, and further validated it using different techniques, including limited numbers of TE measurements and an additional cohort with p-SWE. While an external multicentre study is called for to exclude bias, our study reflects various real-life scenarios, strengthening its applicability and validity.
In conclusion, this study shows for the first time that L-SWE predicts mortality in patients with chronic liver disease regardless of aetiologies. An MELD score above 10 combined with L-SWE measurements above 20 kPa could help to stratify mortality and decompensation risk and guide patient management.
References
Supplementary materials
Supplementary Data
This web only file has been produced by the BMJ Publishing Group from an electronic file supplied by the author(s) and has not been edited for content.
Supplementary Data
This web only file has been produced by the BMJ Publishing Group from an electronic file supplied by the author(s) and has not been edited for content.
Footnotes
Twitter @UschnerFrank, @MajaThiele
JT and WG contributed equally.
Contributors JT: study concept and design, acquisition of data, analysis and interpretation of data, drafting of the manuscript, critical revision of the manuscript for important intellectual content, statistical analysis, obtained funding, technical or material support and study supervision. WG and CJ: acquisition of data, analysis and interpretation of data, drafting of the manuscript, critical revision of the manuscript for important intellectual content, statistical analysis, obtained funding and technical or material support. MT and AK: acquisition of data, analysis and interpretation of data, drafting of the manuscript, critical revision of the manuscript for important intellectual content, statistical analysis, obtained funding, technical or material support and study supervision. VdL, CA, CPS, LC, JD, MF-R, SP, IG, RZ, SF, HG, SM, IS, AB, FEU, MR, CC, MK, MS, ITD, JC, MJB, PER, TV, MP, JB, PGF, DNR, VV, AG, OG, SZ, CV, XL, LV, RS, AP, CM and WW: acquisition of data and critical revision of the manuscript for important intellectual content.
Funding JT is supported by grants from the Deutsche Forschungsgemeinschaft (SFB TRR57 to P18), European Union’s Horizon 2020 Research and Innovation Programme (Galaxy, No. 668031, MICROB-PREDICT, No. 825694 and DECISION No.84794), and Societal Challenges - Health, Demographic Change and Wellbeing (No. 731875), and Cellex Foundation (PREDICT). WG is supported by the China Scholarships Council (CSC: #201906230332). SF has a senior clinical research mandate from the Fund for Scientific Research (FWO) Flanders (1802154N). RZ was supported by the National Natural Science Foundation of China under grant no. 81827802.
Competing interests JT has received speaking and/or consulting fees from Gore, Bayer, Alexion, MSD, Gilead, Intercept, Norgine, Grifols, Versantis, and Martin Pharmaceutical. Philip Ferstl received consultancy for SNIPR Biome. Supersonic Imagine supported interaction within the groups, but without specific funding.
Patient consent for publication Not required.
Ethics approval The study was approved by the local ethics committees of the participating centres.
Data availability statement All data relevant to the study are included in the article or uploaded as online supplemental information.
Supplemental material This content has been supplied by the author(s). It has not been vetted by BMJ Publishing Group Limited (BMJ) and may not have been peer-reviewed. Any opinions or recommendations discussed are solely those of the author(s) and are not endorsed by BMJ. BMJ disclaims all liability and responsibility arising from any reliance placed on the content. Where the content includes any translated material, BMJ does not warrant the accuracy and reliability of the translations (including but not limited to local regulations, clinical guidelines, terminology, drug names and drug dosages), and is not responsible for any error and/or omissions arising from translation and adaptation or otherwise.