Article Text

Abstract
Objective Chronic pancreatitis (CP) is a fibroinflammatory syndrome leading to organ dysfunction, chronic pain, an increased risk for pancreatic cancer and considerable morbidity. Due to a lack of specific biomarkers, diagnosis is based on symptoms and specific but insensitive imaging features, preventing an early diagnosis and appropriate management.
Design We conducted a type 3 study for multivariable prediction for individual prognosis according to the TRIPOD guidelines. A signature to distinguish CP from controls (n=160) was identified using gas chromatography-mass spectrometry and liquid chromatography‐tandem mass spectrometry on ethylenediaminetetraacetic acid (EDTA)-plasma and validated in independent cohorts.
Results A Naive Bayes algorithm identified eight metabolites of six ontology classes. After algorithm training and computation of optimal cut-offs, classification according to the metabolic signature detected CP with an area under the curve (AUC) of 0.85 ((95% CI 0.79 to 0.91). External validation in two independent cohorts (total n=502) resulted in similar accuracy for detection of CP compared with non-pancreatic controls in EDTA-plasma (AUC 0.85 (95% CI 0.81 to 0.89)) and serum (AUC 0.87 (95% CI 0.81 to 0.95)).
Conclusions This is the first study that identifies and independently validates a metabolomic signature in plasma and serum for the diagnosis of CP in large, prospective cohorts. The results could provide the basis for the development of the first routine laboratory test for CP.
- lipid metabolism
- liver metabolism
- pancreatic disorders
- chronic pancreatitis
- liver cirrhosis
Data availability statement
Data may be obtained from a third party and are not publicly available. Data are deidentified patient data, which are available from the corresponding author after appropriate application for reuse under research purpose only.
This is an open access article distributed in accordance with the Creative Commons Attribution Non Commercial (CC BY-NC 4.0) license, which permits others to distribute, remix, adapt, build upon this work non-commercially, and license their derivative works on different terms, provided the original work is properly cited, appropriate credit is given, any changes made indicated, and the use is non-commercial. See: http://creativecommons.org/licenses/by-nc/4.0/.
Statistics from Altmetric.com
Significance of this study
What is already known on this subject?
Chronic pancreatitis greatly increases the morbidity and mortality of affected patients.
No blood-based, serum-based or plasma-based biomarkers exist for the diagnosis of chronic pancreatitis.
What are the new findings?
In a two-step identification and validation study a biomarker signature for chronic pancreatitis was identified by mass spectrometry (gas chromatography-mass spectrometry and liquid chromatography‐tandem mass spectrometry).
In 670 patients and controls from three cohorts, and among 620 identified metabolites, a panel of 8 was found to distinguish chronic pancreatitis with high accuracy from non-pancreatic controls.
This is the first study that identifies and independently validates a metabolic biomarker signature for the diagnosis of chronic pancreatitis in large, prospective cohorts.
How might it impact on clinical practice in the foreseeable future?
The results of this study could provide the basis for the development of a first routine laboratory test for chronic pancreatitis.
Introduction
Chronic pancreatitis (CP) is an inflammatory syndrome1 of the pancreas in which repetitive episodes result in fibrotic tissue replacement, organ dysfunction and chronic pain.2 Multiple aetiologies and risk factors lead to the development of CP in humans, which include immoderate alcohol consumption,3 tobacco smoke and variety of genetic predispositions.4–6 Affected patients are at high risk for developing exocrine pancreatic insufficiency leading to maldigestion, as well as endocrine insufficiency, leading to diabetes mellitus type 3c and pancreatic cancer.7 Chronic pain, maldigestion and brittle diabetes will often lead to a significant reduction in quality of life, increased healthcare utilisation and reduced life expectancy.8–11
In spite of multiple aetiologies and pathogeneses most CP patients will develop a similar clinical and histopathological phenotype.12 Following current guidelines, the diagnosis of CP is made when the following criteria are met: recurrent bouts of pancreatic pain with documented rise in amylase or lipase activity, and imaging evidence such as pancreatic calcifications, histological evidence of CP, unequivocal changes in pancreatic duct morphology or severely abnormal pancreatic function tests with maldigestion.2 13–15 Sensitivity and specificity of imaging in CP is variable and stage dependent. Non-invasive biomarkers for diagnosis of CP have not been established and remain an unmet clinical need. Moreover, it is presently impossible to identify patients at risk, or at an early stage of CP, due to a lack of reliable biomarkers.16 While numerous genomic studies in large cohorts have identified a growing number of genetic modifiers and risk factors,17 18 transcriptome or proteome-based approaches have failed to produce robust diagnostic tools for CP.
Little is known about the potential role of metabolomic signatures including lipidomics of body fluids as a diagnostic tool for CP. We have recently identified and validated a metabolomic signature to distinguish between pancreatic cancer and CP.19 This prompted the search for a biomarker signature that can discriminate between CP and controls including patients with non-pancreatic conditions.
Materials and methods
Study design
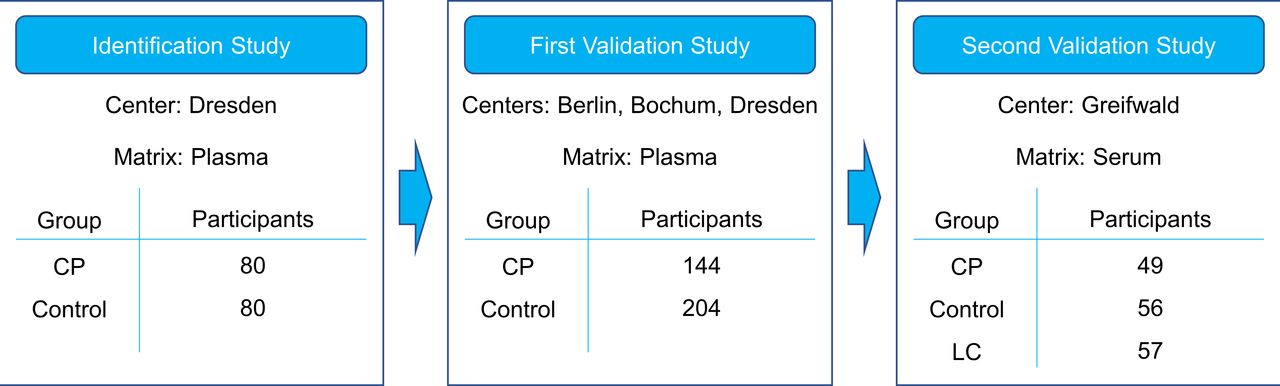
We conducted a type 3 study for multivariable prediction for individual prognosis according to the TRIPOD guidelines.20 A total of 670 patients and controls were prospectively enrolled in the three cohorts and the analysis was done retrospectively. The diagnosis ‘CP’ was made if one or more of the clinical and imaging criteria described by Mayerle et al 7 were met and no other diagnosis was more likely. Similar distribution of age and gender between patients and controls was attempted. Figure 1 and table 1 comprise an overview over the identification and validation cohorts.

Study design. The biomarker signature was identified on the metabolomic data from the identification study, comparing chronic pancreatitis patients (CP) with control patients. These data were used as a training set for the algorithm. Participants of the first validation study were recruited independently and their sample data served as a test set. For the second validation study, participants were recruited independently as well. In this study, liver cirrhosis patients (LC) were included as an additional control group.
Cohort characteristics
The identification study was performed in a case control cohort at a university referral centre and included 80 CP patients and 80 non-pancreatic disease controls who underwent small, non-pancreas-related surgical procedures under general anaesthesia (table 1 and online supplemental methods).
Supplemental material
For the first validation study, 144 CP patients and 204 non-pancreatic controls were consecutively recruited from three different university referral centres.
For the second validation study, conducted to validate the robustness of the method using serum instead of plasma samples, CP, liver cirrhosis patients and healthy blood donors were enrolled at a fourth referral centre. In this cohort, some blood samples had low sample quality, identified by their extremely low glucose levels (<2800 µmol/L), and were consecutively excluded from analysis. The samples from 49 CP patients, 57 liver cirrhosis patients and 56 healthy blood donors were included in the final analysis.
Clinical information on gender, age and body mass index (BMI) were recorded. In addition, information on the disease aetiology, disease duration, calcifications, endocrine insufficiency and enzyme supplementation were recorded if available. All cohort characteristics can be found in table 1.
All participants gave their written informed consent prior to inclusion. Further information on study details and sample processing can be found in online supplemental material and methods.
Metabolite profiling
All samples were analysed with MxP Global Profiling and MxP Lipids. MxP Global Profiling was performed employing (1) gas chromatography-mass spectrometry (GC-MS) using an Agilent 6890 gas chromatograph coupled to an Agilent 5973 mass-selective detector and (2) liquid chromatography‐tandem mass spectrometry (LC-MS/MS) using an Agilent 1100 high‐performance liquid chromatography system coupled to an Applied Biosystems API 4000 triple quadrupole mass spectrometer, as has been described in detail before.21–23
Up to 1449 metabolites were detected within the studies depending on the sample matrix and the analytical technique. The metabolites originated from 10 different ontology classes and comprised 838 known metabolites and 611 unknown spectral features. Only those metabolites that met specific quality criteria as described in24 were included in further statistical analyses. Furthermore, quality assessment of plasma samples was performed using the MxP Biofluids Quality Control assay (see our patent application WO2015145387A1).25
Statistics
All metabolite profiling data were log10-transformed before further analysis to achieve an approximate normal distribution. R V.3.3.4 was used for data analyses, see online supplemental methods for a list of R packages used (online supplemental table S1).
For an exploratory multivariate analysis (principal component analysis, PCA), the log10-transformed data of the identification and first validation study were centred and scaled to unit variance, and missing values were imputed before the analysis (see online supplemental methods).
The log10-transformed, scaled and imputed ratios from the second validation study were also used for a PCA, which was visualised separately because of the different sample matrix. TIBCO Spotfire V.7.12.0 was used to visualise the PCAs.
To differentiate between CP patients and controls depending on their metabolic profiles, a Naive Bayes model was fitted using the log10-transformed, median-imputed, centred and scaled data from the identification study. Based on biomedical expertise a panel was nominated (see online supplemental methods). An algorithm was trained with the data on the selected panel metabolites. The fitted model was evaluated with 10-fold cross-validation. Optimal coefficients were determined, and an optimal cut-off based on the criteria of a sensitivity of 0.8 was calculated in order to classify the patients.
To validate the generated model for patient classification, the algorithm was applied to log-10-transformed, centred and scaled data from the first validation set. For scaling of the first validation dataset, the mean and SD of the identification dataset were applied. A prediction score was calculated for each patient and patients were classified according to their score being above or below the cut-off value. The cut-off established previously on the biomarker identification dataset was applied on the data from the first validation set without retraining, and the performance was measured in terms of area under the curve (AUC), sensitivity and specificity. Confidence levels for the AUC were calculated using the binormal model for the receiver operating characteristic (ROC) curve. Further information on the prediction model and more details on the statistical analysis can be found in online supplemental file.
To test the validity of this classification algorithm and the corresponding cut-off when the sample matrix is serum and not plasma, it was also applied separately to the log10-transformed, centred and scaled data from the second validation dataset in the same manner.
Independently, a simple linear model (multivariate analysis of variance (MANOVA)) was calculated using ‘disease’, ‘age’, ‘BMI’ and ‘gender’ as independent variables and log10-transformed metabolite profiling data as dependent variable from all three studies separately. Each numerical independent variable was scaled prior to the analysis.
In the second validation study, BMI values were not available for all participants. For inclusion of BMI as confounding factor in MANOVA, missing BMI values were imputed. Significance level was set to 5%. The multiple test problem for the number of metabolites was addressed by calculating the false discovery rate (FDR) using the Benjamini and Hochberg method.26 The cut-off for the FDR was set at 20%.
Advancement criteria
The goal of our study was to design a biomarker that can discriminate between CP patients and controls with an AUC of at least 0.8. In addition, the specificity needed to be higher than the sensitivity because guidelines emphasise that diagnosis of CP comes with great burden and may induce stigmatisation for the patient. For a successful validation, we expected the confidence intervals for the performance (AUC) to overlap between the training and the test set.
Results
Study cohorts and patient characteristics
Clinical characteristics of all cohorts are shown in table 1. All studies were unbalanced between male and female participants due to the nature of CP, which is much more frequent in men than in women.27
Metabolomic analyses in samples from CP patients and non-pancreatic controls
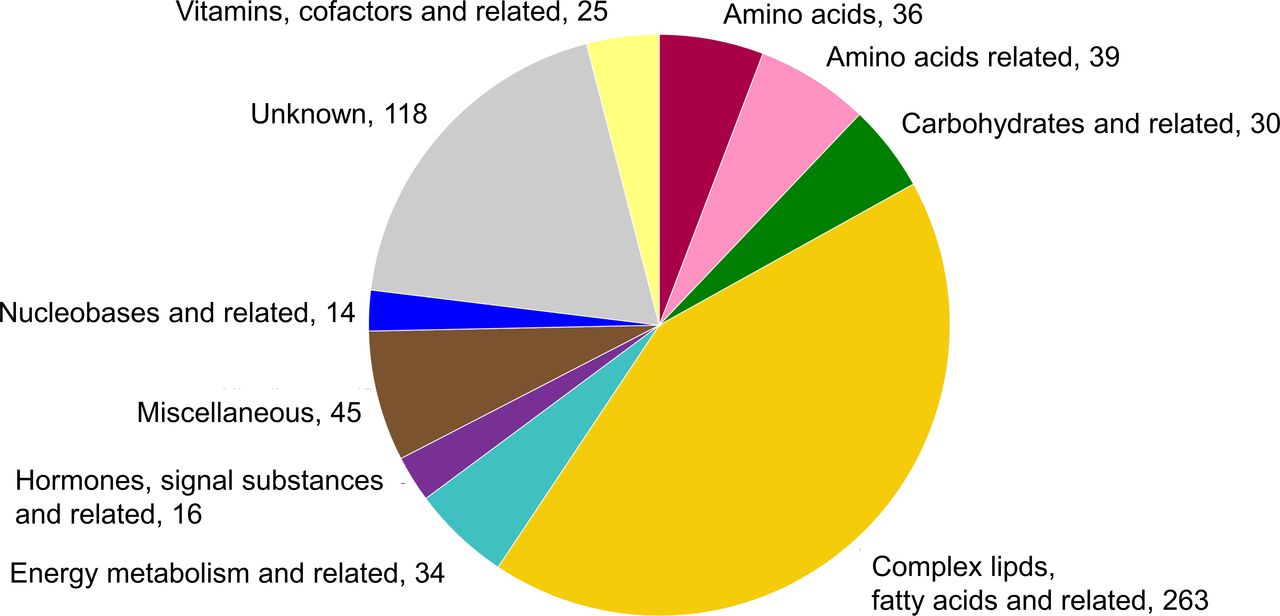
The metabolomics data underwent a strict quality control after which 505 known and 115 unknown metabolites from plasma samples, and 498 known and 118 unknown metabolites from serum samples remained for statistical analysis. Most of the metabolites could be detected in both plasma and serum samples. Their distribution over the ontology classes is shown in figure 2.

Metabolite distribution over ontology classes and number within class as analysed in the identification study and the first validation study.
Discrimination of CP and control patients by multivariate statistics
We investigated whether metabolic profiles of CP and control patients could generally be separated in an unsupervised multivariate statistical approach.
A PCA was performed on all plasma sample data. The best separation of groups was obtained in the principal components (PC) 1 and 2, which accounted for 12% and 7% of the whole variance of the dataset, respectively (figure 3A). The two groups showed a major overlap but samples from CP patients had a tendency towards lower scores in PC1, which was remarkable for a heterogeneous cohort with high interindividual variability due to diverse lifestyles, medications and comorbidities.
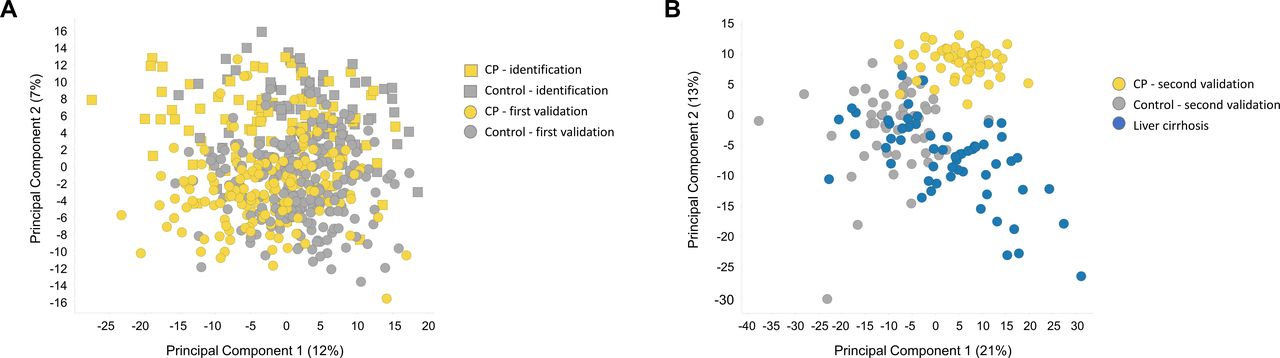
Multivariate analysis. (A) Principal component analysis (PCA) score plot of the identification study and the first validation study sets (EDTA plasma). The best separation of the control group (grey) and the CP group (amber) was observed plotting principal component (PC) 1 vs PC2. Together, these PCs account for 19% of the observed total variation within the dataset. (B) PCA score plot of the second validation study set (serum). A marked separation between the control group (grey), the CP group (amber), as well as the liver cirrhosis group (blue) was observed plotting PC1 vs PC2. While there was some overlap between the CP and the liver cirrhosis groups, the control group is markedly separated from the other two. Together, these PCs account for 34% of the observed total variation within the dataset. CP, chronic pancreatitis; EDTA, ethylenediaminetetraacetic acid.
In the PCA obtained in the second validation study, liver cirrhosis patients were added as a third diagnosis group in addition to CP and controls (figure 3B). The best separation between the groups was again observed in PC1 and PC2 (21% and 13% of the observed variance). Remarkably, an almost complete separation of the control group from the other two could be observed. The CP patients tended to have higher scores in the PC2 than the liver cirrhosis patients, resulting in a visible separation between these groups.
While it is not common to perform a PCA in the validation cohorts, it was done in this case to show that the metabolomic profiles and the distribution of the CP versus control group patients in the identification study and the first validation study are very similar, proving that the two studies, although conducted independently, are actually comparable. The PCA of the second validation study yields a good overview on how the metabolic profile of the liver cirrhosis patients relate to the metabolic profiles of CP patients and controls.
Biomarker discovery and training
The observed separation tendencies in our multivariate approach indicated the possibility to compile a biomarker signature that allowed differentiation between CP and control patients.
As result of the Naive Bayes algorithm and biomedical expertise applied on the identification study a panel of eight metabolites (table 2) was nominated. Using the optimal calculated cut-off of 0.479 of the prediction score, the biomarker signature detected CP in comparison to control patients with an AUC of 0.85 (95% CI 0.79 to 0.91) as explained in online supplemental table S2). The specificity was 0.86 and the sensitivity 0.71 (table 3); ROC curves see figure 4A.

Performance of the biomarker signature for detection of chronic pancreatitis. Receiver operating characteristics and area under the curve (AUC) of the biomarker signature for differentiating chronic pancreatitis from control. (A) Identification study (EDTA plasma) (B) first validation study (EDTA plasma) (C) second validation study (serum). EDTA, ethylenediaminetetraacetic acid.
List of metabolites selected for the biomarker signature
Performance characteristics for the biomarker signature
Biomarker validation in independent validation cohorts
The biomarker signature was tested in a first validation study, comprising ethylenediaminetetraacetic acid (EDTA) plasma samples from 348 patients. Cut-off and coefficient values for the metabolites were transferred from the identification study, and the diagnostic performance was evaluated. CP (in comparison to control patients) was detected with an AUC of 0.85 (95% CI 0.81 to 0.89). This corresponded to a specificity of 0.66 and a sensitivity of 0.84 (table 3). The CIs of the AUCs in both studies were almost identical, indicating that the biomarker performance was robust enough to be successfully transferred to the first validation study. The ROC curve is shown in figure 4B.
Having obtained a steady performance in the first validation study, we tested whether the CP biomarker signature was valid in a different context and conducted a second validation study, including metabolomics data from 162 individuals. In this cohort, we used serum samples, and liver cirrhosis patients as additional controls.
Cut-off and metabolite coefficients were again transferred from the identification study to the second validation study without retraining, and the diagnostic performance was assessed. The AUC for CP versus control was 0.87 (95% CI 0.81 to 0.95). This CI showed considerable overlap with the AUC CI in the identification study, indicating a successful performance in the second validation. Specificity was 0.89 and sensitivity 0.78 (table 3). The ROC curve is shown in figure 4C. The biomarker signature was thus robust enough to work with serum samples.
When the algorithm was applied to liver cirrhosis samples, the results were more similar to the CP group than to the blood donor group.
Multivariate statistical analysis of the biomarker panel in the three study cohorts
Separate analysis of the three datasets revealed that the eight chosen metabolites were all significantly altered in CP patients versus controls in both plasma-based studies (p<0.05; FDR<0.2), and 6 of them also in the serum-based study. The variance analysis results (fold-changes) for the panel metabolites are shown in table 4. FDR-corrected p values (q values) are provided in online supplemental table S3. Of note, the fold-changes were in the same range across all studies. A striking feature was the very small p values for the panel metabolites in the first validation study. Due to the larger sample number in this study, the statistical significance was higher also for metabolites with small shifts in concentration levels between the groups. In addition, the PCAs show that the groups in the second validation study were less homogenous than in the first validation study, leading to higher p values in the MANOVA.
Statistical analysis results (linear model) of the signature metabolites (CP vs control)
The calculation of prediction scores revealed the relative importance of the panel metabolites, with beta-carotene and cryptoxanthin having the highest impact (table 4). Boxplots indicate the inter-individual variability of the panel metabolite levels (figure 5A–H) in the different studies. They illustrate why the carotenoids were chosen as the most important metabolites by the algorithm, as they discriminated best between groups. Nevertheless, single metabolites were unable to discriminate between CP and controls. Only the computation of the biomarker panel yielded a sufficiently accurate diagnosis. The distribution of age and BMI over the biomarker signature score is shown in online supplemental figure S1.
Supplemental material

Boxplots of individual metabolite levels from the biomarker signature within the three studies, separated by group. CP, chronic pancreatitis.
Effect of pancreatic insufficiency
Because the identification of beta-carotene and cryptoxanthin suggested a pathophysiological mechanism of maldigestion/malabsorption, we analysed whether pancreatic exocrine insufficiency (PEI) and enzyme supplementation (pancreatic enzyme replacement therapy, PERT) had an effect on plasma carotenoid levels (online supplemental figure S2). No significant increase of carotenoid plasma levels in PEI with PERT was observed. However, a significant increase of the biomarker signature score values was seen when comparing CP patient from the identification and first validation cohorts with and without pancreatic insufficiency, indicating correlation of this metabolic biomarker signature with disease stage (online supplemental figure S3).
Supplemental material
Supplemental material
Discussion
In our proof-of concept biomarker study following the TRIPOD guidelines20 we show for the first time that a signature comprised of 8 metabolites of six different ontology classes can successfully differentiate between CP and controls with acceptable accuracy (AUC >0.8) in serum and EDTA-plasma samples.
There is no recommended blood-based biomarker for diagnosis of CP in medical guidelines.2 Some proteins or miRNAs have been proposed to have a potential to take up this role, but validation studies in larger cohorts are still lacking.28 29 Those biomarkers analytically validated for diagnosis using mass spectrometry are reviewed by Chou et al, but diagnostic accuracy is mostly unknown.30 Studies in rodents employing spontaneous and pharmacologically induced models of CP suggested significant alterations to the pancreatic metabolome, including energy production, anabolism, lipid synthesis and ROS detoxification pathways.31 32 Small and due to their heterogeneity inconclusive nuclear MR-spectroscopy-based human studies identified changes in citrate and adenosine levels in urine and 3-hydroxybutyrate, trimethylamine-N-oxide, acetate, acetone, isoleucine, acetylglycine, triglyceride and inosine levels in serum.33 34 This prompted us to conduct a trial with a study design more adequate for biomarker development.
The main strength of the signature discovered in the presented study is its robustness. We used large and well-characterised patient cohorts with adequate controls for training and external validation. The comparability of results yielded from EDTA-plasma and serum samples underscores the validity of the assays used, despite the described high intraindividual and interindividual variability of the blood-metabolome.21 The signature yielded in acceptable diagnostic accuracy in the three presented sub-studies with AUC varying between 0.85 and 0.87. Of note, we report considerable variation regarding sensitivity and specificity in the first validation study which is explained by a certain heterogeneity when recruiting at multiple sites. The relevance of this finding needs exploration in further studies.
On closer inspections, the identified metabolites fit pathophysiological concepts of CP. Levels of fat-soluble vitamins, antioxidants and trace elements have been reported to be lower in CP patients when compared with controls.35–40 Whether the deficiency in beta-carotene and cryptoxanthin (exogenous compounds) is secondary to malabsorption remains unknown.41 42 We could not discover an association between PEI or PERT and beta-carotene levels in the identification cohort. However, these data need to be interpreted with caution as previous studies have been inconsistent regarding the relationship of PEI and nutritional markers.43 44 This is the first study to describe a decrease in beta-carotene levels as a diagnostic marker for CP.
Mannose and other carbohydrates were found to be significantly altered in a GC-MS based approach in studies identifying metabolic biomarkers for acute pancreatitis.45 Although in their study, Xiao et al did not find a further increase after repeated episodes of acute pancreatitis, it underscores the role of the pancreas in sugar metabolism during health and disease.
Ceramides and other components related to sphingomyelin-metabolism have been associated with metabolome changes in caerulein-induced pancreatitis in mice46 and were found to be a hallmark in a metabolome signature highly sensitive for the detection of pancreatic cancer in a previous study from our group.19 The reduced levels of the poorly absorbable long-chain saturated behenic acid, found in our CP subjects could be directly related to ceramide pathways by ceramide synthetase 2.47 To our knowledge, there is no published study linking behenic acid to pancreatitis.
Indol-3-acetic acid, which belongs to the group of uraemic toxins, is a tryptophan-derived byproduct of microbiota in the large intestine. It’s bioavailability depends on the gut microbiome and has been linked to aryl hydrocarbon receptor expression,48 which in turn regulates fibrosis of the pancreas.49 The microbiome composition is sensitive to pancreatic enzyme secretion, even in non-clinically manifested CP.50 Similarly, plasma levels of hippuric acid, another uraemic toxin, is sensitive to change of the gut microbiome related to diet, drugs and diseases.51
N-acetylcytidine is a post-transcriptional mRNA modification that can induce more efficient translation52 and is implicated in inflammasome related interleukin (IL)1β production in patients with chronic inflammation.53 Inflammasome activation, yet not a pancreas specific process, is involved in pancreatic healing and fibrosis.54
Taken together the signature is comprised of metabolites at least plausible to be involved in a variety of processes implicated with pathogenesis of CP. Failure of a single biomarker in an individual patient could, therefore, be compensated by other components of the algorithm. This is further supported by the finding, that the biomarker score increases with presence of pancreatic insufficiency, a surrogate for disease stage.
A recent study by an US American consortium used a 62-plex luminex assay to identify potential biomarkers for diagnosis of CP. In blood samples of 41 controls, 20 recurrent acute pancreatitis (RAP) and 40 CP patients they found that GM-CSF, IFNb, Leptin, PDGFB and Resistin could distinguish between CP and control (AUC 0.86) and resistin, SCF, MIP-1a and IL-17F between RAP and CP (AUC 0.77).55 Although the results are not comparable due to methodological differences it appears clear that only a combination of markers rather than a single protein allows for adequate discrimination. Independent validation of these data are pending.
A potential weakness of our study is the fact that CP patients and controls were unmatched for age, gender and BMI due to disease heterogeneity and consecutive recruitment. CP is diagnosed predominantly in middle-aged males at risk for malnutrition.12 13 Non-pancreatic controls (eg, day-surgery patients or blood donors) comprise by default a different cohort. Consequently, gender, BMI and age were not included in the prediction model because we aimed to avoid the pitfall that a shift in age alone could be sufficient to change a positive to a negative classification or vice versa.
It cannot be ruled out that some of the differences in the metabolic profiles between the groups are due to these features. Nevertheless, the MANOVA statistics were corrected for age, gender and BMI, and still show a significant difference between the groups for all chosen metabolites. This supports our hypothesis that this metabolic signature is able to identify CP patients irrespective of gender, age and BMI.
We found the metabolic signature developed to distinguish CP from controls to be less discriminative when applied to liver cirrhosis samples. The similarity was interpreted as being likely due to activation of fibrosis and alcohol abuse, a common feature of both disorders. Fortunately, having to discriminate between liver cirrhosis and CP is uncommon and diseases rarely overlap. In the second validation study however, an almost complete separation of the control group from CP was seen. In this cohort, the control group was comprised healthy blood donors instead of non-pancreatic patients, which explains the significant improvement.
A potential clinical use of this metabolic signature is the identification of CP patients early in the disease course (early CP), of patients with unexplained abdominal symptoms and a history of pancreatic disease, but (yet) no definitive morphological signs of CP (probable CP), or of patients with RAP at risk for developing CP.16 These groups so far are only vaguely defined by international consensus diagnostic criteria. We, therefore, recruited patients with definitive CP for the sake of biomarker development. Whether the presented metabolic signature is sensitive enough under the above circumstances needs further testing in trials with long-term follow-up,12 ideally in a design that includes disease staging via chronic pancreatitis prognosis score score.44 Whether a metabolic biomarker can distinguish between CP and cirrhosis which share a common aetiology (alcohol), also needs to be addressed in future trials.
In conclusion, we have identified and validated an LC-MS/MS-based human blood-metabolome signature, which successfully discriminates between healthy individuals and patients with CP. Whether this biomarker has clinical value for diagnosing early stages of CP or can be used to monitor disease progression needs further prospective studies.
Data availability statement
Data may be obtained from a third party and are not publicly available. Data are deidentified patient data, which are available from the corresponding author after appropriate application for reuse under research purpose only.
Ethics statements
Patient consent for publication
Ethics approval
All studies were designed and conducted in adherence to the Declaration of Helsinki and approved by the local ethics review boards of all four participating centres.
Acknowledgments
We are grateful to technical staff in the analytical department of Metanomics Health for their excellent technical support and Susanne Wiche, and Doris Jordan for technical assistance.
References
Supplementary materials
Supplementary Data
This web only file has been produced by the BMJ Publishing Group from an electronic file supplied by the author(s) and has not been edited for content.
Supplementary Data
This web only file has been produced by the BMJ Publishing Group from an electronic file supplied by the author(s) and has not been edited for content.
Footnotes
MGA and GB are joint first authors.
JM and MML are joint senior authors.
MGA and GB contributed equally.
JM and MML contributed equally.
Correction notice This article has been corrected since it published Online First. The author, Tim Fahlbusch's, name has been corrected.
Contributors Study design: JM, BK and MML; patient and biomaterial recruitment: CP, TF, MD, FK, FUW, MB, WU, RG, GB, UMM, JM and MML; data acquisition and statistical analysis: MGA, BK, NC; writing committee: MGA, GB, JM, BK and MML; manuscript revision and approval: BK, NC, CP, MD, TF, FK, FUW, MB, WU, RG, JM and MML.
Funding Supported by the Deutsche Krebshilfe/Dr. Mildred-Scheel-Stiftung (109102), the Deutsche Forschungsgemeinschaft (DFG MA 4115/1-2/3, SFB1321: Project-ID 329628492, BE 6395/1 -1), the Federal Ministry of Education and Research (BMBF GANI-MED 03IS2061A and BMBF 0314107, 01ZZ9603, 01ZZ0103, 01ZZ0403, 03ZIK012), the Wilhelm Sander Stiftung (2009.039.2) and EFRE-State Ministry of Economics MV (V-630-S150-2012/132/133), ESF/14-BM-A55-0045/16 PePPP and ESF/14-BM-A55-0010/18 EnErGie).
Competing interests None declared.
Provenance and peer review Not commissioned; externally peer reviewed.
Supplemental material This content has been supplied by the author(s). It has not been vetted by BMJ Publishing Group Limited (BMJ) and may not have been peer-reviewed. Any opinions or recommendations discussed are solely those of the author(s) and are not endorsed by BMJ. BMJ disclaims all liability and responsibility arising from any reliance placed on the content. Where the content includes any translated material, BMJ does not warrant the accuracy and reliability of the translations (including but not limited to local regulations, clinical guidelines, terminology, drug names and drug dosages), and is not responsible for any error and/or omissions arising from translation and adaptation or otherwise.