Article Text

Abstract
Objective Cellular senescence limits tumourigenesis by blocking the proliferation of premalignant cells. Additionally, however, senescent cells can exert paracrine effects influencing tumour growth. Senescent cells are present in premalignant pancreatic intraepithelial neoplasia (PanIN) lesions, yet their effects on the disease are poorly characterised. It is currently unknown whether senolytic drugs, aimed at eliminating senescent cells from lesions, could be beneficial in blocking tumour development.
Design To uncover the functions of senescent cells and their potential contribution to early pancreatic tumourigenesis, we isolated and characterised senescent cells from PanINs formed in a Kras-driven mouse model, and tested the consequences of their targeted elimination through senolytic treatment.
Results We found that senescent PanIN cells exert a tumour-promoting effect through expression of a proinflammatory signature that includes high Cox2 levels. Senolytic treatment with the Bcl2-family inhibitor ABT-737 eliminated Cox2-expressing senescent cells, and an intermittent short-duration treatment course dramatically reduced PanIN development and progression to pancreatic ductal adenocarcinoma.
Conclusions These findings reveal that senescent PanIN cells support tumour growth and progression, and provide a first indication that elimination of senescent cells may be effective as preventive therapy for the progression of precancerous lesions.
- pancreatic tumours
- cell biology
- cell cycle control
Data availability statement
Data are available in a public, open access repository. mRNA-seq expression profiles were deposited inthe Gene Expression Omnibus (GEO) database, accession number GSE128319 (https://www.ncbi.nlm.nih.gov/geo/query/acc.cgi?acc=GSE128319). scRNA-Seq data are available at GSE141017 (https://www.ncbi.nlm.nih.gov/geo/query/acc.cgi?acc=GSE141017). There are no conditions for access or usage.
This is an open access article distributed in accordance with the Creative Commons Attribution 4.0 Unported (CC BY 4.0) license, which permits others to copy, redistribute, remix, transform and build upon this work for any purpose, provided the original work is properly cited, a link to the licence is given, and indication of whether changes were made. See: https://creativecommons.org/licenses/by/4.0/.
Statistics from Altmetric.com
Significance of this study
What is already known on this subject?
Senescent cells are present in premalignant lesions, including pancreatic intraepithelial neoplasi (PanINs), yet whether they affect lesion growth and progression is largely unknown. Drugs with senolytic activity were recently identified and shown to ameliorate a host of disease phenotypes in preclinical models. Their potential benefit in cancer treatment is yet to be established.
What are the new findings?
Senescent cells provide crucial support for PanIN growth, at least in part through Cox2 activity. Senolytic elimination of Cox2-expressing senescent cells is feasible through the inhibitor of the Bcl2 antiapoptotic protein family, ABT-737, and periodic treatment dramatically reduces PanIN growth and progression to pancreatic ductal adenocarcinoma.
How might it impact on clinical practice in the foreseeable future?
Application of senolytic therapy may be beneficial in preventing progression of PanINs, particularly in populations at risk such as patients suffering from familial pancreatitis. Senolytic therapy may hold potential in other settings in which senescent cells promote tumourigenesis.
Introduction
Cellular senescence is a major roadblock to cancer development, preventing the proliferation of potentially transformed cells.1–3 Senescence of cells undergoing tumourigenic transformation is induced mainly by oncogene activity and DNA damage responses, and is mediated by several main pathways, including the p16Ink4a and p53 tumour suppressors. Senescent cells are detected within tumours, often in premalignant stages, consistent with a tumour-inhibiting role.4 However, it is now clear that senescent cells can influence tumourigenesis through additional, non-cell-autonomous mechanisms, mostly mediated by the senescence-associated secretory phenotype (SASP), which involves the secretion of a host of cytokines, growth factors and remodelling enzymes.5 6 SASP composition and levels are highly context dependent, promoted by DNA damage, and mediated by several regulators, including nuclear factor-κB (NFκB).5 6
The non-cell-autonomous actions of senescent cells in cancer are complex. In some settings senescent cells were shown to inhibit tumourigenesis, by recruitment of immune cells or propagation of the senescence phenotype,7–9 while in other settings such cells promoted tumourigenesis, by secretion of tumour stimulatory cytokines or the generation of an immune protective environment.10–13 There is, however, overall little understanding of the prevalence of senescent cells in different tumour types, stages and cellular compartments and of their functions.
Senescent cells were shown to substantially contribute to ageing and associated diseases in mouse models, suggesting that their elimination could be therapeutically beneficial.14 15 Several drugs showing senolytic activity—preferentially eliminating senescent cells—have been identified, including inhibitors of the Bcl2 anti-apoptotic protein family, a FOXO4-derived peptide, a combination of dasatinib and quercetin, cardiac glycosides and others.3 14 15 These drugs, when administered in a variety of preclinical models, ameliorate a wide array of disease phenotypes in various tissues, and extend lifespan.3 16 17 However, the potential benefits and specific uses of senolytic drugs in cancer treatment or prevention are still largely unknown, and depend on the roles played by senescent cells in different disease settings.
Malignant pancreatic ductal adenocarcinoma (PDAC) represents one of the most deadly tumour types, with little recent progress in treatment options.18 19 Inflammation is thought to promote PDAC formation, as pancreatitis is a risk factor for the disease,20 and experimentally induced pancreatitis accelerates progression to malignancy in mouse models.21–24 Senescent cells are detected within pancreatic intraepithelial neoplasias (PanINs), the most common precursor to PDAC.23 25 26 Whether the presence of senescent cells within PanIN lesions influences PanIN growth and progression to PDAC is largely unknown. PanIN lesions are found in a substantial fraction of the general population, as assessed by autopsies,27 28 and populations at risk for PDAC, such as patients suffering from hereditary pancreatitis or from obesity, show high rates of PanIN formation.29 30 This suggests that premalignant pancreatic disease with potential progression risk may be prevalent, and therefore, understanding the effects of senescence within these lesions is of importance.
Here, we set out to uncover the functions of senescent cells within premalignant pancreatic lesions, and to test the potential effects of their elimination through senolytic treatment. Our findings reveal that these non-dividing cells express high Cox2 levels, providing essential support to PanIN development and progression, and that senolytic treatment eliminating these cells is effective in blocking PanIN growth and PDAC formation.
Results
Senescent and proliferating cells co-reside in PanINs
To track senescent cell appearance in a rapid model for PanIN formation, we used mice carrying an inducible Cre under the control of the acinar-cell-specific Ptf1a promoter, a conditional KrasG12D allele, and a conditional tdTomato reporter (Ptf1a-CreER+/–; LSL-Kras+/G12D; LSL-tdTomato mice). These triple-transgenic mice allow activation of the mutant Kras together with the tdTomato reporter in acinar cells by tamoxifen treatment. We treated triple-transgenic mice aged 6–8 weeks old with tamoxifen and collected their pancreas at different subsequent time points (figure 1A). Recombination activating tdTomato and Kras was detected in approximately 50% of acinar cells 10 days after tamoxifen treatment (figure 1B and online supplemental figure 1A).
Supplemental material
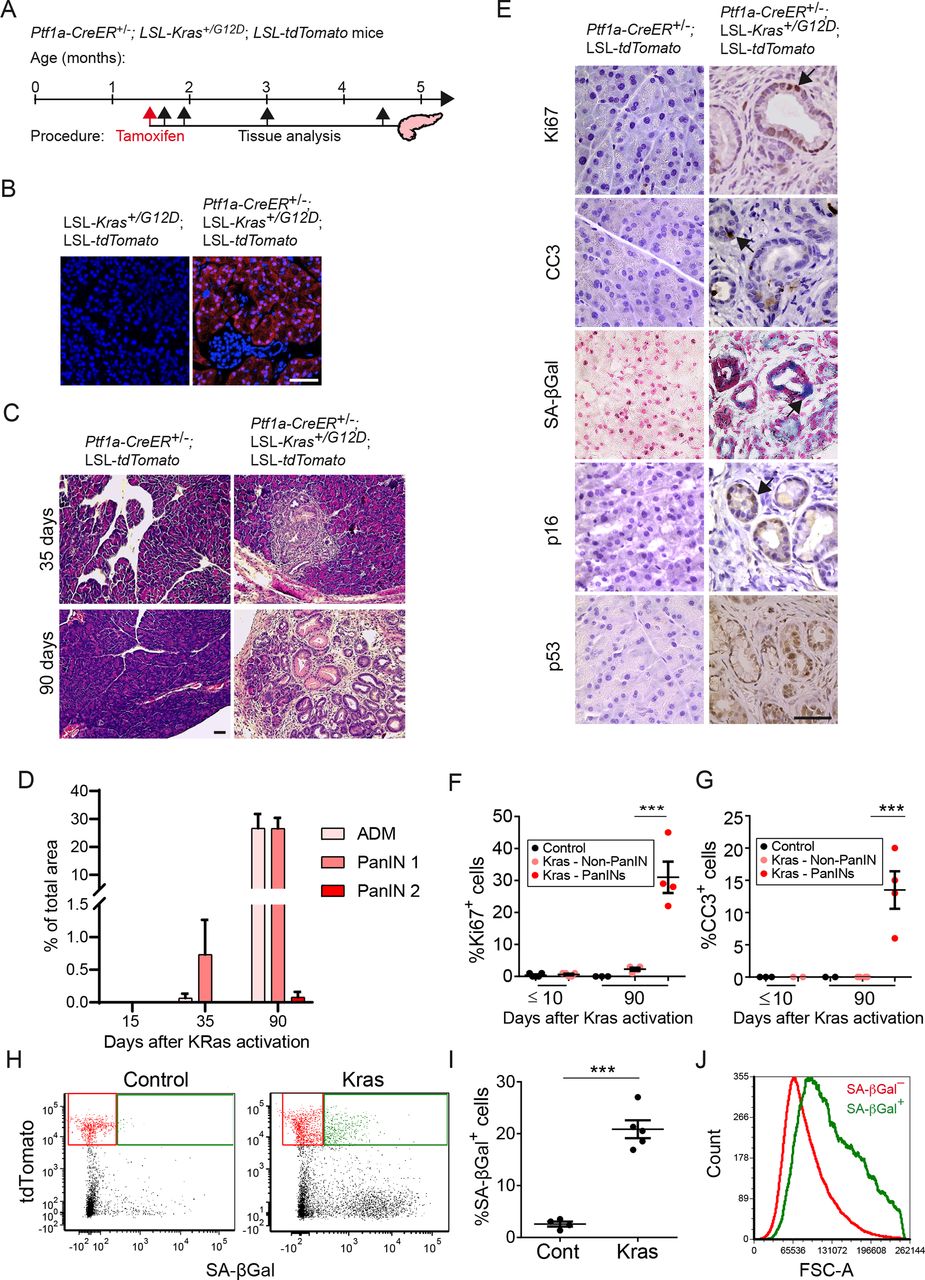
Kras-driven PanINs contain intermixed dividing, apoptotic and senescent cells. (A) Diagram showing the timeline of Kras activation in Ptf1a-CreER+/–; LSL-Kras+/G12D; LSL-tdTomato mice by tamoxifen injection and subsequent analysis time points. (B) tdTomato fluorescence (red) in sections of pancreata collected 10 days after tamoxifen administration. (C) H&E-stained sections of pancreata from triple-transgenic (right) and control double-transgenic mice (left) 35 or 90 days after tamoxifen treatment, showing PanIN1 development in Kras-activated mice. (D) Percentages of tissue area occupied by acinar to ductal metaplasia (ADM) and PanIN lesions at indicated time points after tamoxifen treatment. Values indicate mean across mice (dots) per group ±SE. n=3 for 15 and 35 days, n=5 for 90 days. (E) Pancreas sections from Kras-activated PanIN1-bearing (right) and control (left) mice 3 months after tamoxifen treatment, stained for the proliferation marker Ki67, the apoptosis marker cleaved caspase 3 (CC3), the senescence markers SA-βGal and p16Ink4a, and for p53. (F) Percentage of Ki67+ cells at indicated time points after tamoxifen treatment in pancreas of control mice (black), in regions outside of PanINs in Kras-activated mice (pink), and within PanIN lesions of Kras-activated mice (red). Values indicate mean across mice (dots) in each group ±SE. n=5 for ≤10 days and n=4 for 90 days. (G) Percentage of CC3+ cells in the same samples scored and presented as in (F). (H) Representative FACS analysis of SA-βGal activity, detected with the C12FDG fluorescent substrate and tdTomato fluorescence, in pancreas cells isolated 3 months after tamoxifen treatment from control and Kras-activated mice. Gates indicate tdTomato+ SA-βGal– (red) and tdTomato+ SA-βGal+ (green) cell fractions. (I) Percentage of SA-βGal+ cells out of tdTomato+ cells in control and Kras-activated mice, analysed by FACS as in (H). n=4 control and n=5 Kras-activated mice, collected in two independent experiments. (J) FACS histogram of cell size (forward scatter area, FSC-A) of tdTomato+ SA-βGal– (red) and tdTomato+ SA-βGal+ (green) cell fractions isolated from pancreata of KRas-activated mice. ***P<0.001, t-test. Scale bars=50 µm. PanINs, pancreatic intraepithelial neoplasia.
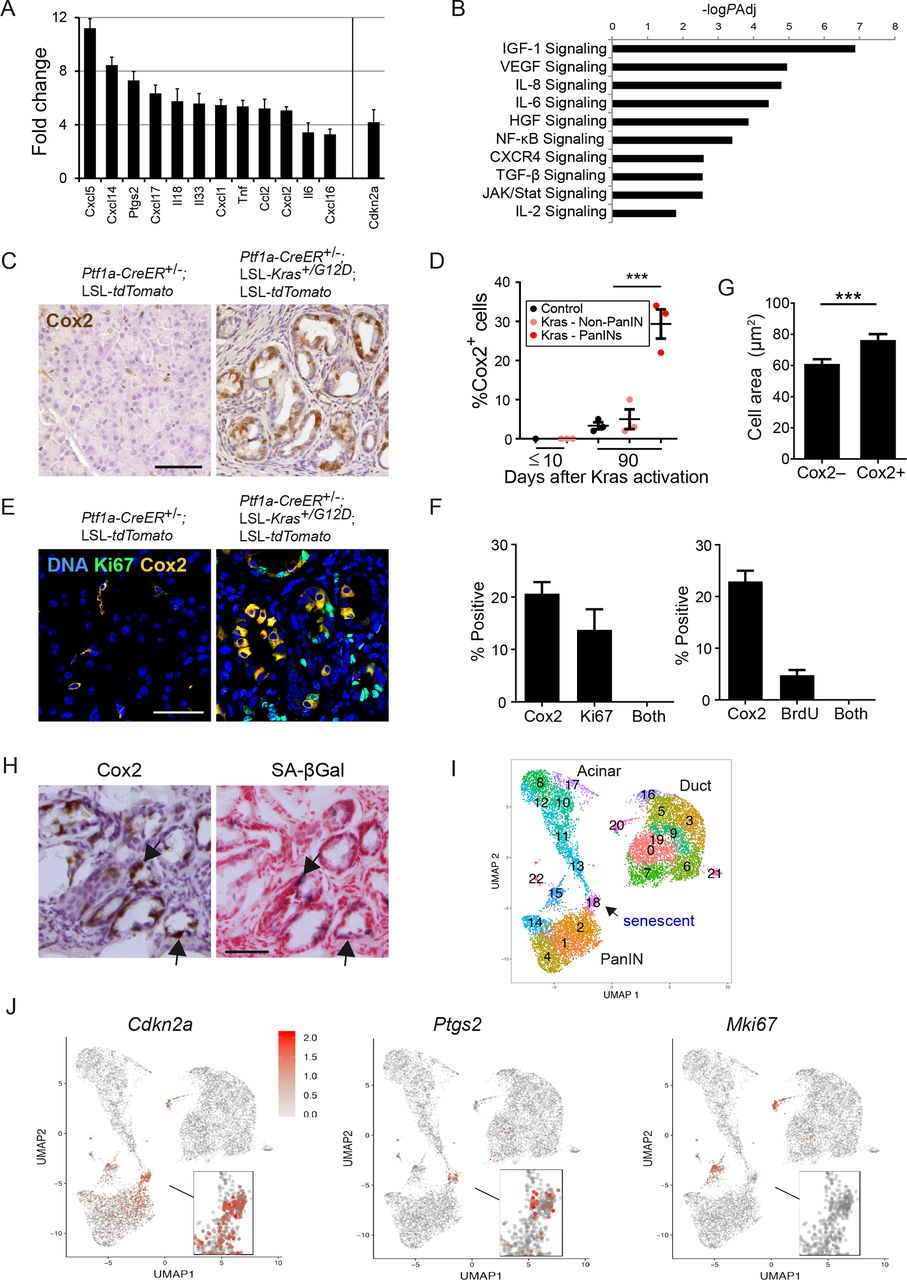
Cox2 is preferentially expressed in non-dividing senescent PanIN cells. (A) SASP-associated genes upregulated in SA-βGal+ vs SA-βGal– PanIN cells isolated from Ptf1a-CreER+/–; LSL-Kras+/G12D; LSL-tdTomato mice 3 months after tamoxifen treatment, determined by mRNA-seq. The senescence activator Cdkn2a is shown on right. n=3 mice, PAdj <0.1 for all genes. (B) Gene sets upregulated in SA-βGal+ vs SA-βGal– PanIN cells. values indicate –log10 of adjusted P value as determined by ingenuity pathway analysis. (C) Cox2 stain (brown) of pancreas sections of control and Kras-activated mice, 3 months after tamoxifen treatment. (D) Percentage of Cox2+ cells at indicated time points after tamoxifen treatment in pancreas of control mice (black), in regions outside of PanINs in Kras-activated mice (pink), and within PanINs in Kras-activated mice (red). Values indicate mean across mice (dots) in each group ±SE. n=3 for both time points. (E) Co-staining of pancreas sections from control and Kras-activated mice for Cox2 (yellow) and the proliferation marker Ki67 (green), showing lack of overlap. (F) Percentage of Cox2+ cells, Ki67+ cells and cells expressing both proteins, in pancreas sections of Kras-activated mice (left); graph on right shows same analysis for BrdU+ cells. Values indicate mean percentages ±SE. Scored in >10 section areas from 5 or 3 mice (for Ki67 and BrdU, respectively), with a total of >1500 PanIN cells scored. (G) Mean area ±SE of Cox2– and Cox2+ PanIN cells. n=127 cells per group, from two mice. (H) Serial pancreas cryosections from Kras-activated mice stained for Cox2 (brown) or SA-βGal (blue). Arrows indicate examples of regions showing overlapping stain. (I) Uniform manifold approximation and projection (Umap) cell clustering of the scRNA-Seq expression profiles of epithelial cells from Ptf1a-CreER+/–; LSL-Kras+/G12D; LSL-tdTomato mice, derived from Schlesinger et al.33 Shown are cells combined from 17D, 6 wk and 3–6 months after Kras activation, as well as cells from Ptf1a-CreER+/–; LSL-tdTomato control mice (see online supplemental figure 4). The senescent cell cluster is labelled as cluster 18. (J) Expression levels of Cdkn2a, Ptgs2, and Mki67 (encoding the proliferation marker Ki67) across cells. Red—high relative expression, grey—low expression. ***P<0.001, t-test. scale bars=50 µm. BrdU, bromodeoxyuridine; IGF, insulin-like growth factor; VEGF, vascular endothelial growth factor; IL-6, interleukin 6; HGF, hepatocyte growth factor; NFκB, nuclear factor-κB; PanINs, pancreatic intraepithelial neoplasia; SASP, senescence-associated secretory phenotype;TGF, transforming growth factor.
Formation of acinar to ductal metaplasias (ADM) and PanIN-1 lesions was first observed 1 month after Kras activation, and these lesions were abundant 90 days after Kras activation, with few more advanced lesions (figure 1C,D). As expected, lesions were comprised of tdTomato-expressing cells (online supplemental figure 1B). Within PanINs, ~30% of cells stained positive for the Ki67 proliferation marker, and an average of 12% of cells stained for the apoptosis marker cleaved caspase 3 (CC3) (figure 1E–G). Staining for the senescence marker SA-βGal indicated the presence of senescent cells within the PanINs, which was supported by positive staining of a subset of cells for p16Ink4a and p53, the two main activators of this state (figure 1E). FACS quantification revealed that ~20% of the tdTomato+ cells were SA-βGal-positive (figure 1H,I). Consistent with their senescent state, these cells were also larger in size (figure 1J). These results indicate that PanINs contain dividing, apoptotic and senescent cells which are interspersed within lesions. Interestingly, SA-βGal+ cells were detected also in the tdTomato-negative fraction (figure 1H). Further analysis of the non-epithelial cell fraction revealed the presence of SA-βGal+ fibroblasts, which expressed elevated Cdkn2a levels, as well as immune cells, including macrophages (online supplemental figure 2). Thus, in addition to their presence within PanINs, senescent cells appear to reside in the stroma of these lesions.
Senescent PanIN cells express Cox2
To gain insights into the traits of the senescent PanIN cells, we dissociated pancreata of triple-transgenic mice 90 days after Kras activation, and isolated by FACS tdTomato+ cells that were either SA-βGal– or SA-βGal+ (online supplemental figure 3A). Comparison of the transcriptomes of these two cell populations revealed an increase in the levels of Cdkn2a, encoding p16Ink4a, in SA-βGal+ cells (figure 2A and online supplemental figure 2C), and changes in gene sets associated with cytoskeletal structure, cell adhesion and other pathways associated with senescence (online supplemental figure 3B). Sets of cytokine-encoding genes were upregulated in the senescent cells, consistent with SASP activation (figure 2B and online supplemental figure 3C). Upregulated cytokine-encoding genes included Cxcl1, Cxcl5, Cxcl14, Tnf, Ccl2, Il18 and Il6, all known components of the SASP (figure 2A).
Among the upregulated SASP-associated genes was Ptgs2, encoding the enzyme Cox2 (cyclooxygenase 2), which is responsible for prostaglandin E2 synthesis, and is a central driver of inflammation (figure 2A). Cox2 was previously shown to be upregulated in PanINs and PDACs, and its proinflammatory activity promotes disease progression.31 32 However, the identity of Cox2-expressing cells within lesions was not determined. We stained PanIN sections for Cox2 and found that 20%–30% of cells expressed the protein (figure 2C–F). The majority of stained cells were epithelial cells in PanIN lesions, yet occasional staining of stromal fibroblasts was also observed (figure 2C). To further establish whether Cox2 expression is preferentially elevated in senescent PanIN cells, we costained sections for Cox2 and the proliferation markers Ki67 and bromodeoxyuridine (BrdU). This revealed a mutually exclusive pattern, indicating that Cox2+ cells are non-proliferating (figure 2E,F). Cox2-expressing cells within PanINs were larger on average than Cox-negative cells, consistent with a senescent state (figure 2G). Staining for SA-βGal and Cox2 on consecutive cryosections revealed overlapping patterns (figure 2H). These results indicate that Cox2 expression is specifically associated with the senescent fraction of PanIN cells.
To obtain further assessment of the senescent cell subpopulation we turned to single-cell transcriptomics. We recently conducted single cell RNA-Seq of pancreata of the Ptf1a-CreER+/–; LSL-Kras+/G12D; LSL-tdTomato mice at several time points after Kras activation, an analysis that identified a subcluster of senescent PanIN cells33 (figure 2I and online supplemental figure 4). Further analysis of this data revealed that expression of Ptgs2 (encoding Cox2) was highly specific to the senescent subcluster of cells, which also expressed Cdkn2a, and was distinct from the proliferating PanIN cell cluster (figure 2I,J). The respective percentages of dividing, senescent and Cox2+ cells were different from those observed in tissue stains, likely due to biases in the cell isolation procedures preceding scRNA-Seq. This analysis supports the identification of the senescent, non-dividing cell fraction as that expressing elevated Cox2 within PanINs.
To test whether Cox2 activity influences lesion growth, we treated triple-transgenic mice with the Cox2 inhibitor sulindac for 3 weeks, starting 3 months after Kras activation, a time-point in which PanINs already developed. A dramatic reduction (~5 fold) in PanIN area was observed in treated mice, versus untreated littermates (figure 3A and B). Sulindac-treated mice showed a decrease in PanIN cell proliferation (figure 3C), and tdTomato+ cells FACS-isolated from mice 1 week after treatment showed reduced expression of proliferation-associated gene sets (figure 3D). Together these results indicate that Cox2 is expressed in senescent PanIN cells, and that its activity promotes PanIN lesion growth.

Cox2 inhibition by sulindac treatment suppresses PanIN development. (A) H&E (top) and Alcian blue (bottom) stains of pancreas sections from Kras-activated mice treated with the Cox2 inhibitor sulindac for 3 weeks starting at 11 weeks of age, or untreated. (B) Percentage of PanIN-occupied area in untreated and mice treated with sulindac for 3 weeks, measured by image analysis of Alcian blue stained regions. n=3 mice (dots). (C) Percentage of PanIN cells staining positive for BrdU incorporation, indicating S phase, in mice treated for 3 days with sulindac and in control mice. n=3 mice. (D) Gene sets downregulated in tdTomato+ cells isolated from PanIN-bearing mice treated with sulindac for 1 week, relative to untreated mice. values indicate –log10 of adjusted P value. Graph values indicate mean±SE. *P<0.05, t-test. Scale bar=50 µm. BrdU, bromodeoxyuridine; PanIN, pancreatic intraepithelial neoplasia.
Treatment with the Bcl2-family inhibitor ABT-737 removes senescent PanIN cells
We next set out to test whether elimination of senescent PanIN cells can be achieved through pharmacological senolytic treatment, and whether this would affect PanIN development and progression to carcinoma. To do this we used Pdx1-Cre+/-; LSL-Kras+/G12D mice, which, upon treatment with the pancreatitis-inducing agent caerulein, develop inflammation-facilitated PanINs that contain senescent cells, and progress more rapidly and synchronously to the carcinoma stage.23 26 34 35 We and others have shown that senescent cell survival is dependent on the upregulation of Bcl2-family antiapoptotic proteins, and that the small-molecule ABT-737, which inhibits Bcl2, Bclxl and Bclw, induces apoptosis of senescent cells in culture and in vivo.13 16 36–38
We first tested whether Bcl2 family proteins are expressed in PanINs and if their expression was associated with senescence. Pdx1-Cre+/-; LSL-Kras+/G12D mice, but not control mice, developed large areas of low grade PanINs at the age of 3 months, 2 weeks after caerulein treatment (figure 4A,B). These PanINs were occupied by SA-βGal+ cells, and contained cells expressing Bcl2, Bclxl and Bclw proteins, contrasting with normal ductal and acinar compartments in control mice (figure 4B). Using imaging flow cytometry we found that SA-βGal+ cells comprised ~15% of CK19+ cells in caerulein-treated Pdx1-Cre+/-; LSL-Kras+/G12D mice (figure 4C,D), consistent with the Ptf1a-CreER driven model (figure 1I). The distribution of expression of the three Bcl2-family proteins was heterogeneous between PanIN regions. Bclxl expression was most consistently upregulated in PanIN lesions and was colocalised with Cox2 (figure 4E). This suggested that the Bcl2-family-expressing cells in PanINs could be targeted by ABT-737 for elimination. We did not detect increased mRNA levels of the Bcl2 family-encoding genes in the senescent cell subpopulation (data not shown), consistent with our previous demonstration that the upregulation of these proteins occurs largely at the post-transcriptional level.37

Bcl2-family proteins are expressed in PanIN lesions of caerulein-treated Pdx-Cre; LSL-Kras mice (A). Timeline of treatments and analysis of Pdx1-Cre+/–; LSL-Kras+/G12D and control Pdx1-Cre+/–mice. Caerulein was injected at 2.5 months of age to induce acute pancreatitis, and analysis was performed 2 weeks subsequently. (B) Representative images of consecutive pancreas sections stained for SA-βGal, CK19 labelling PanIN ducts and Bcl2 family proteins. CK19 was costained with Bcl2 family members on same sections. (C) Representative images of SA-βGal negative (top) and positive (bottom) cells isolated from mouse pancreata analysed by ImageStreamX. SA-βGal stain appears as dark stain in phase-contrast image. (D) Percentage of SA-βGal+ CK19+ cells in dissociated pancreata of Pdx1-Cre+/–; LSL-Kras+/G12D and control Pdx1-Cre+/–mice as identified by analysis in ImageStreamX. (E) Representative images of pancreas sections stained for Cox2 and Bclxl. Arrowheads indicate examples of cells expressing both proteins. Values indicate mean across n=5 mice per group, ±SE. *P<0.05. PanIN, pancreatic intraepithelial neoplasia.
To test whether Bcl2 protein family inhibition eliminates senescent PanIN cells, we treated Pdx1-Cre+/-; LSL-Kras+/G12D mice, subsequent to caerulein administration, with ABT-737 for two consecutive days at the age of 3 months, and sacrificed the mice 1 day later (figure 5A). We observed increased numbers of cells expressing the apoptosis marker CC3 in PanINs of ABT-737-treated mice, indicating that Bcl2 family inhibition led to apoptosis of PanIN cells (figure 5B,C). These apoptotic cells were often shed into PanIN duct lumens. We did not detect CC3+ cells in stromal fibroblasts, macrophages, or other stromal components following treatment (online supplemental figure 5). Importantly, ABT-737 treatment led to a significant decrease in the percentage of SA-βGal+ cells, and, concordantly, of Cox2-expressing cells (which were colocalised), consistent with preferential elimination of senescent cells by Bcl2-family inhibition (figure 5D–G). Furthermore, the numbers of Bclxl-positive cells were also reduced, indicating that they were preferentially targeted (figure 5H,I). Interestingly, concurrent with the removal of the senescent cells, we observed at this immediate time point an increase in the division rates of remaining PanIN cells (online supplemental figure 6). This indicates that dividing PanIN cells are not preferentially targeted by the treatment. The elimination of the non-dividing senescent cells could, in part, reflect the proportional increase in the Ki67+ cells when the non-dividing, senescent cells, are removed. Together these results indicate that Bcl2 family inhibition by ABT-737 can eliminate approximately 50% of the senescent and Cox2+ cells within PanIN lesions, a rate that is consistent with our previous studies.13 16 37
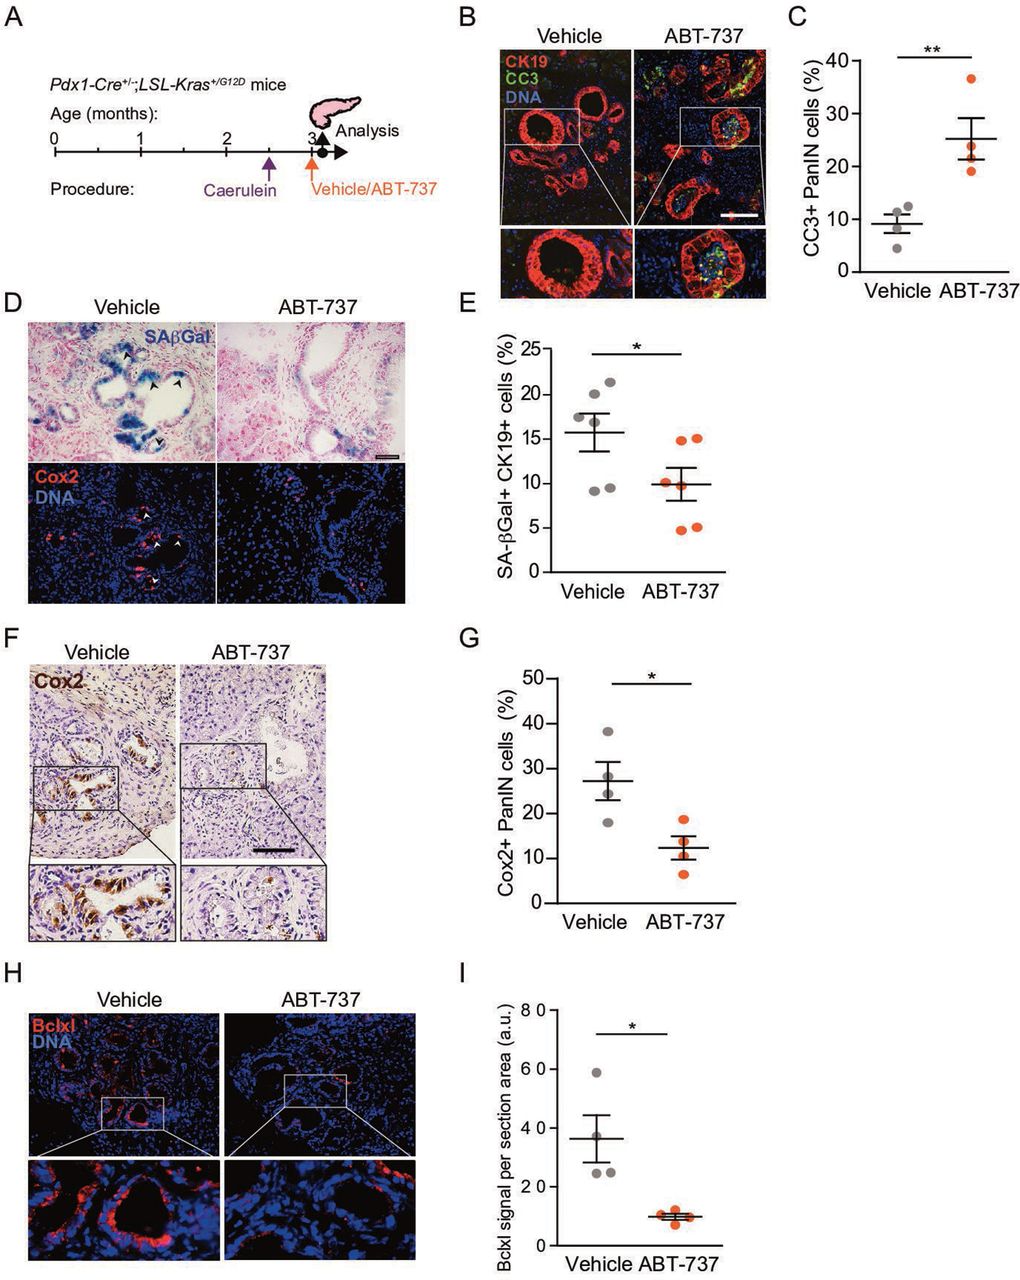
Bcl2-family protein inhibition reduces the numbers of senescent Cox2+ cells. (A) Timeline of treatments and analysis of Pdx1-Cre+/–; LSL-Kras+/G12D mice, including the caerulein treatment point, followed by treatment with ABT-737 2 weeks subsequently, and analysis of mice 2 days later. (B) Pancreas sections from mice treated with ABT-737 or vehicle stained for cleaved caspase-3 (CC3, green), and for CK19 (red). (C) Percentage of CC3+ cells in PanINs from mice treated with ABT-737 or vehicle, quantified by image scoring. Values indicate mean across n=4 mice per group, ±SE. (D) Serial sections from same mice stained for SA-βGal (blue, top) and Cox2 (red, bottom). Arrowheads indicate representative regions of colocalisation. (E) Percentage of SA-βGal+ cells out of CK19+ cells in pancreata from same mice, quantified by imaging cytometry. Values indicate mean across n=6 mice per group, ±SE. (F) Pancreas sections from ABT-737 and vehicle-treated mice stained for Cox2 (brown). (G) Percentage of Cox2+ cells in PanINs from same mice, quantified by image scoring. Values indicate mean across n=4 mice per group, ±SE. (H) Pancreas sections from ABT-737- and vehicle-treated mice stained for Bclxl (red). (I) Bclxl stain per section in PanINs from same mice, quantified by image analysis, scoring red signal per section area. Values indicate mean across n=4 mice per group, ±SE. *P<0.05, **P<0.01, t-test. a.u., arbitrary units; CC3, cleaved caspase 3; PanINs, pancreatic intraepithelial neoplasia.
Removal of senescent cells decreases PanIN formation and progression to PDAC
We next assessed whether targeting of the senescent PanIN cells influences disease development. To do this, we tested the effects of periodic ABT-737 treatment during the course of tumourigenesis. Starting at the age of 3 months, we injected caerulein-treated Pdx1-Cre+/-; LSL-Kras+/G12D mice with ABT-737 for two consecutive days each month, over 4 months, and then euthanised the animals (figure 6A, point 1). We reasoned that such intermittent treatment may be informative as to the effects of senescent cell clearance on the tumourigenic process. ABT-737-treated mice showed dramatically reduced lesion formation compared with vehicle-treated mice, with no evident systemic toxicity (figure 6B,C). Along with the marked reduction in PanIN formation, a significant drop in the expression of inflammatory cytokines, detected by cytokine arrays, was observed in the treated mice (figure 6D). We did not detect changes in the percentage of cells expressing Dclk1, which marks a putative cancer-initiating cell subpopulation39 (online supplemental figure 7), indicating that the decrease in presence of PanINs following ABT-737 treatment was not due to removal of this population. These findings indicate that targeting senescent cells through Bcl2 family inhibition suppresses PanIN development.

Elimination of senescent cells blocks PanIN development and reduces PDAC incidence. (A) Timeline of caerulein and repeated ABT-737 treatments during PanIN and PDAC formation period. ABT-737 was administered for 2 days every month, for four consecutive months, and mice were either sacrificed after the last treatment (point 1), or maintained for a further 3.5 months (point 2). (B) Representative images of pancreatic sections from time point one stained for CK19, SA-βGal and CD45, labelling hematopoietic cells. (C) Percentage of tissue area containing ADM and PanIN lesions in mice treated with ABT-737 (n=6) or vehicle (n=3). Values indicate mean per group ±SE. (D) Levels of cytokines and chemokines in pancreata of Pdx1-Cre+/-; LSL-Kras+/G12D mice treated with ABT-737, as measured by cytokine array. Values are shown relative to levels in vehicle-treated mice (pool of 3 mice per group). (E) Percentages of mice treated with ABT-737 or with vehicle that showed PDAC formation upon sacrifice at time point 2. Images show representative whole pancreas from mice in each group. Arrow indicates a large PDAC lesion. *P<0.05, χ2 test between ABT-737 and vehicle treated groups. (F) Pancreas to body-weight ratio in same mice as in (E). Values indicate mean across mice ±SE, n numbers as in (E). (G) Representative images of pancreatic sections from time point two stained as indicated. (H) Percentage of tissue area occupied by ADM, PanINs or PDAC in the same mice. *P<0.05, t test. ADM, acinar to ductal metaplasias; ns, not significant; PanIN, pancreatic intraepithelial neoplasia; PDAC, pancreatic ductal adenocarcinoma.
We next tested whether targeting of senescent cells by ABT-737 during early stages of tumourigenesis influences the ability of PanINs to progress to carcinoma. We treated Pdx1-Cre+/-; LSL-Kras+/G12D mice, subsequent to caerulein exposure, with monthly ABT-737 injections for 4 months, and then maintained the mice untreated for an additional 3.5 months (figure 6A, point 2). At this time point 71% of vehicle-treated mice developed PDAC, displaying large solid tumours and increased pancreas size; in contrast, only 25% of the ABT-737-treated mice developed carcinomas (figure 6E–G and online supplemental figure 8). Histological analysis revealed a dramatic decrease in the pancreatic area occupied by PDAC in the treated mice (figure 6H). Together these findings indicate that senescent cells provide essential support to the development and progression of PanINs to carcinoma, at least in part through their expression of Cox2, and that these cells can be effectively eliminated through Bcl2-family inhibition leading to reduction in tumourigenesis.
Discussion
Mortality rates from PDAC remain extremely high, due to late-stage diagnosis and limited treatment options.18 19 This dire state calls for further detailed dissection of the course of development of the disease, so that new therapeutic windows and methods for disease prevention can be identified. Here, we provide findings suggesting that senolytic treatment could represent a novel preventive treatment course for PDAC.
We uncovered a collaborative interaction between cell subsets within PanINs, in which senescent, non-dividing cells, stimulate lesion growth and progression, mediated, at least in part, by the proinflammatory Cox2 enzyme. Blocking this activity, or eliminating the senescent cells, dramatically reduced the growth of PanINs, indicating that this interaction is essential at this early phase of tumourigenesis. These findings shed light on the dual role of senescent cells in the development of pancreatic cancer: while PanIN cells entering senescence are likely unable to convert to dividing tumour cells, their retention in the microenvironment provides essential support to the non-senescent precancerous cells. As patient lesions progress to malignancy, however, tumour cells may become independent of this necessary support and inactivating mutations in the senescence-inducers p53 and p16 provide a proliferative advantage.
We show here that treatment with the Bcl2 family inhibitor ABT-737, one of the most effective senolytic courses identified to date,3 14 15 can target Cox2-expressing senescent cells within PanINs, and that periodic treatment dramatically reduces PanIN formation and progression. This is particularly striking in light of the intermittent nature of the treatment, as opposed to continuous therapy: 2 days of treatment monthly were sufficient to achieve a strong antitumourigenic effect.
The importance of inflammatory signalling pathways in pancreatic cancer has been described in multiple studies, and chronic pancreatitis is a major risk factor for the disease.20 21 The NFκB pathway was shown to provide important contributions to proinflammatory activation in the context of Ras-driven disease.24 40 Cox2, its direct target,41 appears to be a key component of protumourigenic inflammation in the pancreas, and its overexpression is sufficient to induce the formation of premalignant lesions in mice.23 24 32 We show here that the protumourigenic contribution of Cox2 is provided by a subset of premalignant cells, namely non-dividing senescent cells, rather than proliferating tumour cells, indicating a ‘division of labour’ at this early stage of tumourigenesis. Cox2 was described as a component of the SASP,5 and it represents a contribution of senescence to the disease at this early stage. Consistent with previous work,26 however, we found that senescence markers did not fully overlap at the individual cell level, with a somewhat different distribution of expression of Cdkn2a and Ptgs2 observed in the scRNA-Seq analysis, suggesting that the Cox2+ cells are a subset among several types of non-dividing cell states within lesions.33
The Ptf1a-CreER model, in which oncogenic Kras is activated in acinar cells, provides rapid PanIN formation in the absence of external induction of inflammation. In this model, we found that pharmacologic inhibition of Cox2 through sulindac, a non-steroid anti-inflammatory drug, dramatically inhibited PanIN growth, suggesting that the Cox2+ cells provide the major protumourigenic inflammatory drive, essential for disease development. The Pdx1-Cre driven model requires external induction of inflammation, by acute 2-day treatment with caerulein, for timely and synchronous PanIN formation. These lesions contained senescent cells in similar numbers as those in the Ptf1a-CreER mice. While we did not test the effects of subsequent sulindac treatment in this model, it is remarkable that the senolytic treatment had a similar effect to that of sulindac and reduced inflammatory cytokine secretion, indicating that even subsequent to a tumour-promoting acute pancreatitis event, continuous production of inflammatory signals by senescent cells is essential for lesion growth. Previous work showed that when Kras-expressing mice are exposed to chronic caerulein-induced pancreatitis, conducted over 3 months, senescent cells do not appear with lesions, and lesions progress more rapidly.23 In the presence of chronic inflammation, senescent cells may, therefore, offer no added inflammatory benefit, yet limit lesion growth, and as such are out-selected. Interestingly, this work also found that the senescent cells reappear within lesions following cessation of pancreatitis,23 consistent with our findings.
The overall contribution of senescence and the SASP to lesion development could occur through direct stimulation of neighbouring cells, or indirectly through modification of the tumour microenvironment. While we did not detect increased proliferation rates of cells in the immediate vicinity of the Cox2+ cells (data not shown), direct stimulation cannot be excluded. The presence of senescent stromal cells may also represent a form of interaction of senescent cells with the microenvironment and a potential contribution to tumour formation, areas that require further dissection. Due to the systemic delivery of the treatments we cannot exclude their potential effects on additional cell types, including senescent stromal cells. However, our tissue section stains indicate that the primary cells undergoing apoptosis in response to ABT-737 treatment are the senescent PanIN cells.
Overall, further studies should provide a more detailed analysis of the identity and characteristics of the senescent cell subtypes that exert protumourigenic effects, and of their mechanisms of action, through Cox2, SASP or other means. Future work should address the potential effects of the senolytic treatments on additional cell types, such as senescent Cox2-negative cells, and cells in the tumour microenvironment.
Senolytic treatments are currently entering clinical trials in several age-related diseases.3 The potential for senolytic drug treatment in cancer is currently beginning to be explored. Usage of senolytics in various cancer settings requires a detailed understanding of the context in which senescence occurs among tumour cells and stromal components, and of the roles senescent cells carry out, knowledge that is currently lacking. We recently showed that senolytic treatment ameliorates senescence-induced epidermal hyperplasia and dysplasia reminiscent of actinic keratosis.13 The current study suggests that senolytic treatment, under a periodic protocol, could be considered as preventive therapy in patient populations at high risk for PDAC development, or in which early disease is suspected due to other conditions, such as pancreatitis. The high prevalence of PanIN lesions in the healthy ageing population, and their increased rates in hereditary pancreatitis patients,27–29 suggest that specific populations could benefit from therapy aimed at reducing the growth and progression potential of PanINs, a concept that could potentially be extended to other premalignant diseases.
Methods
Mice
The following mouse lines were obtained from The Jackson Laboratory, maintained in a specific pathogen-free environment throughout the study, and crossed as indicated: Ptf1a-CreER (C57Bl6), Pdx1-Cre (C57Bl6), LSL-Kras+/G12D (mixed C57Bl6, 129sv), LSL-tdTomato (Strain Ai14, C57Bl6). For inducible Kras activation in acinar cells, Ptf1a-CreER; LSL-Kras+/G12D; LSL-tdTomato triple transgenic mice and controls were injected at 6 weeks of age subcutaneously with two doses of tamoxifen (Sigma) at 400 mg/Kg to activate Cre-mediated recombination. Assessment of the recombination of the LSL-Kras+/G12D allele was performed by semi-quantitative PCR on genomic DNA extracted from FACS-isolated tdTomato+ cells and calculation of recombined vs. non-recombined product fraction, measured by image analysis of gel using ImageJ software. For BrdU labelling mice were injected intraperitoneally with 100 mg/Kg BrdU 2 hours prior to sacrifice. For Cox2 inhibition following Kras activation, Ptf1a-CreER; LSL-Kras+/G12D; LSL-tdTomato mice received 0.6 mg/mL of sulindac (Sigma S4429) dissolved in drinking water, supplemented by 5 mg/mL sucrose to compensate for bitterness, starting 15 weeks after Kras activation. For the induction of pancreatitis, Pdx1-Cre; LSL-Kras+/G12D mice and controls received 7 hourly intraperitoneal injections of caerulein per day for 2 days with a 1 day recession in between. Caerulein (Sigma, C9026) was diluted in phosphate buffered saline (PBS) and injected at 50 µg/Kg body weight. For senescent cell elimination, Pdx1-Cre; LSL-Kras+/G12D mice, starting 2–3 weeks after caerulein treatment, received intraperitoneal injections of ABT-737 (25 mg/Kg) on two consecutive days. Where indicated, injections were repeated in 1-month intervals. ABT-737 (WuXi AppTec) was dissolved in DMSO and prepared in a working solution of 30% propylene glycol, 5% Tween 80, 3.3% dextrose in water pH 4–5. Both male and female mice were used in experiments. Genomic DNA sequence was performed for the Trp53 locus encoding p53 and no mutations were identified by BLAST comparison to the reference genome.
Histology, immunohistochemistry and cytokine array
Dissected pancreata were either formalin fixed and paraffin embedded, or frozen in OCT solution for cryosectioning. The 5–7 µm paraffin sections were stained by standard procedures using ImmPress reagent kit (Vector #MP-7401/7402) and DAB Peroxidase Substrate Kit (Vector Laboratories), or conjugated fluorescent secondary antibodies (Jackson). The following antibodies were used: Ki67 (NeoMarkers RM9106S0), E-cadherin (BD Pharmingen 610182), tdTomato (anti dsRed, Clontech 632496), BrdU (BioRad MCA2060), Cox2 (Abcam ab179800), p16 (Santa Cruz sc-1207), Bclw (Cell signalling 31H4), Bclxl (Cell Signalling 54H6), Bcl2 (Abcam, ab182858), Cytokeratin 19 (DSHB TROMA III), CC3 (Cell signalling 9661), CD45.2 (Biolegend 109802), p53 (Santa Cruz Fl393), Vimentin (Abcam ab24525), F4/80 (Biolegend 123109) and Dclk1 (Abcam ab31704). For SA-βgal stains 10 µm Frozen tissue sections were fixed with 0.5% glutaraldehyde in PBS for 15 min, washed with PBS supplemented with 1 mM MgCl2, and incubated for 12–16 hours in X-Gal staining solution (1 mg/mL X-Gal, 5 mM potassium ferrocyanide, 5 mM potassium ferricyanide and 1 mM MgCl2 in PBS at pH 5.5). Sections were counterstained with Nuclear Fast Red (Sigma), dehydrated and mounted with xylene based mounting solution (Eukitt). Alcian blue solution (Bio-Optica 04–1 60 802) was used for detection of PanIN through mucopolysaccaride staining, done for 30 min at room temperature, followed by hematoxylin counterstain. Images were collected on an Olympus DP71 microscope, an Olympus CX41 confocal microscope or a Zeiss LSM710 confocal microscope. Cells positive for stained proteins were scored as fraction of PanIN cells or total cells in microscopic field on 3–6 fields per mouse using the Cell Counter plugin within the Cookbook extension of FIJI 1.51 j. Calculation of Alcian blue-positive area, and of Bclxl stain, was done by measuring the area of the field stained above a defined threshold using ImageJ 1.51 k. For cell size analysis sections were co-stained for Cox2 and E-cadherin to label cell margins, and cell circumferences were traced using ImageJ. Assessment of ADM, PanIN and PDAC formation was conducted on hematoxylin and eosin stained sections, with manual scoring of whole tissue sections in vehicle versus ABT-737-treated mice, conducted by expert pathologists. To measure cytokine expression levels, pooled lysates from pancreata of ABT-737- and vehicle-treated mice, 3 per group, were tested with an ARY006 mouse cytokine array kit (R&D Systems) according to the manufacturer’s instructions.
FACS analysis
For mouse pancreas dissociation into single cell suspensions, pancreata were minced with scissors and incubated with trypsin-EDTA for 10 min at 37°C, followed by treatment with collagenase P (Sigma, 11213857001) 1 mg/mL for 20–30 min at 37°C, and then filtered through 70 and 40 μm filters. Purified cells were incubated with the fluorescent β-galactosidase substrate C12FDG (Invitrogen D-2893) at 33 µM for 1 hour at 37°C, followed by sorting based on C12FDG and tdTomato or Epcam fluorescence, using an Aria III sorter (BD Biosciences), with gating for CD31– and CD45– cells to exclude endothelial and immune cells. Imaging flow cytometry was performed as previously described,42 and imaged by ImageStreamX flow cytometry (Amnis). Antibodies used for FACS: Cd45 (eBiosciences 25-0451-82), Cd31 (eBiosciences 17-0311-80), Epcam (Biolegend 118212), Cd140a (Biolegend 135919), Pdpn (Biolegend 127423), F4/80 (Biolegend 123117) and CK19 (DSHB TROMA III).
RNA extraction and RNA-seq
For mRNA-seq we isolated tdTomato+SA-βGal– and tdTomato+SA-βGalhigh fractions from three mice, gated to exclude endothelial and immune cells (CD31–, CD45–). Total RNA from FACS-sorted cells was isolated by TRIzol (Invitrogen) extraction followed by RNeasy Plus Micro Kit (Qiagen), using >10 000 cells of each sample. Profiling was conducted using an adapted CEL-Seq2 protocol: 3’ cDNA was synthesised and barcoded, followed by RNA synthesis, amplification by in vitro transcription and library generation for paired-end sequencing. Reads were demultiplexed, quality filtered and trimmed for adapters and poly-A tail using Cutadapt and aligned with the mouse genome (GRCm38) using Tophat2. Differentially expressed genes were determined by DESeq2, using a PAdj <0.1 cut-off. Enrichment for upregulated and downregulated gene sets was conducted by Ingenuity Pathway Analysis (Qiagen) using PAdj <0.1, and by GSEA, testing gene sets from the hallmark collection of the molecular signatures database and gene sets of upregulated genes in senescent Hras-expressing human IMR90 fibroblasts9 and senescent mouse stellate cells.8 The same analysis was conducted on tdTomato+ cells isolated from KRas-expressing mice treated with sulindac for 3 days or untreated. Single cell RNA-Seq data acquisition and analysis was described in Schlesinger et al,33 and was conducted on pancreata isolated from Ptf1a-CreER; LSL-Kras+/G12D; LSL-tdTomato mice at indicated time points after Kras activation, as well as from control Ptf1a-CreER; LSL-tdTomato mice. Data shown includes only the epithelial cell clusters. We used Seurat R package (V.2.3.4) to perform graph-based unsupervised clustering, uniform manifold approximation for data analysis and visualisation in two-dimensional space.
Statistical analysis
Two-tailed unpaired Student’s t-test and analysis of variance were used for mouse group comparisons.
Data availability statement
Data are available in a public, open access repository. mRNA-seq expression profiles were deposited inthe Gene Expression Omnibus (GEO) database, accession number GSE128319 (https://www.ncbi.nlm.nih.gov/geo/query/acc.cgi?acc=GSE128319). scRNA-Seq data are available at GSE141017 (https://www.ncbi.nlm.nih.gov/geo/query/acc.cgi?acc=GSE141017). There are no conditions for access or usage.
Ethics statements
Patient consent for publication
Ethics approval
All experiments were approved by the Joint Institutional Animal Care and Use Committee of the Hebrew University and Hadassah Medical Center, and by the Weizmann Institute Institutional Animal Care and Use Committee.
Acknowledgments
We thank Yelena Piontek and Norma E. Kidess-Bassir for histological preparation, Malka Chaouat and Zippora Shlomai for experimental advice, Yuval Nevo for bioinformatics assistance, and Yael Gabai for image analysis.
References
Supplementary materials
Supplementary Data
This web only file has been produced by the BMJ Publishing Group from an electronic file supplied by the author(s) and has not been edited for content.
Footnotes
DK-G, LR and YO contributed equally.
Contributors DK-G, LR, YO, YD, GZ, IB-P and VK designed the study and wrote the manuscript, DK-G, LR and YO conducted the experiments, NA, BA, SH, RK, YK, AH-G, AI, and YD assisted in experimentation and analysis, EW, HB, and SE conducted bioinformatic analyses, AASK, KM, KA and EP conducted pathological analyses, YS and OP conducted the scRNA-seq study and analysis.
Funding This study was supported by donations from Barbara R. Newman in memory of Daniel Newman (GZ), Brenda B. Johnston in memory of Theodore A. Johnston (GZ), and grants from the Israel Science Foundation (1009/13, IB-P), the Israel Science Foundation Morasha programme (1245/16, IB-P.), the Israel Science Foundation-Broad Institute programme (2621/18, IB-P.), the Chief Scientist of the Israel Ministry of Health (3–15017, IB-P), the Alex U. Soyka Programme (IB-P and YD) the Israel Cancer Research Fund (ICRF) Project Grant (GZ), the Israel Science Foundation-Canada programme (2633/17, VK), Sagol Institute for Longevity Research, QuinQuin Foundation, Rising Tide Foundation and Thompson Family Foundation (VK) and the European Research Council under the European Union’s FP7 and H2020 (309688 and 856487, VK).
Competing interests VK is an author of patents on senolytics and senolytic approaches and consultant for Sentaur Bio.
Provenance and peer review Not commissioned; externally peer reviewed.
Supplemental material This content has been supplied by the author(s). It has not been vetted by BMJ Publishing Group Limited (BMJ) and may not have been peer-reviewed. Any opinions or recommendations discussed are solely those of the author(s) and are not endorsed by BMJ. BMJ disclaims all liability and responsibility arising from any reliance placed on the content. Where the content includes any translated material, BMJ does not warrant the accuracy and reliability of the translations (including but not limited to local regulations, clinical guidelines, terminology, drug names and drug dosages), and is not responsible for any error and/or omissions arising from translation and adaptation or otherwise.