Article Text

Abstract
Objective Intrahepatic cholangiocarcinoma (iCCA) is rising in incidence, and at present, there are limited effective systemic therapies. iCCA tumours are infiltrated by stromal cells, with high prevalence of suppressive myeloid populations including tumour-associated macrophages (TAMs) and myeloid-derived suppressor cells (MDSCs). Here, we show that tumour-derived granulocyte–macrophage colony-stimulating factor (GM-CSF) and the host bone marrow is central for monopoiesis and potentiation of TAMs, and abrogation of this signalling axis facilitates antitumour immunity in a novel model of iCCA.
Methods Blood and tumours were analysed from iCCA patients and controls. Treatment and correlative studies were performed in mice with autochthonous and established orthotopic iCCA tumours treated with anti-GM-CSF monoclonal antibody.
Results Systemic elevation in circulating myeloid cells correlates with poor prognosis in patients with iCCA, and patients who undergo resection have a worse overall survival if tumours are more infiltrated with CD68+ TAMs. Mice with spontaneous iCCA demonstrate significant elevation of monocytic myeloid cells in the tumour microenvironment and immune compartments, and tumours overexpress GM-CSF. Blockade of GM-CSF with a monoclonal antibody decreased tumour growth and spread. Mice bearing orthotopic tumours treated with anti-GM-CSF demonstrate repolarisation of immunosuppressive TAMs and MDSCs, facilitating T cell response and tumour regression. GM-CSF blockade dampened inflammatory gene networks in tumours and TAMs. Human tumours with decreased GM-CSF expression exhibit improved overall survival after resection.
Conclusions iCCA uses the GM-CSF-bone marrow axis to establish an immunosuppressive tumour microenvironment. Blockade of the GM-CSF axis promotes antitumour T cell immunity.
- cholangiocarcinoma
- immunotherapy
- macrophages
- immune response
- inflammatory mediators
Data availability statement
Data are available on reasonable request. Data available from David C Linehan by requests. David_Linehan@urmc.rochester.edu.
This is an open access article distributed in accordance with the Creative Commons Attribution Non Commercial (CC BY-NC 4.0) license, which permits others to distribute, remix, adapt, build upon this work non-commercially, and license their derivative works on different terms, provided the original work is properly cited, appropriate credit is given, any changes made indicated, and the use is non-commercial. See: http://creativecommons.org/licenses/by-nc/4.0/.
Statistics from Altmetric.com
Significance of this study
What is already known on this subject?
Intrahepatic cholangiocarcinoma (iCCA) is characterised by a prominent fibroinflammatory tumour stroma that plays a key role in therapeutic resistance.
The stroma is infiltrated with an abundance of myeloid cells including tumour-associated macrophages (TAMs) and myeloid-derived suppressor cells (MDSCs), which support tumour growth and suppress antitumour immunity.
Few immunocompetent models exist for studying mechanisms by which iCCA establishes the stromal barrier, and less is known about mechanisms through which iCCA drives chronic inflammation and recruitment of innate immune cells.
What are the new findings?
In iCCA, the majority of immunosuppressive cells within the tumour microenvironment (TME) are TAMs, and their elevated presence correlates with worse overall survival.
Tumour-derived granulocyte–macrophage colony-stimulating factor (GM-CSF) is a central mediator of myelopoiesis, recruitment and polarisation of TAMs, and its expression is prognostic in resected patients with iCCA.
Therapeutic blockade of GM-CSF restrained tumour growth in a spontaneous mouse model of iCCA resulting in extended survival.
Neutralisation of GM-CSF decreased TAMs and functionally reprogrammed myeloid cells in a novel orthotopic model of iCCA, facilitating enhanced cytotoxic T cell responses.
GM-CSF blockade reverses induction of chronic inflammatory pathways within the TME and alternative polarisation of TAMs.
Significance of this study
How might it impact on clinical practice in the foreseeable future?
GM-CSF is a central mediator of tumour orchestrated chronic inflammation, and targeting TAMs and MDSCs with GM-CSF blockade represents a novel approach for reversing the immunosuppressive TME and sensitising iCCA to antitumour adaptive immunity.
Introduction
Intrahepatic cholangiocarcinoma (iCCA) is the second most common primary liver malignancy, with rising incidence worldwide.1 Unfortunately, most patients present in an advanced stage and are not candidates for curative surgery.2 3 Currently, pyrimidine analogues in combination with platinum chemotherapy are the mainstay of systemic therapy.4 5 However, response to chemotherapy is limited resulting in 5-year survival rates of less than 10%.6
iCCA is histologically dominated by a prominent tumour stroma composed of dense networks of extracellular matrix, replete with non-cancerous inflammatory immune cells and fibroblasts.7 The tumour stroma interacts with the malignant biliary epithelium and forms a barrier to treatment by promoting tumour growth, immune evasion and chemotherapeutic resistance.8–10 Indeed, biliary cancers have been described as a chronic wound—the cancer thriving off of the dysregulated wound repair programme.11–13 Thus, we hypothesise that immunotherapeutic approaches that address the chronic inflammatory tumour stroma may yield new breakthroughs by reprogramming the immunosuppressive tumour microenvironment (TME) characteristic of iCCA.
In this report, we detail the prognostic impact of monocytic and granulocytic leucocyte mobilisation from the bone marrow and recruitment to the TME of iCCA. Furthermore, we describe the immunosuppressive potential of tumour-associated macrophages (TAMs) within the TME of iCCA under the orchestration of iCCA-derived granulocyte–macrophage colony-stimulating factor (GM-CSF). We found that therapeutic blockade of GM-CSF impaired tumour growth and prolonged survival of mice with autochthonous tumours driven by KrasG12D and loss of Trp53. Mechanistically, we discovered inhibition of GM-CSF suppressed tumour-orchestrated myelopoiesis, monocyte mobilisation and polarisation of immunosuppressive TAMs, while preventing compensatory influx of myeloid-derived suppressor cells (MDSCs). Finally, the alleviation of myeloid immunosuppression in iCCA tumours facilitated infiltration of cytotoxic T cells with enhanced activation.
Methods
Autochthonous iCCA murine studies
The LSL-KrasG12D; Trp53Flox/Flox; Alb-Cre (KPPC) mouse of spontaneous iCCA was previously described.14 15 Mice were surveilled for disease onset using high frequency ultrasonography (US) with a Vevo 3100 Imaging System (FUJIFILM VisualSonics). Mice with newly diagnosed tumours were serially enrolled into treatment with anti-granulocyte–macrophage colony-stimulating factor (ɑGM-CSF) or rat IgG2a isotype control (IgG) (BioXcell: ɑGM-CSF, clone MP1-22E9; IgG, clone 2A3) antibodies, and each group was injected intraperitoneally (IP) with 30 mg/kg of antibody every 2 days. Three-dimensional US images were obtained weekly, and volumetric reconstruction was performed with Vevo LAB Software (FUJIFILM VisualSonics). iCCA histopathology was confirmed postmortem by a board-certified pathologist. All animal studies were approved by the University Committee on Animal Resources.
Human peripheral blood and tumour analyses
An Institutional Review Board approved review of patients with biliary cancers treated at the University of Rochester Medical Center between 2011 and 2018 was performed. Patients’ clinicopathological data were extracted from the electronic medical record to compare complete blood count and circulating immune cell differential at the time of diagnosis and prior to systemic or surgical treatment (online supplemental tables 1 and 2). Archived tissue blocks of liver-invasive tumours and adjacent liver specimens were selected to include the tumour and adjacent liver parenchyma when available. ‘Normal’ tissue blocks were selected from uninvolved liver sectors from patients with liver malignancy or benign masses.
Supplemental material
Histology, immunohistochemistry and immunofluorescence
Formalin-fixed paraffin-embedded (FFPE) tissue blocks were sectioned at 5 µm. Tissue sections were deparaffinised in xylene and rehydrated with sequential changes of graded ethanol in water. Trichrome staining was performed using standard histology protocols, and Picro-Sirius Red (Polysciences) staining was performed per the manufacturer’s instructions.
For immunohistochemical (IHC) analysis, endogenous peroxidases were quenched with 3% hydrogen peroxide and heat-induced antigen retrieval was performed in citrate (bioWORLD) or high pH (Invitrogen) buffers. Non-specific background was blocked with Serum-Free Protein Block (Agilent Technologies), and sections were incubated in primary antibodies listed in online supplemental table 3 diluted in Antibody Diluent (Agilent Technologies) overnight at 4°C. IHC staining was visualised with Polink-2 Plus HRP (GBI Labs) or VECTASTAIN ABC-HRP (Vector Laboratories) kits with DAB chromagen per the manufacturer’s instructions.
For immunofluorescence, specimens were embedded in optimal cutting temperature (OCT) medium and stored at −80°C. Sections were cut at 5 µm and fixed in ice cold methanol. Sections were blocked with Serum-Free Protein Block and incubated in primary antibodies listed in online supplemental table 3 overnight at 4°C. Sections were washed with PBS and stained with Alexa Fluor 488 goat anti-rabbit and Alexa Fluor 555 goat anti-rat secondary antibodies (ThermoFisher). Coverslips were mounted with VECTASHIELD Mounting Medium with DAPI (Vector Laboratories).
Brightfield and fluorescent images were captured with a BX43 microscope equipped with a DP80 camera (Olympus). For whole section analysis, slides were scanned with a 20× objective using an Aperio VERSA scanner and staining intensity quantified with the Aperio Positive Pixel Algorithm V.9 (Leica Microsystems).
Murine cell lines and orthotopic iCCA studies
Murine iCCA cell lines 335, 339, 476 and 2081 were previously described.14 To generate syngeneic iCCA tumour cell lines, congenic LSL-KrasG12D , Tp53Flox and Alb-Cre mice on a C57BL/6 background were intercrossed to generate KPPC mice. KPPC tumours were disaggregated into single-cell suspensions and cultured on collagen I coated plates (Corning) in RPMI (Gibco) supplemented with 10% FBS (Corning). Cell lines were passaged three to five times, and iCCA was histologically confirmed by a board-certified pathologist.
For orthotopic studies, 60 000 University of Rochester Cholangiocarcinoma (URCCA) 4.3 cells were mixed 2:1 in a PBS:matrigel matrix (Corning) solution and injected in the left hepatic lobe of 6–8 week old C57BL/6 mice. Disease onset was confirmed via US 2 weeks postimplantation, and mice were dosed with IgG or ɑGM-CSF as described above for up to 4 weeks. For T cell depletion studies, mice were dosed with 600 µg of anti-CD8 antibody (BioXcell, clone 2.43) and 600 µg of anti-CD4 antibody (BioXcell, clone GK1.5) IP prior to orthotopic tumour implantation followed by 250 µg doses of each antibody every 4–5 days.
Colony-forming unit assays
Bone marrow (BM) and spleen colony-forming unit assays were performed with Methocult GF3434 medium (Stemcell Technologies) per the manufacturer’s instructions.
Quantitative real-time PCR analysis
Tumour tissue was snap frozen in liquid nitrogen and homogenised in Trizol (ThermoFisher) with a TissueLyser LT (Qiagen). Total RNA was extracted from homogenised tissue or macrophage lysates with RNeasy Mini Kits (Qiagen). RNA was reverse transcribed into cDNA using High-Capacity RNA-to-cDNA Kits and qRT-PCR analysis performed with TaqMan Fast Universal PCR Master Mix and predesigned TaqMan Gene Expression Assays (ThermoFisher). Gene expression was normalised to GAPDH, HPRT1 or β-Actin using the comparative CT (ΔΔCT) method.
Luminex assays
Syngeneic cell lines were cultured at 100 000 cells per 6-well in complete medium and incubated for 72 hours. Supernatants were passed through a 0.2 µm filter and analysed for secreted factors per the manufacturer’s specifications (R&D Systems).
Flow cytometry analysis
Single-cell suspensions and whole blood were blocked with TruStain FcX Antibody (Biolegend) and stained with fluorophore-conjugated antibodies listed in online supplemental table 3 using standard flow cytometry staining protocols. Flow cytometry acquisition was performed on an LSRII (BD Biosciences) and analysed using FlowJo V.10.6.1.
BM-derived macrophage assays
BM cells were isolated by centrifugation of femurs from C57BL/6 mice (Jackson Laboratories) and lysed with RBC Lysis Buffer (Biolegend). CD11b+ cells were selected with CD11b MicroBeads (Miltenyi Biotec) per the manufacturer’s instructions. Cells were plated in cell culture-treated petri dishes in complete media containing 40 units of recombinant murine M-CSF (PeproTech) for 72 hours to produce BM-derived macrophages. iCCA cell lines were plated at 25% confluency in complete media and cultured for 72 hours. Tumour-conditioned media was harvested and filtered through a 0.2 µm filter. BM-derived macrophages were cultured in standard or tumour-conditioned media mixed 1:1 with standard media for 72 hours. Cells were washed with PBS and lysed with RLT Buffer (Qiagen).
RNA-sequencing and pathway analysis
For human sequencing studies, 50 µm FFPE scrolls were cut from patients’ archived tumour specimens in RNAse free conditions, and samples were prepared for RNA-sequencing using the KAPA RNA HyperPrep Kit with RiboErase (HMR) (Roche). Expression was quantified using Salmon V.0.9.116 with hg38 RefSeq genes. Log2 transformed transcripts per million were used in downstream analysis. Heatmaps were created using pheatmap V.1.0.12. Human microenvironment cell population (MCP) counter analysis was performed as previously described.17
For mouse sequencing studies, RNA expression libraries were generated with TruSeq Stranded mRNA kits per the manufacturer’s instructions and sequencing was performed on a NextSeq 500 or NovaSeq platform (Illumina). RNA reads were aligned with GRCm38 and gene counts generated with STAR (V.2.6.0a or V2.7.3a). Differentially expressed protein-coding genes (DEGs) between treated and control groups were identified with DESeq2 (V.1.30.0). Mouse MCP counter analysis was performed as previously described.18 Using all significant DEGs (p<0.05), gene set over representation analysis of Gene Ontology (GO) terms was performed with ClusterProfiler (V.3.18.0). Hallmark Mus musculus gene sets were obtained from msigdbr V.7.4.1. for gene set enrichment analysis with ClusterProfiler (V.3.18.0).19
Statistical analysis
Continuous variables were tested for differences with the Wilcoxon rank-sum test or Mann-Whitney U Test. Categorical variables were tested using the χ2 test. Tumour growth curves were modelled using a linear mixed-effect regression and slopes compared using the Welch-Satterthwaite t-test. Kaplan-Meier curves were compared using the log-rank test, and most significant population cutoffs were determined using the survminer package (The Comprehensive R Archive Network). Univariate and multivariate Cox proportional hazard models were constructed for clinicopathological characteristics. Spearman’s rank correlation coefficient was computed between patients’ Model of End-Stage Liver Disease (MELD) score and peripheral blood counts. Patients with mortality within 30 days of surgery were excluded from human survival analysis. Statistical analysis was performed on GraphPad Prism (V.9.0), R (V.4.0.3) or JMP Pro (V.14.3.0). Statistical significance was established at p<0.05.
Results
Fibroinflammatory tumour stroma characterises human iCCA
Human iCCA is profoundly desmoplastic, and the tumour epithelium constitutes a minority of the tumour mass. The majority of the tumour tissue is instead composed of dense extracellular matrix (ECM) components and is robustly infiltrated with CD45+ inflammatory leucocytes (figure 1A). To better characterise the leucocyte infiltrate in iCCA, we performed whole-section automated IHC analysis for immune markers on tissue sections from patients’ resected tumour specimens. Digital analysis of myeloid markers revealed that iCCA tumours are dominantly infiltrated by CD68+ macrophages and CD15+ granulocytes (figure 1B,C). Conversely, analysis of T cell markers demonstrated that CD8+ effector T cells are less abundant within the core of the iCCA tumour mass and are instead limited to the margin of invasion and adjacent liver (figure 1B,C).

Human iCCA tumours feature a prominent desmoplastic reaction with elevated myeloid cells, and the prevalence of monocytic lineages systemically and locally correlate with overall patient survival. (A) Representative images compare H&E staining, cytokeratin 7 (CK7) IHC staining (biliary epithelial cells), trichrome staining (collagen; blue) and CD45 IHC staining (inflammatory leucocytes) in tissue sections from normal human liver and iCCA tumours. Images were acquired at 200x magnification. (B) Images show representative IHC staining for CD68 (TAM), CD15 (G-MDSC) and CD8 (cytotoxic T lymphocytes) in normal liver, tumour margins and iCCA tumour interiors. (C) Graphs compare the expression of CD68, CD15 and CD8 in central tumour regions (n=35), iCCA tumour margins (n=28) and normal liver uninvolved by tumour (n=15) after digital quantification of IHC staining for each marker using the Aperio positive pixel count algorithm. Bars depict means±SEM, and p values were determined by Mann-Whitney U test. **p<0.01 and ***p<0.001. (D) Graph shows Kaplan-Meier survival analysis of patients with unresectable CCA stratified by pretreatment CBC percent monocytes and lymphocytes into low (n=104) versus high (n=35) monocyte to lymphocyte ratios (M:L). Arrows indicate median overall survival of patients with low versus high M:L. (E) Graph shows Kaplan-Meier survival analysis of patients who underwent surgical resection for iCCA stratified by preoperative CBC percent monocytes and lymphocytes into low (n=8) versus high (n=27) monocyte to lymphocyte ratios (M:L). Patients with mortality within 30 days after surgery were excluded from the analysis. Arrows indicate median overall survival of patients with low versus high M:L. (F) CD68 IHC staining in tissue sections from surgically resected patient tumour specimens was digitally quantified, and a Kaplan-Meier survival analysis was performed after patient tumour CD68 staining intensities were stratified into low (n=20) and high (n=10) cohorts. Patients with mortality within 30 days after surgery were excluded from the analysis. Arrows indicate median overall survival of patients with low versus high CD68 staining. Kaplan-Meier p values were determined by log-rank test. CBC, complete blood count; CCA, cholangiocarcinoma, iCCA, intrahepatic cholangiocarcinoma; TAM, tumour-associated macrophage; G-MDSC, granulocytic myeloid-derived suppressor cell.
Notably, CD68+ TAMs represent the most abundant leucocyte within the tumour and margin of invasion (online supplemental figure 1D,E). Beyond prominently occupying the tumour itself, CD68+ macrophages are over-represented in the adjacent liver parenchyma compared with non-tumour adjacent liver parenchyma, suggesting a trophic relationship between the proliferating iCCA and CD68+ macrophages (online supplemental figure 1B).
Four immune subtypes of human iCCA have been identified using 14 gene signatures derived from the MCP counter.20 To evaluate immune subtype diversity using MCP gene signatures in the URMC cohort, we performed bulk RNA sequencing on archived human tumours that yielded RNA with sufficient quality for analysis. MCP analysis of sequenced tumour specimens demonstrated that iCCA is immunologically cold, featuring a paucity of gene signatures associated with adaptive immunity and a dominance of signatures associated with monocytic lineages, findings consistent with our IHC studies (online supplemental figure 2C). Hierarchical clustering of MCP gene signatures, however, demonstrated limited heterogeneity and represented no more than two subtypes within our cohort (online supplemental figure 2D).
Elevated circulating monocytes and TAMs portend poor survival
Given our observation of increased TAMs within and adjacent to iCCA tumours, we sought to understand the ramifications of peripheral mobilisation of monocytes. We discovered that the monocyte-to-lymphocyte ratio (M:L) of complete blood counts drawn at the time of diagnosis predicted overall survival in patients with unresectable CCA (figure 1D). This association was statistically significant when treated continuously in a univariate Cox model, in agreement with other reports identifying elevated peripheral blood myeloid cell trafficking as independent predictors of outcomes in patients with CCA (online supplemental table 2).21–23 Interestingly, the M:L at the time of diagnosis was also closely correlated with intrinsic liver dysfunction as measured by the MELD score for patients with unresectable CCA (online supplemental figure 2A). Multivariate Cox modelling, however, only identified chemotherapy or radiotherapy treatment and patients’ Eastern Cooperative Oncology Group performance status as independent predictors of overall survival at the time of diagnosis (online supplemental table 2), suggesting these clinical factors may outweigh the impact of M:L in our cohort.
Nonetheless, patients who underwent resection for iCCA exhibited improved overall survival when segregated into low versus high preoperative M:L levels (figure 1E). Moreover, CD68 IHC analysis showed that patients with a higher prevalence of TAMs experienced decreased overall survival after surgical resection (figure 1F). Additionally, these patients trended towards decreased recurrence-free survival when compared with patients with a lower prevalence of TAMs within the tumour microenvironement (TME) (online supplemental figure 1I).
Interestingly, although we observed similar prognostic trends when interrogating patients’ neutrophil-to-lymphocyte ratios (online supplemental figure 1F), correlative findings were not observed for granulocytic myeloid-derived suppressor cells (G-MDSC) within the TME (online supplemental figure 1G). Analysis of CD8+ T cell infiltration was also not prognostic in this limited cohort of resected iCCA patients (online supplemental figure 1H).
Autochthonous murine tumours recapitulate human iCCA
Histopathological staining and IHC analysis demonstrated that spontaneous hepatic tumours from KPPC mice replicated the features of human iCCA histopathology with high fidelity featuring a prominent desmoplastic reaction with an abundance of inflammatory leucocytes (figure 2A). In addition, immunofluorescence staining for myeloid markers showed a striking increase in F4/80+ monocytic and to a lesser extent Ly6G+ granulocytic myeloid cell subsets in tumours compared with controls, analogous to our findings in human (figure 2B).

Spontaneous iCCA tumours from KPPC mice recapitulate the desmoplastic and inflammatory features of human disease. (A) Representative images show H&E, CK7 IHC, trichrome and CD45 IHC staining of tissue sections from normal livers of littermate controls and established spontaneous iCCA tumours from KPPC mice. Images were acquired at 200× magnification. (B) Immunofluorescence images demonstrate representative staining for either F4/80+ TAM or Ly6G+ G-MDSC (red) with CK7 (green) and DAPI (nucleus, blue) in tissue sections from normal livers of littermate controls and established iCCA tumours from KPPC mice. Images were acquired at 400× magnification. (C) Representative flow cytometry plots show gating strategies for identifying myeloid cell subsets in normal livers from littermate controls and established iCCA tumours from KPPC mice. (D) Graph compares the prevalence of myeloid cell subsets by flow cytometry analysis in normal livers from littermate controls (n=13) versus those infiltrating established iCCA tumours from KPPC mice (n=12). Bars indicate means±SEM, and p values were determined by Mann-Whitney U test. ****P<0.0001.(E) Pie chart illustrates the prevalence of KPPC iCCA tumour-infiltrating immune cell subsets as a percent of CD45+ leucocytes determined by flow cytometry analysis. CK7, cytokeratin 7; iCCA, intrahepatic cholangiocarcinoma; Mo-MDSC, monocytic myeloid derived suppressor cell; TAMs, tumour-associated macrophages; G-MDSC, granulocytic myeloid-derived suppressor cell.
Murine iCCA is predominantly infiltrated with TAMs
To better characterise the leucocyte infiltrate of iCCA, we performed flow cytometry analysis on KPPC tumours and normal liver from littermate controls. Consistent with human IHC studies, flow cytometry verified CD45+ inflammatory leucocytes are significantly elevated in tumours (online supplemental figure 3A,B). These leucocytes were predominantly CD11b+ myeloid cells, and a majority of these cells were Ly6G low, Ly6C Low, F4/80+, CD68+, MHCII+ TAMs (figure 2C,D, online supplemental figure 3A,C). Indeed, while Ly6Chigh, Ly6Glow monocytic myeloid-derived suppressor cells (Mo-MDSC) and Ly6Clow, Ly6Ghigh G-MDSCs were also significantly elevated compared with controls, TAMs greatly outnumbered these other myeloid subsets combined and are increased by >200 fold compared with normal liver (figure 2C,D).
Murine iCCA drives alternative polarisation of TAMs
In order to understand the functional characteristics of TAMs in iCCA, BM-derived macrophages were exposed to tumour-conditioned media and assessed using qRT-PCR analysis for expression of genes associated with alternative (M2) polarisation of macrophages. Tumour-conditioned media from previously described murine iCCA cell lines strongly induced transcription of Arg1 and Mrc1, consistent with alternative polarisation of TAMs towards an immunosuppressive phenotype (online supplemental figure 3E).24 25
KPPC derived iCCA exhibit a lymphocyte cold microenvironment
Our human studies of TME gene signatures demonstrated that iCCA is dominated by cell populations associated with immunologically cold microenvironments (online supplemental figure 2C,D). To evaluate TME gene heterogeneity of cell populations in the KPPC mouse model of iCCA, we performed bulk RNA-sequencing and murine MCP counter (mMCP) analysis with RNA isolated from KPPC iCCA tumours. Similar to our findings in human iCCA, mMCP analysis of KPPC tumours showed prominent gene signatures for myeloid cells and fibroblasts with comparatively lower gene signatures for adaptive immune cell populations (online supplemental figure 3D). Notably, flow cytometry analysis demonstrated that while the TME possesses nearly a 10-fold increase in leucocytes compared with normal murine liver parenchyma (online supplemental figure 3A,B), the overwhelming majority of these cells are myeloid in origin (figure 2E, online supplemental figure 3A,C,F–H). The KPPC iCCA model thus closely resembles the human disease phenotypically and represents a powerful model for studying the interplay between the carcinoma and surrounding stroma.
iCCA-BM crosstalk induces myelopoiesis and mobilisation of myeloid cells
Since our findings showed that patients with advanced CCA and resectable iCCA demonstrated a worse prognosis when subjects exhibit elevated peripheral blood myeloid cell ratios (figure 1D,E; online supplemental figure 1F), we sought to understand the mechanisms underlying iCCA induced myeloid cell production and recruitment in spontaneous iCCA tumours. qRT-PCR analysis of KPPC iCCA tumours showed a 3–1000 fold increase in expression of colony-stimulating factors compared with normal liver (figure 3A). Notably, granulocyte–macrophage colony-stimulating factor (Gm-csf) was the most elevated of these cytokines.
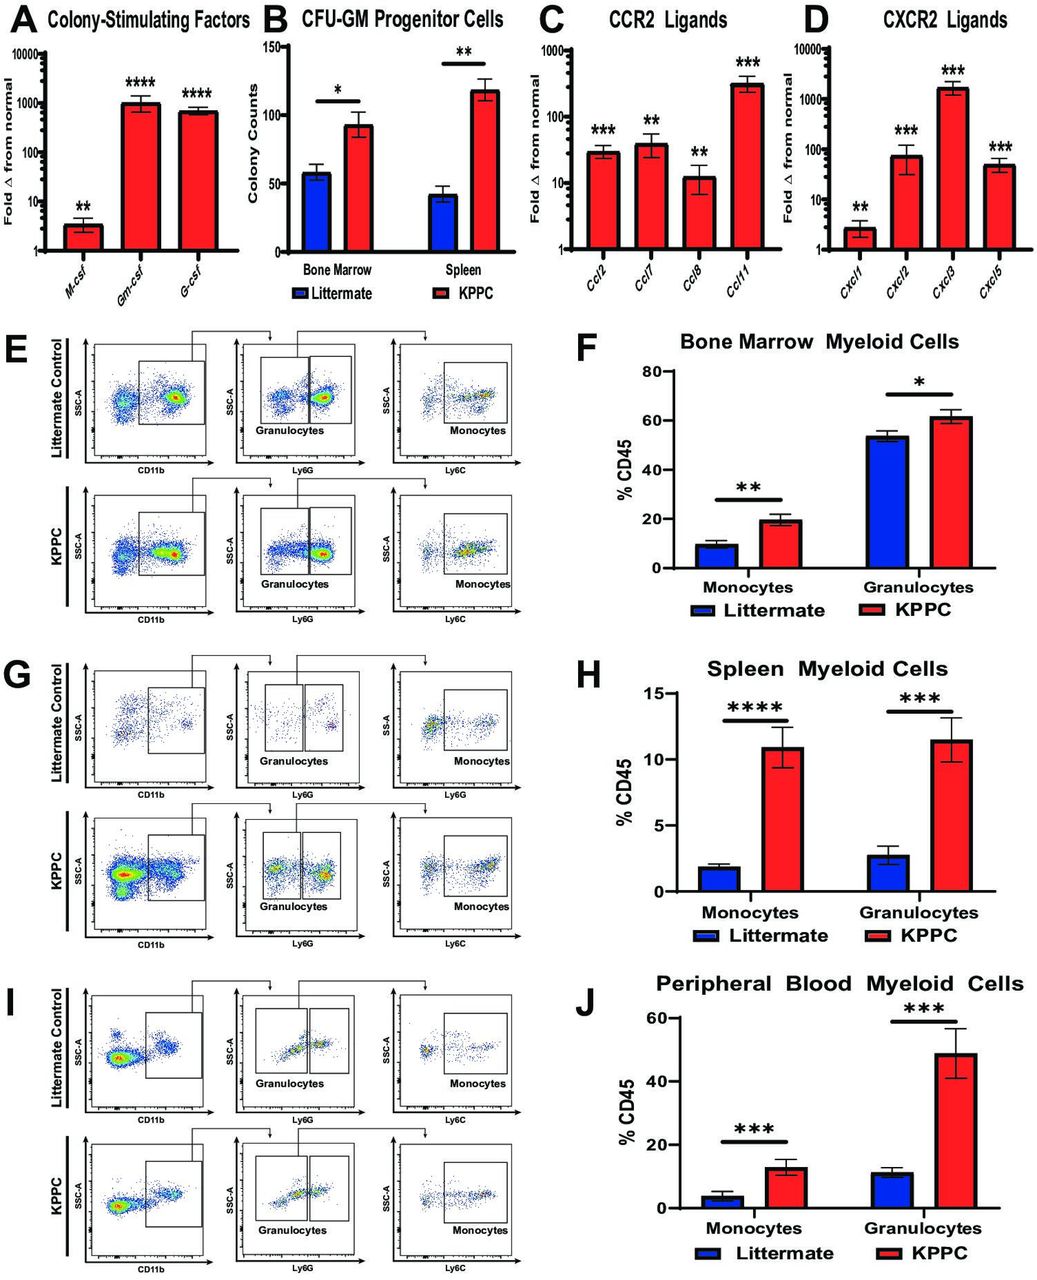
iCCA tumours induce myelopoiesis and systemic accumulation of myeloid cells. (A) qRT-PCR analysis shows mean fold change in normalised mRNA expression levels of colony-stimulating factors including M-csf, Gm-csf and G-csf in normal livers from littermate controls (n=10) compared with established iCCA tumours from KPPC mice (n=8). (B) graph compares CFU-GM in bone marrow and splenocyte cell suspensions isolated from littermate controls and KPPC mice with established iCCA tumours. n=6–7 per group. (C and D) Graphs compare mean fold change in normalised mRNA expression levels for C-C chemokine receptor type 2 (CCR2) ligands (C) and C-X-C chemokine receptor type 2 (CXCR2) ligands (D) in normal livers from littermate controls (n=10) versus established iCCA tumours from KPPC mice (n=8) by qRT-PCR analysis. (E, G and I) Representative flow cytometry plots show gating strategies for defining myeloid cell subsets in suspensions of bone marrow mononuclear cells (E), splenocytes (G) and peripheral blood (I) from littermate controls and KPPC mice with established iCCA tumours. (F, H and J) Graphs compare the prevalence of Ly6C+ monocytes and Ly6G+ granulocytes in bone marrow (F, n=12–13/group), spleens (H, n=12–13/group) and peripheral blood (J, n=11–13/group) from littermate controls and KPPC mice with established iCCA tumours. All bars indicate means±SEM, and p values were determined by Mann-Whitney U test. *P<0.05, **p<0.01, ***p<0.001 and ****p< 0.0001. Gm-csf, granulocyte–macrophage colony-stimulating factor; G-csf, granulocyte colony-stimulating factor; GM-CFUs, granulocyte–macrophage colony-forming units; iCCA, intrahepatic cholangiocarcinoma; M-csf, macrophage colony-stimulating factor; qRT-PCR, quantitative real-time polymerase chain reaction.
In addition, tumour-bearing mice exhibited increased BM and splenocyte colony-forming units compared with controls, indicating iCCA induces expansion of haematopoietic progenitors in these compartments to support increased myelopoiesis of granulocytes and monocytes (figure 3B). Accordingly, flow cytometry analysis demonstrated that granulocytes and monocytes were dramatically increased in the BM, spleen and peripheral blood of KPPC tumour-bearing mice compared with littermate controls (figure 3E–J). Furthermore, qRT-PCR analysis demonstrated that iCCA tumours expressed significantly elevated levels of CCR2 and CXCR2 ligands, two canonical chemokine receptor signalling pathways for recruiting monocytes and granulocytes to the TME (figure 3C,D).26 27
Therapeutic blockade of GM-CSF restrains autochthonous KPPC iCCA
GM-CSF was the most elevated colony-stimulating factor expressed by iCCA tumours (figure 3A), and it plays a key role in myelopoiesis and myeloid cell programming in acute and chronic inflammation.28 Therefore, we sought to test the impact of blocking GM-CSF signalling in our spontaneous mouse model of iCCA. To this end, KPPC mice with newly developed liver tumours (online supplemental figure 4) were serially enrolled into a therapeutic trial evaluating blockade ofGM-CSF with a monoclonal antibody (ɑGM-CSF) compared to an immunoglobulin isotype control (IgG) (figure 4A). At disease onset, these mice exhibited similar age, gender, disease distribution and tumour size (online supplemental table 4). KPPC mice with established tumours treated with ɑGM-CSF exhibited restrained tumour growth (figure 4A,B), increased latency to the development of multifocal liver tumours (figure 4C) and increased survival compared with IgG treated controls (figure 4D). Taken together, GM-CSF neutralisation alone firmly deterred progression of autochthonous iCCA murine tumours and extended survival. These findings suggest that the GM-CSF signalling axis plays a key role in iCCA tumour growth and progression.

Systemic GM-CSF neutralisation reduces spontaneous iCCA tumour burden and increases survival of KPPC mice. (A) Images show representative sonograms of tumour cross-sectional areas at time of disease onset (day 0) and on-treatment day 27 as indicated. Red and blue boundaries outline greatest tumour cross-sectional areas in B-mode. Total volumetric area is quantified after 3D reconstruction with Vevo lab software. Total tumour volume displayed in parentheses. (B) Graph compares changes in 3D tumour volumes of KPPC mice over time after initiation of treatment with IgG control (n=12) or ɑGM-CSF (n=12). Tumour growth curves were modelled using a linear mixed effect regression and slopes compared using the Welch-Satterthwaite t-test. (C) Graph compares time to onset of multifocal disease in KPPC mice treated as indicated. Bars depict means±SEM, and p values were determined by Wilcoxon rank-sum test. *p<0.05. (D) Kaplan-Meier curve compares overall survival of KPPC mice treated with IgG (n=12) versus ɑGM-CSFF (n=12). P value was determined by log-rank test. 3D, three-dimensional; GM-CSF, granulocyte–macrophage colony-stimulating factor; iCCA, intrahepatic cholangiocarcinoma;
GM-CSF neutralisation reduces myeloid immunosuppression facilitating cytotoxic T cell engagement
To evaluate mechanisms restraining iCCA progression in response to GM-CSF blockade, syngeneic murine cell lines were generated from congenic KPPC iCCA tumours (online supplemental figure 5A). Orthotopically injected URCCA4.3 tumours faithfully recapitulate spontaneous iCCA, including the development of a robust fibroinflammatory tumour stroma (online supplemental figure 5C). Furthermore, CD8 and CD4 T cell depletion of tumour-bearing mice injected with the URCCA4.3 line conferred no difference in survival compared with IgG treated controls, demonstrating a paucity of endogenous immunity in this orthotopic model (online supplemental figure 6L). Lastly, Luminex analysis of URCCA murine cell lines demonstrated carcinoma-derived production of colony-stimulating factors, especially GM-CSF (online supplemental figure 5B).
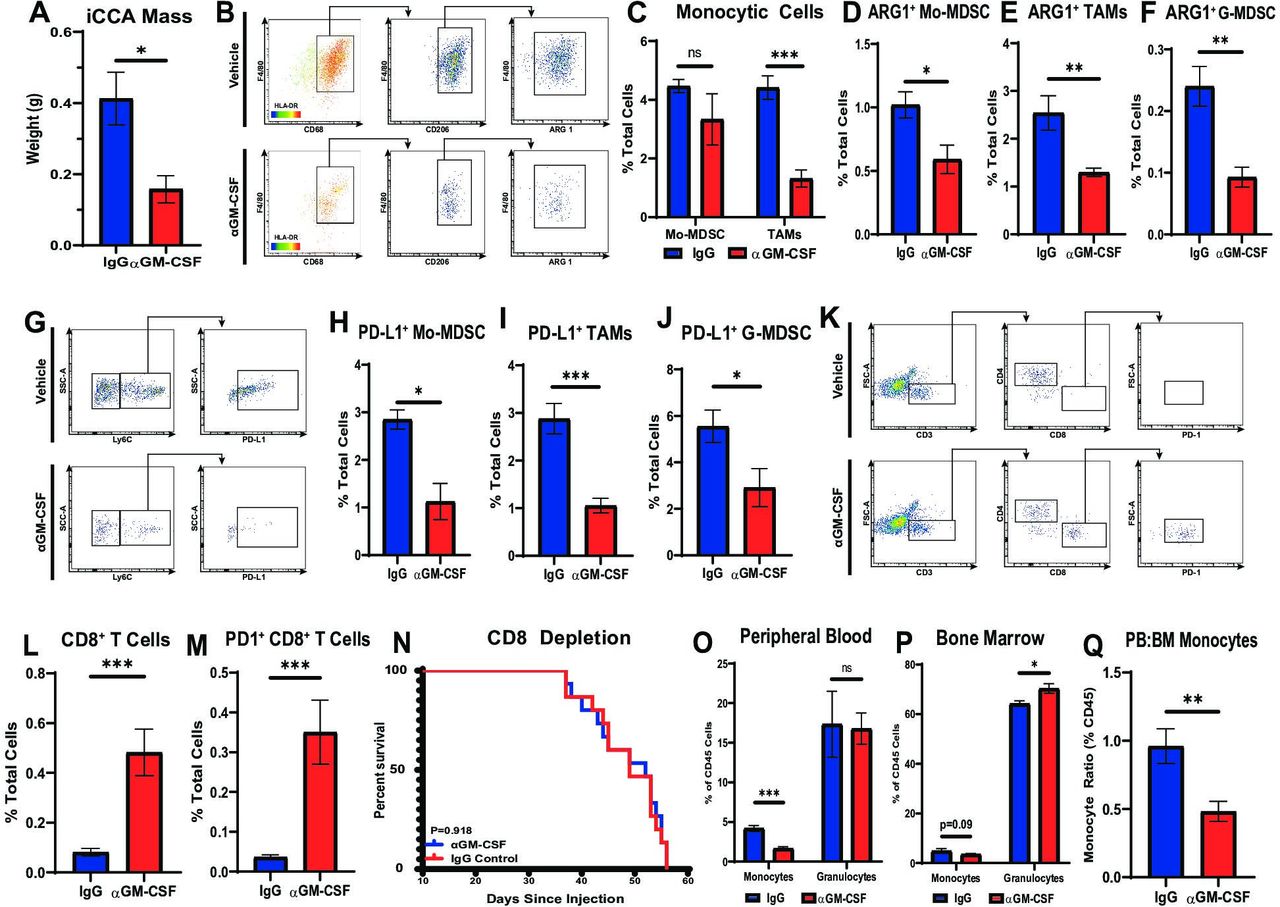
In order to evaluate the immune dynamics in iCCA tumours treated with ɑGM-CSF, cohorts of mice with established orthotopic URCCA4.3 tumours were treated with ɑGM-CSF or IgG for 2 and 4 weeks prior to sacrifice and removal of tumours for flow cytometry analysis. URCCA4.3 tumours treated with ɑGM-CSF were significantly smaller compared with IgG treated controls verifying our findings in spontaneous animals (figure 5A). Flow cytometry analysis of 2-week and 4-week tumours treated with ɑGM-CSF demonstrated statistically significant reductions of TAM infiltration (figure 5B,C; online supplemental figure 6B). Concomitantly, Mo-MDSCs and G-MDSCs remained unchanged in proportions at both timepoints (figure 5C; online supplemental figure 6A,B). However, phenotypically, all myeloid cell subsets (TAMs, Mo-MDSC and G-MDSC) were found to have decreased expression of ARG1 and PD-L1 in vivo (figure 5B,D–J). Furthermore, GM-CSF blockade resulted in no measurable difference in CD11c+ dendritic cells, CD4+ T helper cells or FOXP3+ regulatory T cells within the TME (online supplemental figure 6C,D,F,G,I,J).

Neutralisation of GM-CSF decreases tumour-infiltrating monocytic lineages and enhances antitumour T cell immunity. (A) Graph compares resected tumour weights after orthotopically implanted URCCA4.3 tumours were established and treated with isotype control (n=5) or anti-GM-CSF (n=5) antibodies for 17 days. (B) Representative flow cytometry plots demonstrate gating strategy for identifying alternatively activated TAM in orthotopic URCCA4.3 tumours after treatment for 14 days as indicated. (C) Flow cytometry analysis compares the prevalence of Mo-MDSCs and TAMs after established orthotopic URCCA4.3 tumours were treated with IgG control (n=7) or anti-GM-CSF (n=8) for 28 days. (D, E and F) Graphs compare the prevalence of ARG1+ Mo-MDSCs (D), ARG1+ TAMs (E) and ARG1+ G-MDSCs (F) after treatment for 28 days as indicated. (G) Representative flow cytometry plots demonstrate gating strategies for identifying PD-L1+ Mo-MDSC after mice with established orthotopic URCCA4.3 tumours were treated for 28 days as indicated. (H, I and J) Graphs compare the prevalence of PD-L1+ Mo-MDSC (H), PD-L1+ TAMs (I) and PD-L1+ G-MDSC (J) by flow cytometry analysis after established URCCA4.3 tumours were treated with IgG control (n=7) or anti-GM-CSF (n=8) for 28 days. (K) Representative flow cytometry plots demonstrate gating strategy for identifying tumour-infiltrating T cell subsets after mice with established orthotopic URCCA4.3 tumours were treated for 28 days as indicated. (L) Graph compares the prevalence of tumour-infiltrating cytotoxic CD8+ T cells after established URCCA4.3 tumours were treated with IgG control (n=7) or anti-GM-CSF (n=8) for 28 days. (M) Graph shows the prevalence of tumour-infiltrating PD1+ CD8 T cells by flow cytometry analysis after mice bearing orthotopic URCCA4.3 tumours were treated with IgG control (n=7) or anti-GM-CSF (n=8) for 28 days. (N) Kaplan-Meier curve compares overall survival of CD8 depleted URCCA4.3 tumour-bearing mice treated with IgG (n=15) or anti-GM-CSF (n=14). P value determined by log-rank test. (O and P) Graphs compare the prevalence of peripheral blood (O) and bone marrow (P) monocytes and granulocytes by flow cytometry analysis in mice bearing orthotopic URCCA4.3 tumours after 14 days of treatment with IgG control (n=8) or anti-GM-CSF (n=8). (Q) Graph shows the ratio of peripheral blood to bone marrow monocytes in mice bearing orthotopic URCCA4.3 tumours after 14 days of treatment with IgG control (n=8) or anti-GM-CSF (n=8). All graph bars depict means ± SEM, and p values were determined by Mann-Whitney U test. *p<0.05, **p<0.01 and ***p<0.001. ARG1, arginase 1; BM, bone marrow; G-MDSC, granulocytic myeloid-derived suppressor cells; GM-CSF, granulocyte–macrophage colony-stimulating factor; Mo-MDSC, monocytic myeloid-derived suppressor cells; ns, not significant; PB, peripheral blood; PD1, programmed cell death protein 1; PD-L1, programmed death ligand 1; TAMs, tumour-associated macrophages.
Peripherally, ɑGM-CSF treatment significantly reduced circulating monocytes in the blood of tumour-bearing mice, while granulocytes remained unchanged (figure 5O). In the BM, the proportion of monocytes was unchanged; however, ɑGM-CSF treated mice demonstrated elevated numbers of BM granulocytes (figure 5P). Furthermore, ɑGM-CSF treatment prevented the mobilisation of monocytes from the BM into the blood in iCCA tumour-bearing mice, as evidenced by decreased peripheral blood to BM ratio of monocytes (figure 5Q). Interestingly, splenic proportions of monocytes and granulocytes were unchanged with ɑGM-CSF treatment (online supplemental figure 6K).
The systemic deterrence of monocyte differentiation into ARG1+ and PD-L1+ TAMs and blunting of MDSC expression of ARG1 and PD-L1 was accompanied by a concomitant influx of CD8+ effector T cells after 2 weeks and 4 weeks of treatment with ɑGM-CSF, which were also found to upregulate expression of PD1, suggestive of cytotoxic activation29 compared with IgG treated controls (figure 5K–M; online supplemental figure 6E,H). Depletion of CD8 T cells resulted in abrogation of disease control in ɑGM-CSF treated tumour-bearing mice suggesting GM-CSF signalling with myeloid cells prevents adaptive antitumour immune responses (figure 5N).
Taken together, neutralisation of GM-CSF blunted myeloid cell trafficking and suppressive capacity, facilitating penetration of cytotoxic T cells in iCCA tumours, which resulted in tumour restraint.
GM-CSF blockade reverses tumour-induced myelopoiesis and M2 polarisation of TAMs
GM-CSF neutralisation had the greatest impact on monocyte mobilisation and recruitment of TAMs in our orthotopic mouse model of iCCA. Therefore, we sought to understand the functional impact of GM-CSF blockade on myelopoiesis and M2 polarisation of TAMs. To this end, BM mononuclear cells and splenocytes were harvested from URCCA4.3 tumour-bearing mice after treatment with ɑGM-CSF or IgG for 17 days to assess haematopoietic progenitor cell growth potential in CFU assays. GM-CSF blockade significantly reduced CFU in BM mononuclear cells and splenocytes demonstrating that it plays a central role in the expansion of granulocyte–macrophage progenitor cells underlying iCCA tumour-induced myelopoiesis (figure 6A).

GM-CSF signalling blockade reduces monopoiesis, viability and alternative polarisation of macrophages in the tumour microenvironment. (A) Graph compares CFU-GM in bone marrow mononuclear cell and splenocyte suspensions isolated from mice bearing established orthotopic URCCA4.3 tumours after 17 days of treatment with IgG control (n=5) or anti-GM-CSF (n=5). (B) Graph shows mean number of viable cells per well after culturing bone marrow-derived macrophages in URCCA4.3 conditioned media containing IgG control (n=6) or anti-GM-CSF neutralising antibody (n=6) for 72 hours. (C) Representative flow cytometry histogram of phosphorylated-Signal Transducer and Activator of Transcription 5 (pSTAT5) staining in F4/80+ bone marrow-derived macrophages cultured in URCCA4.3 conditioned media with IgG control (n=6) or anti-GM-CSF neutralising antibody (n=6) for 72 hours. (D) Graph compares the MFI of pSTAT5 staining in F4/80+ bone marrow-derived macrophages cultured in URCCA4.3 conditioned media with IgG control (n=6) versus anti-GM-CSF neutralising antibody (n=6) for 72 hours. (E) Heatmap shows expression of the top 25 and bottom 25 most differentially expressed protein-coding genes (DEGs) from RNA-seq analysis of bone marrow-derived macrophages cultured in URCCA4.3 conditioned media with IgG control (n=6) or anti-GM-CSF neutralising antibody (n=6) for 72 hours. Results were previously filtered to include DEGs based on p value <0.05 and log2 fold change<−1.0 or >1.0. (F) Graph shows quantitative real-time PCR (qRT-PCR) analysis of select downregulated DEGs determined by RNA-seq that are involved in M2 polarisation and immune modulation in bone marrow-derived macrophages cultured in URCCA4.3-conditioned media with IgG control (n=6) or anti-GM-CSF neutralising antibody (n=6) for 72 hours. (G) Table shows the top 20 downregulated Gene Ontology (GO) biological processes in bone marrow-derived macrophages cultured in URCCA4.3 conditioned media and in orthotopic URCCA4.3 tumours after GM-CSF neutralisation. Highlighted GO terms denote convergent pathways in bone marrow-derived macrophages and URCCA4.3 tumours. All graph bars depict means±SEM, and p values were determined by Mann-Whitney U test. *p<0.05, **p<0.01, ***p<0.001 and ****p<0.0001. MFI, median fluorescence intensity; CFU-GM, granulocyte–macrophage colony-forming unit; GM-CSF, granulocyte–macrophage colony-stimulating factor.
To study the functional role of GM-CSF blockade on TAMs in iCCA, BM-derived macrophages were cultured in URCCA4.3 tumour-conditioned medium with or without ɑGM-CSF neutralising antibody for 72 hours. Neutralisation of GM-CSF in vitro significantly reduced macrophage viability, and flow cytometry analysis demonstrated TAM senescence was associated with decreased Signal Transducer and Activator of Transcription 5 (STAT5) phosphorylation (figure 6B–D).
To further evaluate functional changes in TAMs following GM-CSF blockade, we also performed RNA-seq analysis on tumour-educated macrophages in the presence and absence of GM-CSF neutralising antibody. RNA-seq analysis showed changes in more than 1600 differentially expressed protein-coding genes (DEGs) after neutralisation, demonstrating that GM-CSF has a global impact on macrophage gene transcription (online supplemental figure 7A), (online supplemental table 5). Twenty-five of the most significantly up- and down-regulated DEGs showed that GM-CSF regulated a broad spectrum of genes associated with macrophage function and polarisation (figure 6E). qRT-PCR analysis confirmed decreased expression of multiple genes associated with an immunosuppressive M2 phenotype including Mrc1, Msr1 and Arg1 and with genes underlying chronic inflammatory pathways (figure 6F). Congruent with our in vivo flow cytometry findings, these macrophages also expressed fewer transcripts of programmed cell death ligand 1 and 2 (PD-L1 and PD-L2) when deprived of GM-CSF (figure 6F).
Over-representation analysis (ORA) of downregulated DEGs demonstrated that GM-CSF deprived tumour-educated macrophages exhibited reduced Gene Ontologies (GO) for inflammatory response, regulation of cytokine production, and response to cytokine, among other pathways (figure 6G; online supplemental table 6). In addition, pathway analysis of DEGs using MSigDB Hallmarks gene sets showed that GM-CSF deprived tumour-educated macrophage DEGs showed reductions in several inflammatory pathways including TNFɑ signalling via NF-Κb and IL6 JAK STAT3 signalling emphasising the pleiotropic effect of GM-CSF on immune signalling pathways (online supplemental figure 6C). qRT-PCR analysis of orthotopic iCCA tumours treated with ɑGM-CSF also showed significant reductions in DEGs associated with M2 macrophage polarisation and chronic inflammatory pathways compared with IgG controls demonstrating the efficacy of ɑGM-CSF for reversing TAM-mediated programmes of inflammation in vivo (online supplemental figure 6B; online supplemental table 7). Indeed, analysis of downregulated DEGs in ɑGM-CSF treated tumours showed reduced GO terms in innate immune response, inflammatory response, and response to chemokine, which considerably overlapped with GO biological processes in GM-CSF deprived TAMs in vitro. (figure 6G; online supplemental table 8). In addition, we did not observe significant changes in expression of Csf1, Csf2 or Csf3 between ɑGM-CSF- and IgG-treated tumours, suggesting that no other colony-stimulating factors compensate for the loss of TAM recruitment to iCCA tumours in response to GM-CSF blockade (online supplemental figure 7B).
In contrast to downregulated DEGs, ORA analysis of upregulated DEGs in ɑGM-CSF treated tumour-educated macrophages demonstrated significant increases in several GO terms associated with vascular remodelling including angiogenesis, blood vessel development and vascular development (online supplemental table 9). To test whether these upregulated gene signatures impacted stromal remodelling in vivo, Sirius Red staining was digitally quantified in ɑGM-CSF-treated and IgG-treated orthotopic tumours, which demonstrated no statistical difference in collagen deposition (online supplemental figure 7E,F).
Interestingly, ɑGM-CSF-treated tumour-educated macrophages demonstrated little overlap in upregulated DEGs and GO terms with ɑGM-CSF-treated tumours (online supplemental tables 7 and 10). In tumours, upregulated GO terms clustered around hyaluronan assembly (online supplemental table 10).
Taken together, these data show that ɑGM-CSF treatment reduced M2 TAM prevalence within tumours by decreasing TAM survival and polarisation towards a protumoural phenotype. Furthermore, repolarisation of TAMs with GM-CSF neutralisation resulted in quiescence of innate inflammatory networks.
Expression of GM-CSF is prognostic in human iCCA
In order to assess the clinical ramifications of GM-CSF expression in the TME of human iCCA, IHC analysis for GM-CSF was performed on whole tissue sections and digitally quantified. IHC analysis demonstrated significantly increased expression of GM-CSF by the cancerous epithelium compared with adjacent liver parenchyma (figure 7A,B). Furthermore, the degree of GM-CSF expression was prognostic for overall survival within our cohort of resected iCCA patients (figure 7C).

GM-CSF expression is elevated in human iCCA tumours, and its levels inversely correlate with survival. (A) Representative images show GM-CSF expression by IHC staining in tissue sections from normal human liver and iCCA tumour. Images were acquired at 200x magnification. (B) Graph compares GM-CSF expression in adjacent liver (n=27) versus iCCA tumours (n=27) after digital quantification of IHC staining using the Aperio positive pixel count algorithm. Bars indicate means±SEM, and p values were determined by Wilcoxon rank-sum test. ****p<0.0001. (C) Kaplan-Meier curve compares patient overall survival post-surgical resection for iCCA after GM-CSF IHC staining intensity in patient tumour sections was digitally quantified and stratified into low (n=11) and high (n=19) GM-CSF expressing cohorts. Patients with mortality within 30 days after surgery were excluded from the analysis. P value determined by log-rank test. GM-CSF, granulocyte–macrophage colony-stimulating factor; iCCA, intrahepatic cholangiocarcinoma.
Discussion
Cholangiocarcinoma has proven a vexing clinical problem, with limited effective therapies. At present, there are few immune competent preclinical models that faithfully recapitulate the architecture and immune infiltrate of the human disease. Here we present our work in an autochthonous murine model and a novel orthotopic model using syngeneic iCCA cell lines developed in our laboratory, which provide a robust platform for evaluating stroma and immune targeted therapies.
We showed that blockade of GM-CSF signalling prevents recruitment and maturation of monocytes into suppressive CD206+ TAMs within the TME of iCCA in vivo. Furthermore, depletion of TAMs permitted CD8+ T cell infiltration and activation, resulting in disease control. Interestingly, while other myeloid targeting strategies have resulted in ‘myeloid compensation’ by alternative immunosuppressive myeloid cells,26 30–33 GM-CSF blockade did not result in an increase in prevalence of monocytic or granulocytic MDSCs. To the contrary, the unchanged proportions of granulocytes and monocytes were found to express less ARG1 and PD-L1, suggestive of pan-myeloid repolarisation away from an immunosuppressive phenotype.
Mechanistically, GM-CSF blockade reprogrammed macrophages to express fewer suppressive ligands such as PD-L1 and PD-L2 and M2 markers of alternative polarisation such as CD206, CD204 and ARG1. Concomitantly, ɑGM-CSF treatment in vitro significantly impaired macrophage viability. Taken together, these data demonstrate that ɑGM-CSF therapy ablates TAMs by both reducing viability and polarisation, unleashing antitumour immunity. As a result, iCCA tumours also demonstrate reduced innate signalling pathways associated with chronic inflammation when M2 TAMs are targeted with ɑGM-CSF treatment.
GM-CSF exerts its effect by binding of its cognate receptor on target cells resulting in maintenance of cell survival via PI3K and AKT.34 High concentrations of GM-CSF induce both survival and proliferation pathways in the target cell through STAT5-mediated gene transcription.34 35 Not surprisingly, our experiments demonstrate blunting of pSTAT5 signalling following GM-CSF blockade, which may in part explain the observed changes in the transcriptome of tumour-educated macrophages.
Peripherally, GM-CSF blockade resulted in decreased production of tumour-directed myeloid progenitors in the BM and spleen of tumour-bearing mice. Furthermore, ɑGM-CSF treatment impaired mobilisation of monocytes from the BM into the peripheral blood. Notably, recombinant GM-CSF has been used to treat certain neutropaenias36; thus, one concern of blocking this axis is the off-target effect of neutropaenia; however, treated mice exhibited spared granulocyte counts in the BM, spleen and peripheral blood.
In hepatobiliary cancers, T cell exclusion is at least in part orchestrated by myeloid immunosuppression within the tumour microenvironment.26 37 38 Furthermore, iCCA has been subtyped according to the immune infiltrate, with improved prognosis in tumours with increased cytotoxic and helper T cell signatures and worse prognosis when infiltrated with monocytic leucocytes.20 Interestingly, GM-CSF is implicated in the production and recruitment of MDSCs in hepatocellular carcinoma and pancreatic ductal adenocarcinoma.39 40 Furthermore, oncogenic RAS has been shown to drive the production of tumour derived GM-CSF,41 and these mutations portend more aggressive iCCA disease.42 In keeping with these prior studies, we observed an increase in trafficking and penetration of monocytic and granulocytic suppressor cells in the peripheral blood and TME of patients with iCCA. Notably, GM-CSF expression within the tumour was also prognostic. These observations buttress our preclinical findings that implicate the GM-CSF axis as a central mediator of myeloid cell recruitment and iCCA progression.
Conclusions
iCCA achieves T cell exclusion by inducing myelopoiesis and recruitment of TAMs and MDSCs. GM-CSF is a key driver of myeloid cell production and immunosuppressive programming, and therapeutic blockade of GM-CSF potently inhibits M2 TAMs resulting in enhanced cytotoxic T cell penetration and activation without compensation by MDSC populations (figure 8). GM-CSF targeting strategies should be investigated as a means of augmenting available therapies for iCCA.

Cholangiocarcinoma derived GM-CSF orchestrates systemic and local programming of monocytic myeloid cell lineages that enhance tumour growth and spread (panel A). GM-CSF, granulocyte–macrophage colony-stimulating factor; PD-L1, programmed cell death ligand 1.
Data availability statement
Data are available on reasonable request. Data available from David C Linehan by requests. David_Linehan@urmc.rochester.edu.
Ethics statements
Patient consent for publication
References
Supplementary materials
Supplementary Data
This web only file has been produced by the BMJ Publishing Group from an electronic file supplied by the author(s) and has not been edited for content.
Footnotes
Twitter @LuisRuffoloMD
Contributors LIR, KMJ, PCK and BD were involved in substantial data acquisition, analysis, interpretation of data, drafting of manuscript, final approval and agree to be accountable for all aspects of the work in ensuring that questions related to the accuracy or integrity of any part of the work are appropriately investigated and resolved. NMFG, NU, PRB, SSQ, PGJ, JMK, MG, RJ, MROD and LDLC were involved in substantial data acquisition, drafting of manuscript, final approval and agree to be accountable for all aspects of the work in ensuring that questions related to the accuracy or integrity of any part of the work are appropriately investigated and resolved. ABM was involved in substantial data acquisition and analysis, drafting of manuscript, final approval and agree to be accountable for all aspects of the work in ensuring that questions related to the accuracy or integrity of any part of the work are appropriately investigated and resolved. LMC, AFH, GBL, JJY, RH-A and DCL were involved in substantial data interpretation, drafting of manuscript, final approval and agree to be accountable for all aspects of the work in ensuring that questions related to the accuracy or integrity of any part of the work are appropriately investigated and resolved. TMN was involved in substantial data analysis and interpretation, drafting of manuscript, final approval and agree to be accountable for all aspects of the work in ensuring that questions related to the accuracy or integrity of any part of the work are appropriately investigated and resolved. BAB was involved in substantial data acquisition, analysis, interpretation, drafting of manuscript, final approval and agree to be accountable for all aspects of the work in ensuring that questions related to the accuracy or integrity of any part of the work are appropriately investigated and resolved.
Funding The authors have not declared a specific grant for this research from any funding agency in the public, commercial or not-for-profit sectors.
Competing interests None declared.
Provenance and peer review Not commissioned; externally peer reviewed.
Supplemental material This content has been supplied by the author(s). It has not been vetted by BMJ Publishing Group Limited (BMJ) and may not have been peer-reviewed. Any opinions or recommendations discussed are solely those of the author(s) and are not endorsed by BMJ. BMJ disclaims all liability and responsibility arising from any reliance placed on the content. Where the content includes any translated material, BMJ does not warrant the accuracy and reliability of the translations (including but not limited to local regulations, clinical guidelines, terminology, drug names and drug dosages), and is not responsible for any error and/or omissions arising from translation and adaptation or otherwise.