Article Text

Abstract
Objective Hepatitis B virus (HBV)-specific T cells are main effector cells in the control of HBV infection and hepatitis B surface antigen (HBsAg) is suggested to be a critical factor in the impaired immune response, a hallmark of chronic HBV infection. In addition to HBsAg, other viral markers such as hepatitis B core-related antigen (HBcrAg) are available, but their potential association with HBV-specific immune responses is not defined yet, which will be important if these markers are used for patient stratification for novel therapies aimed at functional HBV cure.
Design We analysed T cell responses in 92 patients with hepatitis B e antigen negative chronic HBV infection with different HBsAg and HBcrAg levels. Overlapping peptides were used for in vitro response analyses (n=57), and HBV core18-specific and polymerase (pol)455-specific CD8+ T cells were assessed in human leukocyte antigen (HLA)-A*02 patients (n=35). In addition, in vitro responsiveness to anti-programmed cell death-ligand 1 (anti-PD-L1) was investigated.
Results HBV-specific T cell responses were not affected by HBsAg levels, but rather by age and CD4+ T cell responses were highest in patients with low HBcrAg levels. The phenotypes and functionality of HBV core18-specific and pol455-specific CD8+ T cells differed, but HBsAg and HBcrAg levels did not affect their profiles. Blocking with anti-PD-L1 could restore HBV-specific T cells, but the effect was significantly higher in T cells isolated from patients with low HBsAg and in particular low HBcrAg.
Conclusion Our data suggest that age and HBcrAg rather than HBsAg, are associated with HBV-specific T cell responses. Finally, very low antigen levels indicated by HBsAg and in particular HBcrAg may influence T cell response to checkpoint inhibition.
- hepatitis B
- cellular immunology
- chronic hepatitis
- immune response
- T lymphocytes
Data availability statement
All data relevant to the study are included in the article or uploaded as supplementary information. All data relevant to the study are included in the article or uploaded as supplementary information. As requested by reviewer 2 we deleted some redundant suplemnetary figure. Howeverm, the data can always be requested.
This is an open access article distributed in accordance with the Creative Commons Attribution Non Commercial (CC BY-NC 4.0) license, which permits others to distribute, remix, adapt, build upon this work non-commercially, and license their derivative works on different terms, provided the original work is properly cited, appropriate credit is given, any changes made indicated, and the use is non-commercial. See: http://creativecommons.org/licenses/by-nc/4.0/.
Statistics from Altmetric.com
Significance of this study
What is already known on this subject?
Hepatitis B virus (HBV)-specific T cells are exhausted and impaired in patients with chronic HBV infection.
The duration of hepatitis B surface antigen (HBsAg) exposure (indicated by the patient’s age), rather than the quantity of HBsAg, was associated with the level of anti-HBV immune response, in particular hepatitis B surface-specific T cell responses.
HBV-specific CD8+ T cells with different target specificities (HBV core epitope vs HBV polymerase (pol) epitope) are characterised by distinct phenotypical and functional profiles.
Checkpoint inhibition (in vitro blockade with anti-programmed cell death protein 1 (anti-PD-1) or anti-programmed cell death-ligand 1 (anti-PD-L1) can restore in vitro responsiveness of HBV-specific T cell responses.
What are the new findings?
HBV-specific T cell responses (also HBV core-specific and HBV pol-specific T cells) are not influenced by the level of HBsAg but rather by the age of the patient, especially the CD4+ T cell response.
Patients with low hepatitis B core-related antigen (HBcrAg) level showed higher HBV-specific CD4+ T cell responses (independent of age), especially in HBV core-specific and HBV pol-specific T cell responses.
The different phenotypical and functional profiles of HBV core-specific and HBV pol-specific CD8+ T cell responses were not influenced by different HBsAg or HBcrAg levels.
CD4+ and CD8+ T cells isolated from patients with low levels of HBsAg (<100 IU/mL) and in particular low levels of HBcrAg (<3 Log U/mL) were more responsive to PD-L1 blockade in vitro. This was independent of age.
How might it impact on clinical practice in the foreseeable future?
The results highlight that age as an indicator of duration of infection is an important factor for the functionality of HBV-specific CD8+ and CD4+ T cells, not only for HBV surface-specific T cells but also for HBV core-specific and pol-specific T cells, which is independent of HBsAg level. This data is important for considering young patients for novel immune-based therapies aimed at functional cure of HBV.
Our findings also highlight that HBcrAg might be a better viral marker than HBsAg to discriminate hepatitis B e antigen negative patients with preserved HBV-specific (CD4+) T cell responses and thus may be considered to stratify patients for novel therapies aimed at HBsAg loss.
The data also suggest that patients with low HBsAg and/or low HBcrAg are better candidates for immune-based therapies (eg, checkpoint inhibition) regardless of age, supporting the hypothesis for antigen lowering, for example, with RNA interference.
Overall, our data provide new insights that are important for patient stratification considerations for novel therapies aimed at functional cure of HBV.
Introduction
Hepatitis B virus (HBV) infection remains a major global health problem with approximately 257 million people worldwide chronically infected, resulting in 887 000 deaths per year due to progressive liver disease and hepatocellular carcinoma (HCC).1 Treatments with nucleos(t)ide analogues (NA) or interferon (IFN) alfa result in HBV DNA suppression and slowing of disease progression in patients with chronic hepatitis B (CHB).2 However, functional cure of chronic HBV infection, defined as sustained hepatitis B surface antigen (HBsAg) loss, which is the primary goal of HBV treatment, is rarely achieved with current therapies.3 Several novel therapeutic strategies aimed at a functional cure including antiviral and immunomodulatory therapies are being developed.3 Patient selection is very important for early clinical trials with new investigational compounds because chronic HBV infection is highly variable and the different phase of chronic HBV infection may also differ in terms of immune responses.4 On the one hand, it is important to ensure that treatment groups are balanced, otherwise, heterogeneous response is possible, and on the other hand, it is important to select the most appropriate patient for each treatment option in order to demonstrate high efficacy.3
It was agreed that quantitative HBsAg is one pivotal marker to stratify patients for clinical trials with new therapeutic agents3; on the other side, it may be necessary to first reduce HBsAg directly (eg, with RNA interference) to have an effect by immunomodulatory therapies.5
HBV-infected hepatocytes secrete large quantities of non-infectious subviral particles that contain only HBsAg6 that can have an impact on the host immune system in a way that is beneficial for the virus. It has been proposed that HBsAg may act as a decoy to saturate the anti-HBs antibodies and consequently reduces virus neutralisation.7 Besides, persistent high antigen stimulation in patients with CHB is associated with impaired cellular immune responses.8–11 HBV-specific T cells are considered one of the main effector cells in control of HBV infection and impaired and exhausted T cell responses are a hallmark of chronic HBV infection (reviewed in8–11). However, the influence of circulating HBsAg on T cell responses is controversial. Recently, it was shown that HBV-specific T cell responses were not associated with serum HBsAg levels, but that patient age, possibly reflecting the duration of infection, was the determining factor with respect to the frequency of HBs-specific T cells.12 In contrast, another study showed that HBV-specific CD4+ T cell responses were significantly higher in patients with HBsAg <500 IU/mL, and in vitro blockade of the programmed cell death protein 1 (PD-1) pathway could improve the antiviral capacity of T cells only in patients with low HBsAg levels.13 Consistent with the aforementioned hypothesis that HBsAg would need to be reduced to ensure efficacy of immunomodulatory therapies, reduction of HBsAg by RNAi-based therapies increased the efficacy of therapeutic vaccines in a mouse model.5 In contrast, another study showed that HBsAg clearance was not associated with increased antiviral T cell responses after interleukin-2-based immunotherapeutic intervention.14
Understanding which viral and host factors are associated with the HBV-specific immune response, it is very important to identify biomarkers that can be used to select and stratify patients for clinical trials investigating novel therapeutic strategies aimed at functional cure. In addition to HBsAg, other viral proteins could potentially have an impact on the immune response. Recently, with the ability to determine hepatitis B core-related antigen (HBcrAg) using commercial assays, another HBV marker has become widely available that may be associated with the immune response of patients with CHB. HBcrAg combines the antigenic reactivity resulting from denatured hepatitis B e antigen (HBeAg), HBV core antigen and an artificial core-related protein (p22cr).15 16 HBcrAg might be a better surrogate marker for intrahepatic covalently closed circular DNA (cccDNA) and its transcriptional activity compared with HBsAg.17 HBcrAg is also helpful in predicting the response to antiviral therapy and the relapse after NA discontinuation, as well as in predicting the disease progression to liver cirrhosis and the development and recurrence of HCC.15 16 However, so far there are no data if the level of HBcrAg is associated with HBV-specific immune responses.
Therefore, the aim of this study was to analyse the frequency and phenotype as well as the function and responsiveness of T cells to in vitro immunomodulation in well-defined patients with chronic HBV infection with respect to their different HBsAg and HBcrAg levels.
Patients and methods
Patients and sample preparation
A total of 92 HBeAg negative patients with chronic HBV infection were included. In 57 patients, phenotype of total T cells as well as phenotype and function of HBV-specific T cells were analysed (table 1, online supplemental figure S1A) and in 35 HLA-A*02 positive patients core18-specific and polymerase (pol)455-specific CD8+ T cells were analysed (table 2, online supplemental figure S1B). Patients were classified according to their HBsAg levels (<100; 100–1000; 1000–10 000; ≥10 000 IU/mL) or their HBcrAg levels (<3, 3–3.87, ≥3.87 Log U/ml) (online supplemental figure S1). The cut-off values of HBcrAg <3 for low and ≥3.87 Log U/ml for high HBcrAg were based on a previous study in a large cohort with different phases of chronic HBV infection.18
Supplemental material

Characterisation of total CD4+ and CD8+ T cells in patients with CHB with different levels of HBsAg and HBcrAg. (A) Concatenated t-SNE plots of CD4+ and CD8+ T cell subsets (upper panels) and intensities of the indicated markers (lower panels) in 49 patients with CHB categorised according to HBsAg and HBcrAg levels. (B–C) Frequencies of CD4+ and CD8+ T cell effector memory subsets as well as CD4+ and CD8+ T cells expressing activation and exhaustion markers grouped according to HBsAg (B) and HBcrAg (C) levels. Statistical significance between each of the two groups was tested by Mann-Whitney test for non-parametric data and by unpaired t-test for parametric data (B–C). *p<0.05; **p<0.01; ***p<0.001. CHB, chronic hepatitis B; HBcrAg, hepatitis B core-related antigen; HBsAg, hepatitis B surface antigen; TCM, central memory T cell; TEM, effector memory T cell; TEMRA, terminally differentiated effector memory T cell; HLA-DR, human leukocyte antigen – DR; KLRG1, killer cell lectin like receptor G1; PD-1, programmed cell death protein 1; t-SNE, t-distributed stochastic neighbor embedding.
Study cohort of HBeAg negative patients with chronic HBV infection
Study cohort of HLA-A*02 positive patients with chronic HBV infection
Peripheral blood mononuclear cells (PBMCs) were isolated from patients using standard Ficoll density gradient centrifugation and cryopreserved in liquid nitrogen for deferred use.19
Levels of alanine transaminase (ALT), HBV DNA, HBsAg and HBcrAg were determined as previously described.18
All experiments were carried out in accordance with the principles espoused in the Declaration of Helsinki. The local ethics committee of Hannover Medical School ensured this project. Written informed consent was obtained from all individuals participated in this study.
HBV overlapping peptides, single peptides and HLA class I dextramers
HBV-specific genotype D overlapping peptides (OLPs) (ProImmune, Oxford, UK) were made up of 15 amino acids, overlapped by 10 amino acids, spanned the entire HBV core (two pools), surface (four pools) and polymerase (eight pools) (online supplemental table S1).19
Supplemental material
HLA-A*02-restricted HBV-specific peptides, epitopes core18-27 (FLPSDFFPSV) and polymerase455-463 (GLSRYVARL) were synthesised by ProImmune. HLA-A*02-specific dextramers were purchased from Immudex (Copenhagen, Denmark).
Phenotyping of T cell subsets and HBV-specific T cell response after in vitro stimulation with HBV-specific peptides
Ex vivo phenotyping of total T cells and HBV-specific T cell function were analysed as previously described (for antibodies see online supplemental materials and methods).19
Briefly, PBMCs were expanded for 10 days and stimulated with HBV-specific OLPs or HLA-A*02-restricted peptides. The resulting T cell responses were calculated by addition of the corresponding peptide pools after subtracting the medium control.
For analysis of T cell restoration, anti-programmed cell death ligand 1 (anti-PD-L1, clone M1H1, eBioscience) were added to the culture together with HBV-specific peptides. All samples were acquired on a BD LSRFortessa flow cytometer (BD Biosciences).
pMHCI multimer-based magnetic enrichment
Isolation of HBV-specific CD8+ T cells was performed by using multimer-based magnetic bead enrichment as previously described.20 21 Enriched and pre-enriched cells were stained with surface and intracellular markers.
Statistical analysis
Flow cytometry data were analysed using FlowJo software (V.9.9.4 and V.10.6.2). SPICE V.6.0 was used to display multifunctional flow cytometry data (Simplified Presentation of Incredibly Complex Evaluations, National Institutes of Health(NIH)). For removing the impact of age, semi-partial correlation was performed using R V.3.6.3 Patched (2020-04-28, https://www.r-project.org). Statistical analyses were performed using GraphPad Prism 8 (GraphPad Software). Statistical significance was tested by Mann-Whitney test, Wilcoxon matched pairs, Kruskal-Wallis test, Spearman correlation for non-parametric data and by Student’s paired t-test, One-way analysis of variance, Pearson correlation for parametric data. Significant p values are considered as follows: *p<0.05; **p<0.01; ***p<0.001; ****p<0.0001. Bar graphs visualise the mean value and the error bars represent the standard error of the mean.
Results
Impact of HBsAg and HBcrAg levels on total T cells
We first screened the proportion of total CD4+ and CD8+ T cells and their memory effector subsets, γδ T cells, mucosal associated invariant T cells (MAIT cells) and regulatory T cells (Treg cells) ex vivo in 49 patients with different levels of HBsAg and HBcrAg (table 1, online supplemental figure S1A). Flow cytometry was used to identify the expression of T cell-specific differentiation, activation and regulatory markers (online supplemental figure S2A). The t-SNE plots depicted no major differences in clustering of CD4+ and CD8+ T cell subsets (figure 1A). Furthermore, the expression pattern of Granzyme B, HLA-DR, Ki-67 and PD-1 by total T cells remained similar between the patient groups. The proportion of naïve, central memory, effector memory and terminally differentiated effector memory CD4+ T cells were not altered among the groups with different levels of HBsAg or HBcrAg (figure 1B,C). However, patients with HBsAg ≥10 000 IU/mL and patients with HBcrAg ≥3.87 Log U/mL had significantly lower frequencies of central and effector memory CD8+ T cell subsets (figure 1B). The frequency of naïve, central memory and effector memory CD8+ T cells significantly correlated with HBsAg levels (online supplemental figure S2B). A significant negative correlation was only observed between HBcrAg level and effector memory CD8+ T cells (online supplemental figure S2C). Correlation of HBsAg and HBcrAg levels with CD4+ T cells showed no association in patients with CHB (online supplemental figure S2B,C). The proportion of γδ T cells, MAIT cells and Treg cells did not change among the patient groups with varying levels of HBsAg or HBcrAg (online supplemental figure S2D).
Supplemental material
Supplemental material

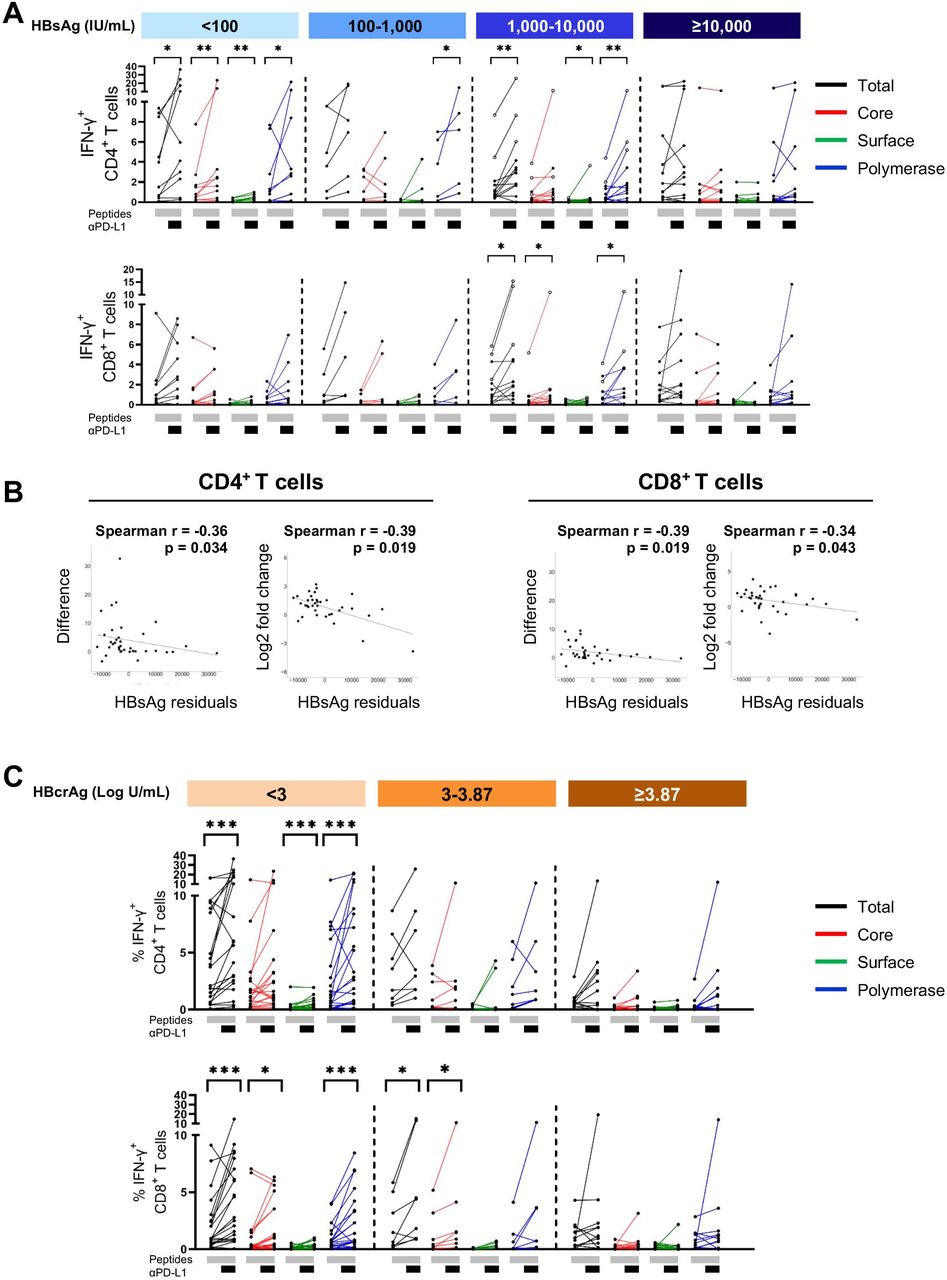
HBV-specific CD4+ and CD8+ T cell responses in patients with different levels of HBsAg and HBcrAg. HBV-specific CD4+ and CD8+ T cell responses following 10-day in vitro stimulation with HBV overlapping peptide pools. (A) Representative flow cytometry plots of HBV-specific CD4+ T cell responses from patients with different levels of HBsAg and HBcrAg. (B–C) HBV-specific IFN-γ+ CD4+ and IFN-γ+ CD8+ T cells from 57 patients with CHB categorised based on their HBsAg (B) and HBcrAg (C) levels (total-specific T cell response: sum of 14 peptide pools). Statistical significance between each of the two groups was tested by Mann-Whitney test for non-parametric data and by unpaired t-test for parametric data (B–C). *p<0.05; **p<0.01; ***p<0.001. CHB, chronic hepatitis B; HBcrAg, hepatitis B core-related antigen; HBsAg, hepatitis B surface antigen; IFN, interferon; TNF, tumour necrosis factor.
The impact of HBsAg and HBcrAg levels on the function of HBV-specific T cells
HBV-specific T cell responses of 57 HBeAg negative patients were assessed by measuring cytokine response (eg, IFN-γ and IFN-γ/tumour necrosis factor (TNF)) following a 10-day expansion and re-stimulation with specific OLPs covering HBV core, surface and polymerase antigens in vitro (online supplemental figure S1A). Representative flow cytometry plots of CD4+ T cell responses are depicted in figure 2A.
In general, IFN-γ+ CD4+ T cell responses were more frequently detectable than IFN-γ+ CD8+ T cell responses (figure 2B,C). HBV core-specific and pol-specific cytokine+ T cells were dominant compared with surface-specific T cells (figure 2B,C). Importantly, there were no significant differences in HBV core, surface and pol-specific T cell responses observed in patients with different plasma HBsAg levels (figure 2B) and HBsAg did not show any correlation with HBV-specific CD4+ and CD8+ T cell responses (online supplemental figure S3). If at all, there was a trend towards an increase in the frequencies of IFN-γ+ CD4+ and CD8+ T cells in patients with HBsAg ≥10 000 IU/mL (figure 2B). In contrast, significant differences were seen in patients with different HBcrAg levels. HBV-specific CD4+ T cell responses to core and polymerase peptides were significantly lower in patients with high HBcrAg (≥3.87 Log U/mL) than in patients with low (<3 Log U/mL) or intermediate (3–3.87 Log U/mL) HBcrAg levels (figure 2C). HBV core-specific CD4+ T cell responses showed a significant negative correlation with plasma HBcrAg levels (online supplemental figure S3B).
Supplemental material

HBV-specific CD4+ and CD8+ T cell responses in different age groups. HBV-specific CD4+ and CD8+ T cell responses following 10-day in vitro stimulation with HBV overlapping peptide (OLP) pools grouped according to the patients’ age. (A) Representative flow cytometry plots of HBV core-specific IFN-γ+/TNF+ CD4+ T cell responses of two patients. (B) Heat map showing mean of frequencies of total cytokine+ HBV-specific CD4+ and CD8+ T cells (age groups: 18–39, n=25; 40–49, n=17; ≥50, n=15). (C) IFN-γ+ HBV-specific CD4+ and CD8+ T cells of different age groups. (D) Correlation analyses of age with frequencies of total IFN-γ+ CD4+ and CD8+ T cells. (E) Mean percentages of multifunctional CD4+ and CD8+ T cell responses after in vitro expansion with total HBV OLPs (sum of 14 OLP pools). Statistical significance between each of the two groups was tested by Mann-Whitney test for non-parametric data and by unpaired t-test for parametric data (B–C). *p<0.05; **p<0.01. IFN, interferon; TNF, tumour necrosis factor.
Of note, 18 patients in the cohort were receiving NA therapy at the time of sampling (table 1, online supplemental table 2), but this did not significantly affect HBV-specific CD4+ and CD8+ T cell responses (online supplemental figure S4A).
Supplemental material

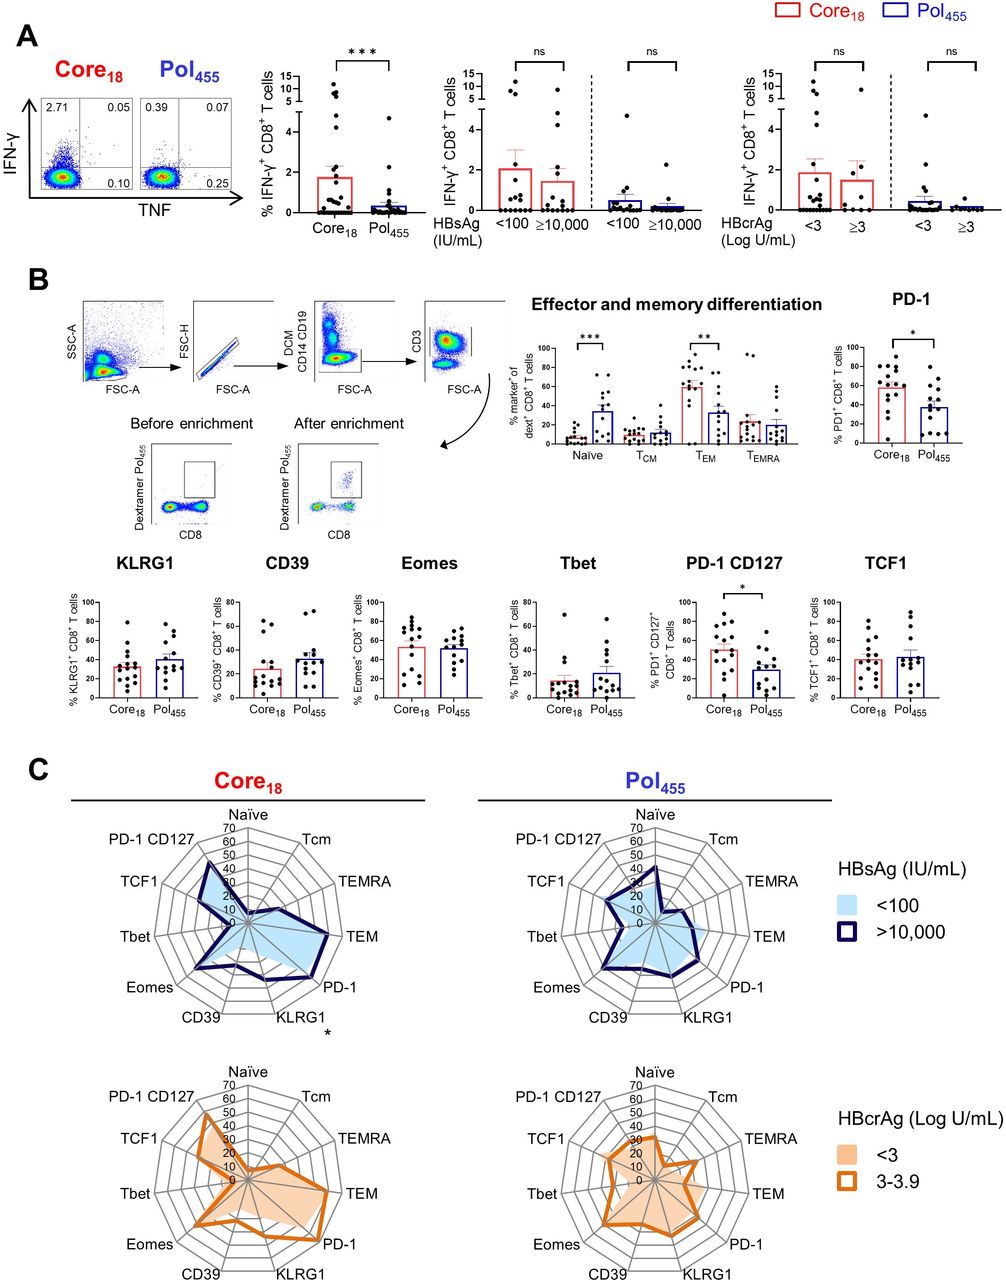
Functional and phenotypical characteristics of HBV core18-specific and HBV pol455-specific CD8+ T cells in patients with CHB. HBV-specific CD8+ T cell responses following 10-day in vitro stimulation with core18 or pol455 peptides in HLA-A*02 positive patients with CHB. (A) HBV-specific IFN-γ+ CD8+ T cell responses categorised based on HBsAg or HBcrAg levels. (B) Enriched ex vivo frequencies of naïve, TCM, TEM and TEMRA populations and expression of PD-1, KLRG1, CD39, Eomes, Tbet, PD-1 CD127 and TCF1 by HBV core18 and pol455-specific CD8+ T cells. (C) Radar plot depicting the mean percentage of ex vivo HBV core18 and pol455-specific CD8+ T cell expressing different markers obtained from patients with CHB categorised based on HBsAg and HBcrAg levels. Statistical significance was tested by Wilcoxon test and Mann-Whitney test for non-parametric data and by unpaired t-test for parametric data (A–C). ns, not significant; *p<0.05; **p<0.01; ***p<0.001. CHB, chronic hepatitis B; DCM, dead cell marker; FSC, forward scatter; HBcrAg, hepatitis B core-related antigen; HBsAg, hepatitis B surface antigen; HLA, human leukocyte antigen; IFN, interferon; PD-1, programmed cell death protein 1; pol, polymerase; SSC, side scatter; TCF1, transcription factor 1; TCM, central memory T cell; TEM, effector memory T cell; TEMRA, terminally differentiated effector memory T cell; TNF, tumour necrosis factor;.
We also analysed whether the phase of chronic HBV infection had an impact and assigned patients to four different categories based on HBV (< or ≥2000 IU/mL) and ALT (normal or elevated) (online supplemental table 3). Patients with HBV DNA ≥2000 IU/mL and elevated ALT (HBeAg negative hepatitis) had significantly lower CD4+ T cell responses (online supplemental figure S4B). Of note, five out of five patients in this group had HBcrAg levels of ≥3.87 Log/mL. ALT level did not correlate with HBV-specific CD4+ or CD8+ T cell responses (Spearman r=−0.05, p=0.7; Spearman r=0.21, p=0.11, respectively).
The impact of age on HBV-specific T cell response
Given the significant negative correlation of quantitative HBsAg with age6 12 (online supplemental figure S5A), we examined HBV-specific T cell responses in three different age groups (18–39, 40–49 and ≥50 years). The frequency of total IFN-γ+ CD4+ (sum of HBV core, surface and polymerase) was significantly higher in younger patients (<40 years) than in older patients (≥50 years) (figure 3A, B and C). In particular, a significant negative correlation was observed between the total number of HBV-specific IFN-γ+ CD4+ T cells and age (figure 3D). The effect was more pronounced for HBV pol-specific T cells. Notably, patients treated with NA were evenly distributed among the different age groups (18–39 years: n=8/25 (32%), 40–49 years: 6/17 (35%), ≥50 years: 4/15 (27%)).
Supplemental material
Impact of PD-L1 blockade on HBV-specific T cell responses in patients with CHB. HBV-specific CD4+ and CD8+ T cell responses following 10-day in vitro stimulation with HBV overlapping peptide (OLP) pools with or without the addition of anti-PD-L1 antibody. (A) IFN-γ expression by HBV-specific CD4+ and CD8+ T cells of patients with different HBsAg level. Open circles mark three patients with HBsAg of 1000–10 000 IU/mL with the highest T cell response who showed all HBcrAg levels of <3 Log U/mL. (B) Correlation analyses of HBsAg residuals with difference or log2 fold change of HBV-specific CD4+ and CD8+ T cell responses after expansion in presence of anti-PD-L1. (C) IFN-γ expression by HBV-specific CD4+ and CD8+ T cells of patients with different levels of HBcrAg. Total-specific T cell response: sum of all 14 OLP pools. Statistical significance was tested by Wilcoxon test for non-parametric data and by paired t-test for parametric data (A, C). *p<0.05; **p<0.01; ***p<0.001. CHB, chronic hepatitis B; HBcrAg, hepatitis B core-related antigen; HBsAg, hepatitis B surface antigen; IFN, interferon; PD-L1, programmed cell death ligand 1.
Furthermore, the ability of HBV-specific T cells, especially CD4+ T cells, to produce multiple cytokines on stimulation were reduced with age (figure 3E).
Impact of HBsAg and HBcrAg levels on core18-specific and pol455-specific CD8+ T cells in HLA-A*02 positive patients with CHB
Recent studies showed that the phenotypical and functional profiles of HBV-specific CD8+ T cells are different in patients with CHB depending on the targeted HBV epitope,22 23 but the impact of HBsAg and HBcrAg levels was not assessed. Thus, we studied core18-specific and pol455-specific CD8+ T cells in 35 HLA-A*02 positive patients with CHB with different levels of HBsAg (<100 and >10 000 IU/mL) and HBcrAg (<3 and ≥3 Log U/mL) (table 2, online supplemental figure S1B). In line with previous studies,22 23 we confirmed that CD8+ T cells targeting HBV core18 showed higher IFN-γ expression after in vitro stimulation with cognate HBV peptides compared with pol455-specific CD8+ T cells but this was independent of HBsAg and HBcrAg (figure 4A). We subsequently selected 24 HLA-A*02 positive patients with CHB to assess the impact of HBsAg and HBcrAg levels on the phenotypical profile of core18-specific and pol455- specific CD8+ T cells by using peptide-MHC based dextramers enrichment (figure 4B, online supplemental figure S1B). Analysing the pattern of memory differentiation based on the expression of CD45RA and CCR7 showed that the frequency of naïve-like CD8+ T cells targeting pol455 was significantly higher than that targeting core18. In contrast, core18-specific CD8+ T cells showed significantly higher frequencies of effector memory phenotypes than pol455-specific CD8+ T cells (figure 4B). Expression of CD39, KLRG1, Eomes and Tbet were not significantly different between core18-specific and pol455-specific T cells. However, core18-specific CD8+ T cells displayed higher expression of PD-1 than pol455-specific CD8+ T cells (frequency as shown in figure 4B; mean of MFI core18 vs pol455: 375 vs 166, p value <0.0001, respectively). We also documented a higher co-expression of PD-1 and CD127 on core18-specific vs pol455-specific CD8+ T cells (figure 4B), but there was no difference in the expression of the transcription factor 1 (TCF1) among core18- specific and pol455-specific T cells (figure 4B). Importantly, there were no major differences in the phenotype of CD8+ T cells targeting core18 or pol455 in patients with different levels of HBsAg or HBcrAg except for KLRG-1 expression which is significantly increased on core18-specific CD8+ T cells in patients with HBsAg >10 000 IU/mL (figure 4C).
Impact of anti-PD-L1 blocking on HBV-specific CD4+ and CD8+ T cells
T cells are functionally exhausted in chronic HBV infection and could functionally be recovered by blocking the PD-1/PD-L1 interaction (reviewed in10 24–26). Therefore, we questioned if reversing functionally impaired HBV-specific T cells by targeting co-regulatory pathways is affected by the quantity of plasma HBsAg or HBcrAg. Interestingly, stimulation of PBMC with HBV-specific OLPs together with blockade of the PD-1/PD-L1 pathway resulted in significantly enhanced IFN-γ+ CD4+ T cells in patients with HBsAg <100 IU/mL and patients with HBsAg 1000–10 000 IU/mL (figure 5A). To ensure that the factor age does not influence on the correlation of HBsAg with functional restoration of T cells, we removed the impact of age by performing a semi-partial correlation (figure 5B). Subsequently, the analyses revealed a significant negative correlation of HBsAg residuals with IFN-γ+ CD4+ and IFN-γ+ CD8+ T cell restoration by blocking the PD-1/PD-L1 pathway.
When we analysed T cell restoration in patients with different level of HBcrAg, we observed significantly increased IFN-γ expression by both CD4+ and CD8+ T cell in patients with low HBcrAg (<3 Log U/mL) and by CD8+ T cell in the intermediate group (3–3.87 Log U/mL) (figure 5C). There was no significant impact of anti-PD-L1 blockade in patients with high HBcrAg. Of note, the three patients who had the greatest increase in CD4+ and CD8+ T cell response in the HBsAg group of 1000–10 000, accounting for the significant value in this group, showed all low HBcrAg levels of <3 Log U/mL.
Impact of anti-PD-L1 blocking on core18-specific and pol455-specific CD8+ T cells
Lastly, we evaluated the impact of plasma HBsAg and HBcrAg levels on responsiveness of core18-specific and pol455-specific CD8+ T cells to in vitro blockade of the PD-1/PD-L1 pathway. Representative flow cytometry plots from patients with CHB with different levels of HBsAg and HBcrAg after stimulation with HBV core18 and pol455 peptides in presence or absence of anti-PD-L1 antibody are shown in figure 6. Anti-PD-L1 had an effect on the IFN-γ response only when HBsAg and HBcrAg were low (<100 IU/mL and <3 log U/mL, respectively), but this was significant only for HBV pol455-specific CD8+ T cells.

Impact of PD-L1 blockade on HBV core18-specific and pol455-specific CD8+ T cell responses. HBV-specific CD8+ T cell responses following in vitro stimulation with core18-specific or pol455-specific peptides in presence or absence of anti-PD-L1 antibody. (A) Patients with CHB with HBsAg <100 or ≥10 000 IU/mL and (B) patients with CHB with HBcrAg <3 or >3 Log U/mL. Statistical significance was tested by Wilcoxon test. ns, not significant; *p<0.05; **p<0.01. CHB, chronic hepatitis B; HBcrAg, hepatitis B core-related antigen; HBsAg, hepatitis B surface antigen; IFN, interferon; PD-L1, programmed cell death ligand 1; pol, polymerase; TNF, tumour necrosis factor.
Discussion
Functional cure of chronic HBV infection, defined as sustained HBsAg loss, is the preferred target of HBV treatment and is rarely achieved in patients with CHB.2 3 Therefore, new antiviral and immunomodulatory therapies are being developed to improve this goal. To define the most appropriate candidates for these therapies, it may be important, for example, for immunomodulatory therapies to identify markers that correlate with HBV-specific immune responses. Quantitative HBsAg in particular is thought to play an important role in the impaired immune response and inability to clear HBV.6 In this study, we investigated the T cell response in patients with different HBsAg levels, but also considered another new HBV marker, HBcrAg, for which there are no data yet in terms of immune responses.
First, our data show that the overall T cell composition including CD4+ and CD8+ T cells, γδ T cells, MAIT cells and Treg cells remained almost unchanged in patients with CHB in relation to HBsAg levels, confirming previous studies.12
Notably, we observed a significant positive correlation of HBsAg levels and naïve CD8+ T cells and a significant negative correlation of quantitative HBsAg and central memory and effector memory CD8+ T cells. Since there is a negative correlation between HBsAg quantity and age, these differences in T cell populations are most likely attributed to patient age.27 28
Next, we show here that HBV-specific T cell function, as measured by in vitro response to peptide stimulation, was also not associated with the amount of HBsAg. This differs initially from a recent study that documented significantly higher HBV-specific polyfunctional CD4+ T cells in patients with low HBsAg levels (<500 IU/mL) compared with patients with high HBsAg levels (>50 000 IU/mL)13 but the influence of age on the T cell response was not considered. As observed here and also in other studies,6 12 HBsAg levels are negatively associated with age, and thus the HBV-specific T cell response, especially the pol CD4+ response, was negatively correlated with age in our study. A recent study by Le Bert et al was the first to suggest that it is not the amount of HBsAg at a given time point, but rather the duration of infection and antigen exposure that are related to the T cell response specific for the surface antigen.12 However, Le Bert et al showed in their study that T cells specific for HBV core and HBV pol did not decrease with age. It should be noted that their cohort was more heterogeneous and included a mixture of young HBeAg-positive and HBeAg-negative patients from Asia and Europe (UK).12 Our cohort included only adult HBeAg-negative patients from Europe, and the surface-specific T cell response was already almost absent. In addition, approximately 32% of our patients received NA treatment, but patients treated with NA were evenly distributed among age groups.
Yet, the main focus of our work was to analyse immune responses with HBcrAg level, since HBsAg may not be the most appropriate marker of cccDNA transcriptional activity, especially in HBeAg-negative patients16 17 because integrated HBV DNA is probably the main source of HBsAg in this population.6 29 Despite lower HBV DNA levels in HBeAg-negative patients, the intracytoplasmic expression of core can be high.30 HBcrAg, which accounts for HBeAg and core, thus could make the difference independent of HBsAg levels to be associated with core-specific and pol-specific immune responses in the adult HBeAg-negative population; and indeed we show that patients with low HBcrAg (<3.87 Log U/mL) had significantly higher HBV-specific CD4+ T cell responses, particularly against core and pol. Importantly in this context, HBV-specific CD4+ T cells showed a stronger response than CD8+ T cells in general. The stronger HBV-specific CD4+ T cell responses have already been observed by us in other projects.19 There is a possibility that some potential CD8+ T cell responses were not detected due to stimulation of the cells with 15-mer OLPs.31 However and importantly, CD4+ T cells appear to be more resistant to age-related phenotypical and functional changes than CD8+ T cells.32 This may help to explain why the age correlation for CD4+ T cell responses was stronger and the significance for the age correlation for CD8+ T cells was already lost in our adult cohort.
To gain more insight into the phenotype and function of HBV-specific CD8+ T cells, we used MHC I dextramer-based enrichment to detect low frequencies of HBV-specific CD8+ T cells targeting two known HLA-A*02-restricted epitopes, HBV core18 and HBV pol455 in HLA-A*02-positive patients with CHB. Consistent with recent reports,22 23 we confirm that these two epitope-specific CD8+ T cells exhibit distinct phenotypes with higher functionality and higher expression of PD-1+ and PD-1+/CD127+ (memory-like phenotypes) in core18-specific compared with pol455-specific CD8+ T cells. Here, we show that these differences between core18-specific and pol455-specific CD8+ T cells were not substantially influenced by the amount of HBsAg or HBcrAg measured in the blood of the individual patient. Because of the extremely low detection rate of surface-specific CD8+ T cells in patients with chronic HBV infection, we were unable to investigate the influence of HBsAg and HBcrAg on the phenotypic profile of CD8+ T cells targeting an epitope of the surface antigen. More comprehensive studies analysing HBV-specific CD8+ T cells restricted by other HLA class I molecules and HBV-specific CD4+ T cells restricted by HLA class II molecules are still needed. It would also be interesting to correlate viral markers with intrahepatic T cell responses, which was not possible in our study.
HBV-specific T cells show exhausted phenotypes in patients with CHB, and restoration of T cell function may be a useful therapeutic strategy for the control of HBV.9 Although HBsAg levels did not affect HBV-specific T cell responses, we demonstrated that T cells isolated from patients with lower HBsAg were more responsive to PD-L1 blockade. Consistent with a previous report,13 we observed a stronger effect of PD-1 blockade in HBV-specific CD4+ T cells than in HBV-specific CD8+ T cells. Interestingly, after removing the influence of age, we found a significant negative correlation between HBsAg residuals and CD4+ as well as CD8+ T cell recovery after PD-L1 blockade. This confirms the hypothesis that HBsAg reduction could be a therapeutic target to increase the rate of functional cure with immune therapies.5 Importantly, the difference in the effect of PD-L1 blockade was even more pronounced in the patient cohorts stratified by HBcrAg than in the groups stratified by HBsAg. Thus, the patients with higher HBsAg levels (1000–10 000 IU/mL) who had the best response to checkpoint blockade had exceptionally low HBcrAg levels <3 Log U/ml, suggesting that HBsAg in these patients may be derived from integrated HBV DNA. In addition, it is noteworthy that the effect of PD-L1 blockade was more distinct in the core-specific and pol-specific immune responses, which again, by analogy with the study by Le Bert et al,12 may suggest that the duration of HBsAg exposure is already too long and HBs-specific T cells are more difficult to revive. These data may therefore suggest that the extent and duration of cccDNA transcriptional activity may play an important role in the resuscitation ability of T cells. Likewise, in the cohort of HLA-A*02-positive patients, we observed an effect of PD-L1 blockade only in the group with low HBsAg and low HBcrAg. Interestingly, only the pol455-specific CD8+ T-cell response was significantly restored by PD-L1 blockade. It has been shown and discussed that pol455-specific and core18-specific CD8+ T cells have a different phenotype and the expansion of core-specific T cells positively correlated with PD-1+/CD127+ T cells, whereas pol455-specific T cells showed no such correlation.22 We also confirmed the higher PD-1+/CD127+ expression on core18-specific T cells in our study. We therefore hypothesise that core18-specific CD8+ T cells are not as impaired as pol455-specific T cells, so that additional immune checkpoint blockade might not have a significant impact on the expansion capacity and ultimately on the functionality of core18-specific T cells, whereas pol455-specific T cells can be restored by checkpoint blockade if HBsAg and HBcrAg are low. Nevertheless, the differential effect of PD-L1 blockade on different epitope responses needs further investigation and may be important for the development of immunotherapies. Based on our results, we suggest that lowering antigen level (HBsAg levels below a threshold of <100 IU/mL and especially HBcrAg levels below 3 Log U/mL) may increase in vitro responsiveness to immunomodulation. Importantly, this effect was not age dependent. Several clinical studies have indicated that a threshold of very low HBsAg levels <100 IU/mL is indicative of improved immunity. Indeed, HBsAg levels <100 IU/mL could be a marker to identify patients with a high probability of spontaneous or therapy induced HBsAg clearance.6 In addition, several retrospective studies suggest that some patients with very low HBsAg levels (<100 IU/mL)6 or low HBcrAg levels33 are able to maintain control of HBV after termination of long-term antiviral therapy with NA. The result is also consistent with studies in mouse models showing that HBsAg clearance by a monoclonal antibody partially reduces HBV-induced tolerance and improves B cell and CD4+ T cell responses to subsequent therapeutic vaccination34 and that HBsAg reduction using small interfering RNA improves the response of subsequent therapeutic vaccination, respectively.5
A possible limitation of our study is that it was conducted in a cross-sectional cohort of adult patients older than 18 years. The effects may be even more pronounced in children and adolescent patients.12 Since most patients with CHB developed the chronic infection in childhood,35 further data collection in children and adolescents with chronic HBV infection is needed to assess the long-term effects of different HBV viral marker on the functional and phenotypic profiles of HBV-specific T cells.
We also need to discuss that liver inflammation, as indicated by elevated ALT levels, might also contribute to altered and impaired HBV-specific T cell responses, as it has been shown, for example, that deficiency of arginine in the inflamed liver is a possible mechanism for defects in CD8 T cell signalling and function.36 However, ALT levels in our cohort were elevated only in a minority of patients and did not show a correlation with T cell responses.
In summary, our data suggest that the amount of HBsAg per se does not affect the composition of total immune cells or the phenotype and function of HBV-specific T cells in adult HBeAg-negative patients. However, age, which may reflect the duration of antigen exposure, and HBcrAg, which is suggested a better indicator of cccDNA transcriptional activity, may have an important impact on T cell response and should therefore be considered as important stratifier for patient selection. Importantly, very low antigen levels may influence T cell response to immunomodulatory treatment (eg, checkpoint inhibition). Therefore, the combination of lowering antigen load (both HBsAg and in particular HBcrAg) together with checkpoint inhibitors such as PD-1/PD-L1 blockade or other therapeutic immune interventions may be a promising option to cure chronic HBV infection in the future.
Data availability statement
All data relevant to the study are included in the article or uploaded as supplementary information. All data relevant to the study are included in the article or uploaded as supplementary information. As requested by reviewer 2 we deleted some redundant suplemnetary figure. Howeverm, the data can always be requested.
Ethics statements
Patient consent for publication
Ethics approval
The study was approved by the Ethic Committee of Hannover Medical School (ethical official number: 3374–2016).
Acknowledgments
Supplementary figure 1 was created with BioRender.com.
References
Supplementary materials
Supplementary Data
This web only file has been produced by the BMJ Publishing Group from an electronic file supplied by the author(s) and has not been edited for content.
Supplementary Data
This web only file has been produced by the BMJ Publishing Group from an electronic file supplied by the author(s) and has not been edited for content.
Footnotes
ARMK and MC are joint senior authors.
Contributors EA, ARMK and MC were responsible for the concept and design of the study. EA and MU-Q performed the experiments and the data analysis. BM and BB contributed the hepatitis B core-related antigen analysis. MG and YL supported the statistical analysis. CEN provided the clinical data from the patients. All authors contributed to the data interpretation. EA, MU-Q, ARMK, HW and MC wrote the manuscript. ARMK and MC are responsible for the overall content. All authors critically revised the manuscript.
Funding This work was funded by the Deutsche Forschungsgemeinschaft (DFG, German Research Foundation) under Germany's Excellence Strategy - EXC 2155 - project number 390874280 and by the German Center for Infection Research, DZIF (TTU‐05‐701, TTU‐05‐702, TTU-IICH-07-808). Elmira Aliabadi and Melanie Urbanek-Quaing were supported by the Hannover Biomedical Research School (HBRS) and the Center for Infection Biology (ZIB).
Competing interests None declared.
Provenance and peer review Not commissioned; externally peer reviewed.
Supplemental material This content has been supplied by the author(s). It has not been vetted by BMJ Publishing Group Limited (BMJ) and may not have been peer-reviewed. Any opinions or recommendations discussed are solely those of the author(s) and are not endorsed by BMJ. BMJ disclaims all liability and responsibility arising from any reliance placed on the content. Where the content includes any translated material, BMJ does not warrant the accuracy and reliability of the translations (including but not limited to local regulations, clinical guidelines, terminology, drug names and drug dosages), and is not responsible for any error and/or omissions arising from translation and adaptation or otherwise.