Article Text

Abstract
Objective Kupffer cells (KCs) protect against hepatocellular carcinoma (HCC) by communicating with other immune cells. However, the underlying mechanism(s) of this process is incompletely understood.
Design FVB/NJ mice were hydrodynamically injected with AKT/Ras and Sleeping Beauty transposon to induce HCC. Mini-circle and Sleeping Beauty were used to overexpress microRNA-206 in KCs of mice. Flow cytometry and immunostaining were used to evaluate the change in the immune system.
Results Hydrodynamic injection of AKT/Ras into mice drove M2 polarisation of KCs and depletion of cytotoxic T cells (CTLs) and promoted HCC development. M1-to-M2 transition of KCs impaired microRNA-206 biogenesis. By targeting Klf4 (kruppel like factor 4) and, thereby, enhancing the production of M1 markers including C-C motif chemokine ligand 2 (CCL2), microRNA-206 promoted M1 polarisation of macrophages. Indeed, microRNA-206-mediated increase of CCL2 facilitated hepatic recruitment of CTLs via CCR2. Disrupting each component of the KLF4/CCL2/CCR2 axis impaired the ability of microRNA-206 to drive M1 polarisation of macrophages and recruit CTLs. In AKT/Ras mice, KC-specific expression of microRNA-206 drove M1 polarisation of KCs and hepatic recruitment of CTLs and fully prevented HCC, while 100% of control mice died from HCC. Disrupting the interaction between microRNA-206 and Klf4 in KCs and depletion of CD8+ T cells impaired the ability of miR-206 to prevent HCC.
Conclusions M2 polarisation of KCs is a major contributor of HCC in AKT/Ras mice. MicroRNA-206, by driving M1 polarisation of KCs, promoted the recruitment of CD8+ T cells and prevented HCC, suggesting its potential use as an immunotherapeutic approach.
- hepatocellular carcinoma
- Kupffer cell
- immunotherapy
Data availability statement
All data relevant to the study are included in the article or uploaded as supplementary information.
This is an open access article distributed in accordance with the Creative Commons Attribution Non Commercial (CC BY-NC 4.0) license, which permits others to distribute, remix, adapt, build upon this work non-commercially, and license their derivative works on different terms, provided the original work is properly cited, appropriate credit is given, any changes made indicated, and the use is non-commercial. See: http://creativecommons.org/licenses/by-nc/4.0/.
Statistics from Altmetric.com
Significance of this study
What is already known on this subject?
MiR-206 is reduced in human hepatocellular carcinoma (HCC).
KLF4 is a repressor of NF-κB signalling.
What are the new findings?
Activation of AKT/Ras signalling shifts M1 to M2 polarisation of KCs, which impairs hepatic enrichment of cytotoxic T cells (CTLs).
AKT/Ras signalling impairs biogenesis of miR-206 in Kupffer cells (KCs), which primarily accounts for reduced miR-206 in HCC.
KC-specific expression of miR-206 fully prevents HCC and leads to a significant regression of advanced HCC tumours in AKT/Ras mice.
KC-specific expression of miR-206 reestablishes the ratio of M1/M2 KCs by driving M1 polarisation of KCs, which triggers hepatic enrichment of CTLs.
MiR-206 promotes the production and release of CCL2 by modulating the KLF4-NFκB signalling in KCs.
By activating the CCL2/CCR2 axis, miR-206 enhances the communication of macrophage with CD8+ T cells and thereby migration of CD8+ T cells.
Disrupting the interaction between miR-206 and Klf4 and depletion of CD8+ T cells impair the ability of miR-206 to prevent HCC.
How might it impact on clinical practice in the foreseeable future?
Our data suggest that miR-206 is a potential immunotherapeutic approach against HCC.
Introduction
Hepatocellular carcinoma (HCC) is among the most prevalent and lethal cancers worldwide.1 Despite the development of effective antiviral therapeutics, the incidence of HCC continues to increase, in part driven by the epidemic of non-alcoholic fatty liver disease (NAFLD).2 The strong immune-mediated pathogenesis of HCC makes this malignancy particularly attractive for immunotherapies. Specifically, various factors of the host’s immunity to HCC are strongly geared towards immune-suppression by unresolved proinflammatory stimuli that accompany hepatic fibrogenesis through immunoediting.3 4 However, the complexity of the HCC tumour microenvironment (TME) highlights the presence of multiple non-redundant mechanisms of cancer immune-suppression, which synergises in defining a significant barrier of resistance to immunotherapy. Thus, understanding the underlying mechanisms of immunosuppression in HCC is critical for developing novel therapeutic agents without unwanted immune response.
Kupffer cells (KCs) account for approximately 15% of the total liver cell population.5 6 KCs have long been considered to function primarily as scavenger cells responsible for removing particulate material from the portal circulation.5 Some studies, however, have reported the role of KCs in viral infections, after ischaemia-reperfusion injury and in the context of NAFLD.5 KCs express histocompatibility complex (MHC) class I and class II, as well as costimulatory molecules and are able to initiate an antigen-specific immune response.7 Furthermore, KCs demonstrate phagocytic and cytokine-producing capacities, which differs from those of other infiltrating macrophages.8 Although the role of KCs in HCC remains controversial, there is compelling evidence that KCs represent an important line of defence against HCC.9
Macrophages can be induced into two distinct polarisation phenotypes: classically activated M1 and alternatively activated M2.10 There is a balance between M1 and M2 KCs in the healthy liver, with their opposing functions. In HCC, KCs undergo an M1 to M2 phenotypic shift, which promotes cancer growth by suppressing the adaptive immune system.11 M1 KCs suppress early HCC tumourigenesis by eliminating cancer cells as soldiers of adaptive immunity.10 It is now well established that polarisation of KCs is involved in CD8+ T cells recruitment and their inability to reach tumour cells is an important mechanism of resistance to immunotherapy.
Mechanistically, AKT activation is required for M2 activation.12 Coordinated activation of the AKT/mTOR and RAS/MAPK cascades is also associated with biological aggressiveness and poor prognosis of HCC.13 This phenotype can be recapitulated in vivo by hydrodynamically transfecting activated forms of AKT (myr-AKT) and NRas (NRas-V12) oncogenes (AKT/Ras) into the mouse liver.13 14 Our preliminary data showed that, in addition to hepatocytes, hydrodynamic delivery also activated AKT signalling in KCs, which led to dysregulation of microRNA (miRNAs). MiRNAs are a class of small non-coding RNAs that simultaneously fine tune many pathways.15 16 This characteristic of miRNAs allows us to speculate that they could precisely regulate immune response and avoid excessive or inadequate immune response. In this study, we used AKT/Ras mice to investigate the contribution of KCs to immune homeostasis and HCC and determined how a miRNA modulated immunological pathways and HCC development.
Materials and methods
Construction of KC-specific expression vector for miR-206
A 400 bp fragment containing the miR-206 precursor amplified from mouse genomic DNA was inserted into a pT3-EF1α vector. CD68 promoter was used to ensure KC-specific expression of miR-206 (pT3-CD68p-miR-206). To rule out non-specific effects of the plasmid, we generated a miR-206 mismatched-expression vector, referred to as pT3-CD68p-scramble. Construct details for pT3-EF1α-myr-AKT, nRasV12/pT2-CAGGS and pCMV/SB were described in our previous publication.17 The miR-206 precursor or scramble was inserted into a mini-circle (MC) vector (System Biosciences, California, USA) and referred to as MC-CD68p-miR-206 or MC-CD68p-scramble. All MCs were prepared based on the manufacturer’s instructions.
Establishment of AKT/Ras mice
Eight-week-old FVB/NJ mice were obtained from Jackson Laboratory (Farmington, Connecticut, USA). Hydrodynamic injection (HDI) was performed as previously described.17 To evaluate the effect of miR-206 on AKT/Ras-induced HCC, mice (n=6) were hydrodynamically injected with 5 µg pT3-EF1α-myr-AKT, 5 µg NRasV12/pT2-CAGGS, 10 µg pT3-CD68p-miR-206 and 0.8 µg pCMV/SB. Control mice (n=6) received 5 µg pT3-EF1α-myr-AKT, 5 µg NRasV12/pT2-CAGGS, 10 µg pT3-CD68p-scramble and 0.8 µg pCMV/SB. The plasmid mixtures were diluted in 2 mL saline (0.9% NaCl), filtered through 0.22 µm filter and injected into the lateral tail vein of mice in 5–7 s. Mice were housed, fed and monitored in accordance with protocols approved by the committee for animal research at the University of Minnesota.
Therapeutic mouse model of AKT/Ras
To evaluate the therapeutic potential of miR-206, 8-week-old FVB/NJ mice were injected with AKT/Ras as described previously.17 Three weeks postinjection of AKT/Ras, mice were treated with MC-CD68p-miR-206 or MC-CD68p-scramble at a dose of 1.5 mg/kg (intravenously) weekly for 4 weeks.
Depletion of CD8+ T cells in mice
CD8+ T cell depletion was performed by intraperitoneal injection of 100 µg of CD8 monoclonal antibody (mAb) (Bio X cell, BE00223). Six mice were hydrodynamically injected with 4 µg pT3-EF1α-myr-AKT, 4 µg NRasV12/pT2-CAGGS, 10 µg pT3-CD68p-scramble and 0.72 µg pCMV/SB, and 12 mice were injected with 4 µg pT3-EF1α-myr-AKT, 4 µg NRasV12/pT2-CAGGS, 10 µg pT3-CD68p-miR-206 and 0.72 µg pCMV/SB. One day postinjection, 12 mice were randomly allocated into two groups and treated with IgG1 isotype mAb (Bio X cell, BE0088) (n=6) or CD8 mAb (n=6). Mice were injected with mAb every 2 days for 7 weeks. Seven weeks postinjection, mice were sacrificed.
Statistical analysis
Statistical analysis was performed using GraphPad Prism Software. Data derived from cell-line experiments were presented as mean±SEM and assessed by a two-tailed Student’s t-test. Two-way analysis of variance was used to compare statistical difference among multiple groups. Mann-Whitney test was used to evaluate the statistical significance for mouse experiments. P<0.05 was considered to be statistically significant.
Additional materials and methods are available in online supplemental material.
Supplemental material
Results
Activation of AKT/Ras signalling promoted M2 polarisation of KCs
HDI of AKT/Ras triggered lethal HCC (figure 1A, online supplemental figure 1A,B). AKT signalling activation in hepatocytes was thought to be the major cause of HCC development in AKT/Ras mice. However, in addition to hepatocytes, HDI of AKT/Ras drove expression of AKT1 in KCs (online supplemental figure 1C). Unfortunately, the contribution of AKT/Ras signalling in KCs to HCC is poorly understood. An increase in KCs and infiltrating macrophages was observed in HCC tumours of AKT/Ras mice (online supplemental figure 1D–G). Considering the documented roles of M2 macrophages on protumour phenotypes,18 we analysed the effect of AKT/Ras on M2 polarisation of KCs. In mice, HDI of AKT/Ras significantly increased expression of typical M2 markers in KCs (figure 1B). Conversely, expression of genes encoding M1 markers including inducible nitric oxide synthase (iNOS), CCL2, interleukin 6 (IL-6) and tumour necrosis factor alpha (TNFα) was significantly reduced in KCs of AKT/Ras mice (figure 1C). To confirm this observation, CD206 (mannose receptor C type 1, M2 marker), iNOS (M1 marker) and CLEC4F (C-type lectin domain family 4 member F, KC marker) were stained in livers of AKT/Ras mice. The number of M2 KCs (CD206+CLEC4F+) was considerably more prominent (figure 1D,E, online supplemental figure 1H), while that of M1 KCs (iNOS+CLEC4F+) was significantly reduced in AKT/Ras mice (figure 1F,G, online supplemental figure 1H). Flow cytometry analysis confirmed an enhanced M1-to-M2 transition of KCs in AKT/Ras mice 5 weeks postinjection of AKT/Ras (online supplemental figure 2A–D). One-week postinjection of AKT/Ras, enhanced M2 polarisation of KCs was also observed in AKT/Ras mice (online supplemental figure 2E). In vitro, overexpression of AKT/Ras in KCs isolated from wild-type mice also triggered their M2 polarisation (online supplemental figure 2F). Furthermore, activation of AKT signalling in KCs was a hallmark in HCC patients (figure 1H).
Supplemental material
Supplemental material

AKT/Ras activation promoted M2 polarisation of KCs. (A) Representative photos of livers of FVB/NJ mice injected with pT3-EF1α (control, n=6, 5 w.p.i.) and AKT/Ras (n=6, 5 w.p.i.). (B) mRNA levels of M2 marker genes encoding MGL2, IL-10, MGL1 and ARG1 in KCs of two groups of mice. (C) mRNA levels of M1 marker genes in KCs of two groups of mice. (D–E) Immunostaining of CD206 (M2 marker) and CLEC4F (KC marker) and the ratios of M2 KCs (CD206+CLEC4F+) in livers of two groups of mice. Scale bar: 20 μm. (F–G) Immunostaining of iNOS (M1 marker) and CLEC4F and the ratios of M1 KCs (iNOS+CLEC4F+) in livers of two groups of mice. Scale bar: 10 μm. (H) Immunostaining of CLEC4F and phosphorylated-AKT (AKT-S473) in livers of human patients. Scale bar: 50 μm. (I) Immunostaining of CD8 and CLEC4F, and the numbers of CD8+ T cells per 1000 liver cells in two groups of mice. Scale bar: 100 μm. Data represent mean±SEM. **P<0.01 and ***p<0.001 (figure 1A–G and I: Mann-Whitney U test). ARG1, arginase 1; KCs, Kupffer cells; LW, liver weight; MGL2, macrophage galactose N-acetyl-galactosamine specific lectin 2; w.p.i., weeks postinjection of AKT/Ras.
M1 KCs represent a significant source of chemoattractant molecules for CD8+ T cells. Consistent with reduced M1 KCs, both CD8+ T cells and CTLs (CD8+GrB+) were reduced in HCC tumours of AKT/Ras mice (figure 1I, online supplemental figure 2G–H). Taken together, activation of AKT/Ras signalling triggered M2 transition of KCs and reduced hepatic CTLs.
KC-specific expression of miR-206 prevented HCC in AKT/Ras mice
The exquisite ability of miRNAs to fine-tune gene expression makes them an ideal candidate to precisely modulate an imbalanced immune system.19 MiRNA profile revealed that microRNA-206 (miR-206) was one of the most reduced miRNAs in HCC tumours of AKT/Ras mice (online supplemental figure 3A and table 1). Reduced miR-206 was also observed in HCC patients with various aetiologies (online supplemental table 2). Low levels of miR-206 predicted a poor survival rate of HCC patients (online supplemental figure 3B). Further analysis revealed that levels of miR-206 were fivefold higher in KCs than in hepatocytes isolated from healthy mouse livers (figure 2A). HCC development led to a fivefold reduction of miR-206 in KCs, while only a twofold reduction of miR-206 was observed in hepatocytes isolated from tumours of AKT/Ras HCC mice (figure 2B), indicating that impaired biogenesis of miR-206 in KCs primarily accounted for the observed reduction of miR-206 in livers of AKT/Ras mice. MiR-206 was much lower in M2 KCs versus M1 KCs isolated from healthy mouse livers (figure 2C).
Supplemental material
Supplemental material
Supplemental material

KC-specific expression of miR-206 prevented HCC in AKT/Ras mice. (A) miR-206 levels in KCs and hepatocytes (HCs) isolated from wild-type FVB/NJ mice. (B) Levels of miR-206 in KCs and HCs from FVB/NJ mice injected with pT3-EF1α (control, n=6, 5 w.p.i.) and AKT/Ras (n=6, 5 w.p.i.). (C) miR-206 levels in M1 and M2 KCs isolated from wild-type FVB/NJ mice. (D) Kaplan-Meier survival curves of AKT/Ras mice injected with pT3-CD68p-scramble (AKT/Ras, n=6) or pT3-CD68p-miR-206 (AKT/Ras/miR-206, n=6). (E) Macroscopic and microscopic (H&E) appearance of livers from AKT/Ras/scramble (n=6, 5 w.p.i.) and AKT/Ras/miR-206 mice (n=6, 5 w.p.i.). (F) Study design to evaluate the therapeutic effect of miR-206 on HCC. (G) Kaplan-Meier survival curves of AKT/Ras mice injected with MC-CD68p-scramble (AKT/Ras, n=6) or MC-CD68p-miR-206 (AKT/Ras/miR-206, n=6). (H) Macroscopic and microscopic (H&E) appearance of livers from AKT/Ras (n=6, 3 w.p.i.), AKT/Ras/MC-CD68p-scramble (n=6, 7 w.p.i.) and AKT/Ras/MC-CD68p-miR-206 mice (n=6, 7 w.p.i.). Data represent mean±SEM. **P<0.01 (figure 2A–C and E: Mann-Whitney U test; figure 2D and G: log-rank test; figure 2H: two-way analysis of variance test). KCs, Kupffer cells; w.p.i., weeks postinjection of AKT/Ras.
We investigated the effect of manipulating miR-206 in KCs of AKT/Ras mice. HDI of pT3-CD68p-miR-206 led to increased miR-206 in KCs of AKT/Ras mice, while no significant change was observed in miR-206 in hepatocytes of AKT/Ras mice (online supplemental figure 3C–E). Phenotypically, all AKT/Ras/scramble mice died from HCC 6–8 weeks postinjection, while all miR-206-treated AKT/Ras mice were healthy at this stage (figure 2D). On dissection, no tumour nodules were observed in AKT/Ras/miR-206 mice (figure 2E). We next allowed AKT/Ras mice to develop HCC and then treated them with MC-CD68p-miR-206 (figure 2F, online supplemental figure 3F). Within 5–9 weeks postinjection of AKT/Ras, all scramble-treated mice died from HCC, while the AKT/Ras/miR-206 mice appeared healthy (figure 2G). On dissection, 4 weeks of miR-206 treatment led to a significant regression of advanced HCC induced by AKT/Ras (figure 2H).
MiR-206 attenuated M2 polarisation of KCs in AKT/Ras mice
HDI drove expression of miR-206 primarily in KCs rather than infiltrating macrophages (online supplemental figure 3G). M2 KCs suppresses CD8+ T cell recruitment to the TME.20 We next investigated the effects of KC-specific expression of miR-206 on M2 polarisation of KCs and hepatic recruitment of CD8+ T cells in AKT/Ras mice. Both total KCs and infiltrating macrophages were reduced in livers of AKT/Ras/miR-206 mice (online supplemental figure 4A,B). Immunostaining and flow cytometry revealed that M1 KCs were markedly increased, while M2 KCs were decreased in livers of AKT/Ras/miR-206 mice (figure 3A,B, online supplemental figure 4C–G). However, no HCC was identified in AKT/Ras/miR-206 mice (figure 2E). Therefore, we cannot rule out the possibility that the M2-to-M1 switch of KCs in AKT/Ras/miR-206 mice was due to lack of HCC rather than miR-206-mediated activation of M1 polarisation of KCs. To exclude this possibility, we analysed M1/M2 KCs in AKT/Ras mice bearing tumours before and after miR-206 injection (therapeutic model). Again, KC-specific expression of miR-206 drove M2-to-M1 switch of KCs in livers of AKT/Ras mice (figure 3C,D, online supplemental figure 5). Overall changes in M1/M2 KCs promoted us to explore general changes in the inflammation of the TME. Expression of anti-inflammatory marker genes was increased, while levels of proinflammatory genes were reduced in tumours of AKT/Ras mice (online supplemental figure 6A,B). In contrast, miR-206 reversed the effects of AKT/Ras (online supplemental figure 6A,B). These results are consistent with the previous report that AKT signalling restricts proinflammatory and promotes anti-inflammatory responses.21 KC-specific expression of miR-206 also normalised intracellular oxidative stress that was elevated in AKT/Ras mice (online supplemental figure 6C).
Supplemental material
Supplemental material
Supplemental material

miR-206 attenuated M2 polarisation of KCs in AKT/Ras mice. (A and B) Immunostaining of iNOS, CD206 and CLEC4F (KC-specific marker) and the ratios of M1 or M2 KCs in livers of AKT/Ras mice injected with pT3-CD68p-scramble (n=6, 5 w.p.i.) or pT3-CD68p-miR-206 mice (n=6, 5 w.p.i.). (C and D) Immunostaining of iNOS, CD206 and CLEC4F and the ratios of M1 or M2 KCs in livers of AKT/Ras (n=6, 3 w.p.i.), AKT/Ras/MC-CD68p-scramble (n=6, 7 w.p.i.) and AKT/Ras/MC-CD68p-miR-206 (n=6, 7 w.p.i.) mice. Data represent mean±SEM. **P< 0.01 and NS (figure 3A–B: Mann-Whitney U test; figure 3C–D: two-way analysis of variance test). Scale bar: figure 3A and C: 10 μm; figure 3B and D: 20 μm. KCs, Kupffer cells; NS, no significance; w.p.i., weeks postinjection of AKT/Ras.
Mechanistically, KC-specific expression of miR-206 significantly induced expression of genes encoding M1 markers including CCL2, iNOS, cyclooxygenase 2 (COX-2), TNFα and IL-6 in KCs rather than hepatocytes (figure 4A, online supplemental figure 7A). Serum levels of these cytokines were also significantly increased in AKT/Ras/miR-206 mice (figure 4B). In contrast, mRNA levels of M2 marker genes and their serum levels were significantly reduced in AKT/Ras/miR-206 mice (online supplemental figure 7B,C). CCL2 expression is triggered on exposure to inflammatory stimuli including IL-6 and TNFα.22 Simultaneous upregulation of CCL2, TNFα and IL-6 confirmed the function of miR-206 in inducing M1 polarisation of KCs. CCL2 is renowned for its ability to drive chemotaxis of CD8+ T cells and regulatory T cells (Tregs) via CCR2 (C-C motif chemokine receptor 2).23 It was also reported that CCL2 attracted Tregs in HCC.24 Unexpectedly, our database mining revealed that CCL2 was significantly reduced in HCC, colon cancer, lung adenocarcinoma, lung squamous cell carcinoma and rectum adenocarcinoma versus adjacent normal tissues (figure 4C). Furthermore, low levels of CCL2 and CCR2 predicted a poor survival rate of HCC patients in the TCGA database (online supplemental figure 8A–C). A positive correlation of miR-206 with CCL2 and TNFα as well as CTL markers was observed in HCC patients (online supplemental figure 8D,E). These findings led us to speculate that the CCL2-CCR2 axis could attract CD8+ T cells. Indeed, miR-206 increased hepatic CD8+ T cells and CTLs (figure 4D,E, online supplemental figure 9A–D) and promoted aggregate of CD8+ T cells in proximity to KCs in AKT/Ras/miR-206 mice (both prevention and therapeutic models) (figure 4D,E, online supplemental figure 9E,F). Taken together, miR-206 promoted M1 polarisation of KCs and hepatic recruitment of CD8+ T cells.
Supplemental material
Supplemental material
Supplemental material
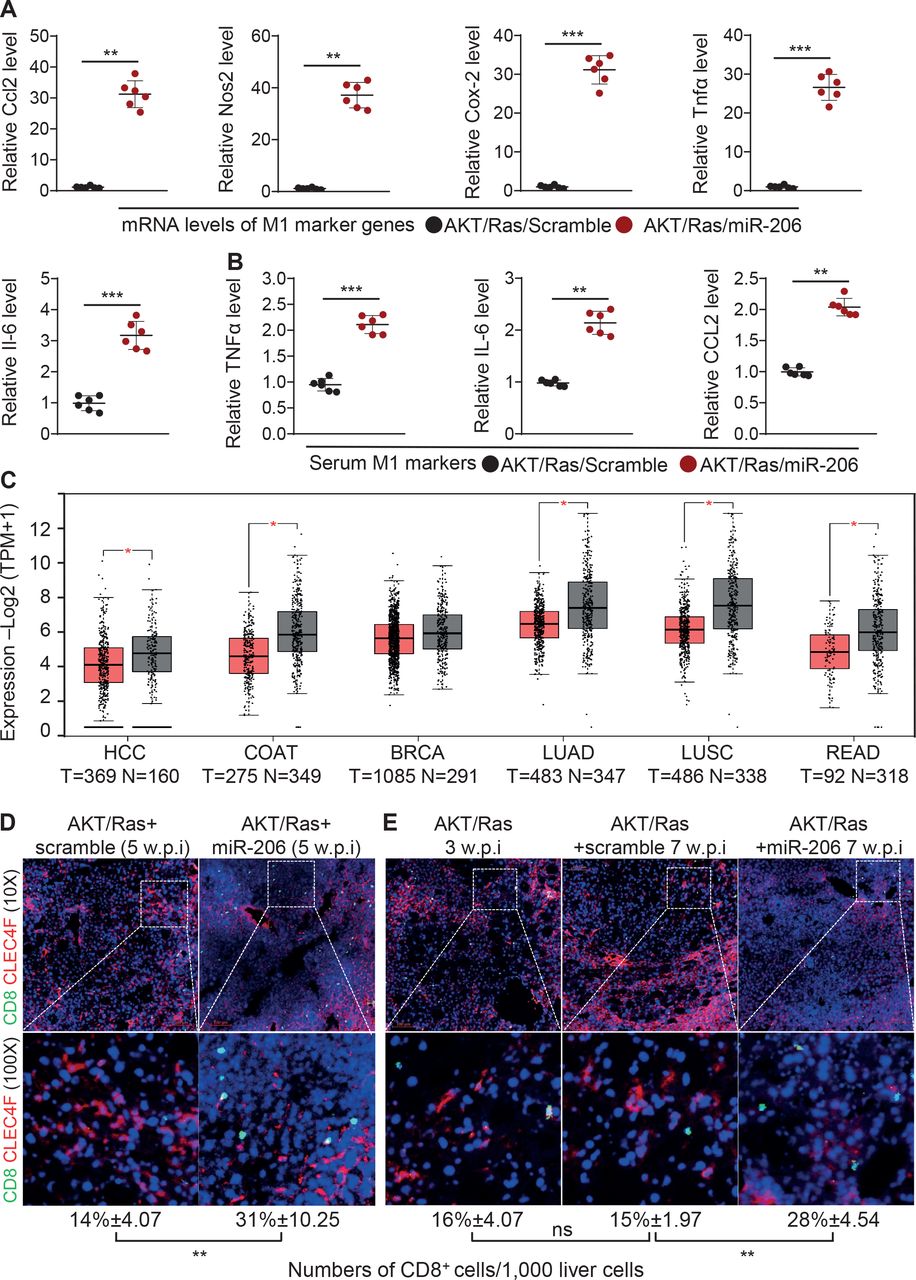
miR-206 promoted hepatic recruitment of CD8+ T cells by driving CCL2 production. (A) mRNA levels of M1 marker genes in KCs of AKT/Ras/scramble (n=6, 5 w.p.i.) and AKT/Ras/miR-206 (n=6, 5 w.p.i.) mouse cohorts. (B) Serum levels of TNFα, IL-6 and CCL2 in two groups of mice. (C) mRNA levels of CCL2 in HCC, colon cancer (COAT), breast cancer (BRCA), lung adenocarcinoma (LUAD), lung squamous cell carcinoma (LUSC) and rectum adenocarcinoma (READ) in the TCGA database (T: tumour; N: normal livers). Expression levels were shown as Log2 (TPM+1). (D) Immunostaining of CD8, CLEC4F and the numbers of CD8+ cells per 1000 liver cells in two group of mice. (E) Immunostaining of CD8 and CLEC4F and the numbers of CD8+ cells per 1000 liver cells in AKT/Ras (n=6, 3 w.p.i.), AKT/Ras/MC-CD68p-scramble (n=6, 7 w.p.i.) and AKT/Ras/ MC-CD68p-miR-206 (n=6, 7 w.p.i.). Data represent mean±SEM. *P<0.05, **p<0.01 and ***p<0.001 (figure 4A, B D: Mann-Whitney U test; figure 4C: two-tailed Student’s t-test; figure 4E: two-way analysis of variance test). Scale bar: 100 μm. HCC, hepatocellular carcinoma; KCs, Kupffer cells; TPM, transcripts per million; w.p.i., weeks postinjection of AKT/Ras.
MiR-206 drove M1 polarisation of human and mouse macrophages
We next performed gain of function for miR-206 to promote M1 polarisation of mouse RAW264.7 and human THP-1 macrophages. Overexpression of miR-206 in RAW264.7 and THP-1 cells enhanced induction of M1 markers by 2.0-fold to 21-fold (figure 5A,C) but significantly reduced mRNA levels of M2 markers (online supplemental figure 10). Flow cytometry confirmed that miR-206 led to a fivefold increase in iNOS positive RAW264.7 and THP-1 cells (figure 5B,D). Together, miR-206 promoted M1 polarisation of both human and mouse macrophages.
Supplemental material

miR-206 triggered M1 polarisation of both human and mouse macrophages. (A and C) mRNA levels of M1 marker genes in RAW264.7 and THP-1 cells transfected with pT3-CD68p-miR-206 (miR-206) or pT3-CD68p-scramble (control). (B and D) Flow cytometry analysis of iNOS+ cells in RAW264.7 and THP-1 cells transfected with pT3-CD68p-miR-206 or pT3-CD68p-scramble. Data represent mean±SEM. **P<0.01 (figure 5: two-tailed Student’s t-test).
KLF4 mediates the role of miR-206 in promoting M1 polarisation of macrophages
MiRNAs inhibit expression of their targets. However, miR-206 upregulated Ccl2 in KCs. We, therefore, speculated that miR-206 promoted expression of Ccl2 in KCs via a dual inhibitory mechanism by which miR-206 promoted transcription of Ccl2 by targeting a transcription repressor of Ccl2. We first attempted to identify miR-206 targets that were specifically expressed in macrophages. Combining database mining of single cells sequencing of hepatocytes and macrophages and bioinformatic prediction (online supplemental table 3), we identified seven potential targets of miR-206 that were specifically expressed in macrophages (online supplemental table 4). Among the potential targets of miR-206, KLF4 was the only gene encoding a transcription repressor that could modulate macrophage polarisation by impairing the ability of NF-κB.25 The promoters of several M1 marker genes contain NF-κB binding sites.26 We, therefore, speculated that miR-206 promoted CCL2 production by directly targeting the KLF4-NF-κB axis, which triggered M1 polarisation of KCs. The miR-206 binding site within the 3′UTR of Klf4 was conserved between human and mouse (figure 6A). Both Klf4 and Ccl2 were primarily expressed in KCs compared with hepatocytes (figure 6B). Overexpression of miR-206 in RAW264.7 cells robustly decreased Klf4 but increased Ccl2 (figure 6C). Luciferase assay confirmed the direct binding of miR-206 to the 3′UTRs of Klf4 in both mouse and human macrophages (figure 6D, online supplemental figure 11A,B). KLF4 impairs the recruitment of coactivators to NF-κB sites.25 Thus, we reasoned that KLF4 impaired the recruitment of cofactors that augment NF-κB (p65) transcriptional activity. Indeed, overexpression of p65 drove expression of M1 markers in RAW264.7 cells, while additional treatment of Klf4 offset the promoting effect of p65 (figure 6E).
Supplemental material
Supplemental material
Supplemental material

KLF4 mediated the role of miR-206 in promoting M1 polarisation of macrophages. (A) Graphic representation of the conserved miR-206 binding motif within the 3’UTR of Klf4. Complementary sequence to the seed region of miR-206 within the 3’UTR of Klf4 is conserved between human and mouse (highlighted in green). (B) mRNA levels of Klf4 and Ccl2 in hepatocytes and KCs isolated from wild-type FVB/NJ mice. (C) mRNA levels of Klf4 and Ccl2 in RAW264.7 cells transfected with pT3-CD68p-miR-206 or pT3-CD68p-scramble (control). (D) Luciferase activities of the reporter constructs containing either wild-type or mutated 3’UTR of mouse Klf4 after transfection of pT3-CD68p-scramble (control) or pT3-CD68p-miR-206. (E) mRNA levels of M1 maker genes in RAW264.7 Cells transfected with pT3-EF1α (control), pT3-p65 (p65) or a combination of pT3-Klf4 and pT3-p65 (p65+KLF4). (F) Protein levels of KLF4 and CCL2 in three groups of RAW264.7 cells transfected with pT3-CD68p-scramble, pT3-CD68p-miR-206 or a combination of pT3-CD68p-miR-206 and a sgRNA designed to ablate the binding site within the 3’UTR of Klf4. (G) mRNA levels of M1 marker genes in three groups of RAW264.7 cells. (H) Levels of iNOS, COX-2, TNFα and CCL2 in cell lysates of three groups of RAW264.7 cells. (I–J) Immunostaining of iNOS and the ratios of iNOS+ cells in three groups of RAW264.7 cells. Data represent mean±SEM. *P<0.05, **p<0.01, ***p<0.001 and NS (figure 6B–D: two-tailed Student’s t-test; figure 6E–J: two-way analysis of variance test). COX-2, cyclooxygenase 2; KCs, Kupffer cells; NS, no significance.
To determine whether KLF4 was essential for miR-206 to induce M1 polarisation, we employed a genome-editing approach to ablate the miR-206 binding site within the 3’UTR of Klf4. Such a design impaired the ability of miR-206 to repress expression of Klf4 in RAW264.7 cells (figure 6F). MiR-206 drove M1 polarisation of RAW264.7 cells, while ablation of the miR-206 binding site abolished the effect of miR-206 (figure 6G–J, online supplemental figure 11C). Disrupting the interaction between miR-206 and KLF4 also impaired the ability of miR-206 to induce M1 polarisation of THP-1 cells (online supplemental figure 11D,E). In addition, the KLF4-NFκB axis was repressed in KCs of AKT/Ras mice, while this signalling was recovered in KCs of AKT/Ras/miR-206 mice (online supplemental figure 12). In sum, miR-206, by modulating the KLF4-NF-κB axis, triggered M1 polarisation of macrophages.
Supplemental material
MiR-206 enhanced expansion and migration of CD8+ T cells via the CCL2/CCR2 axis
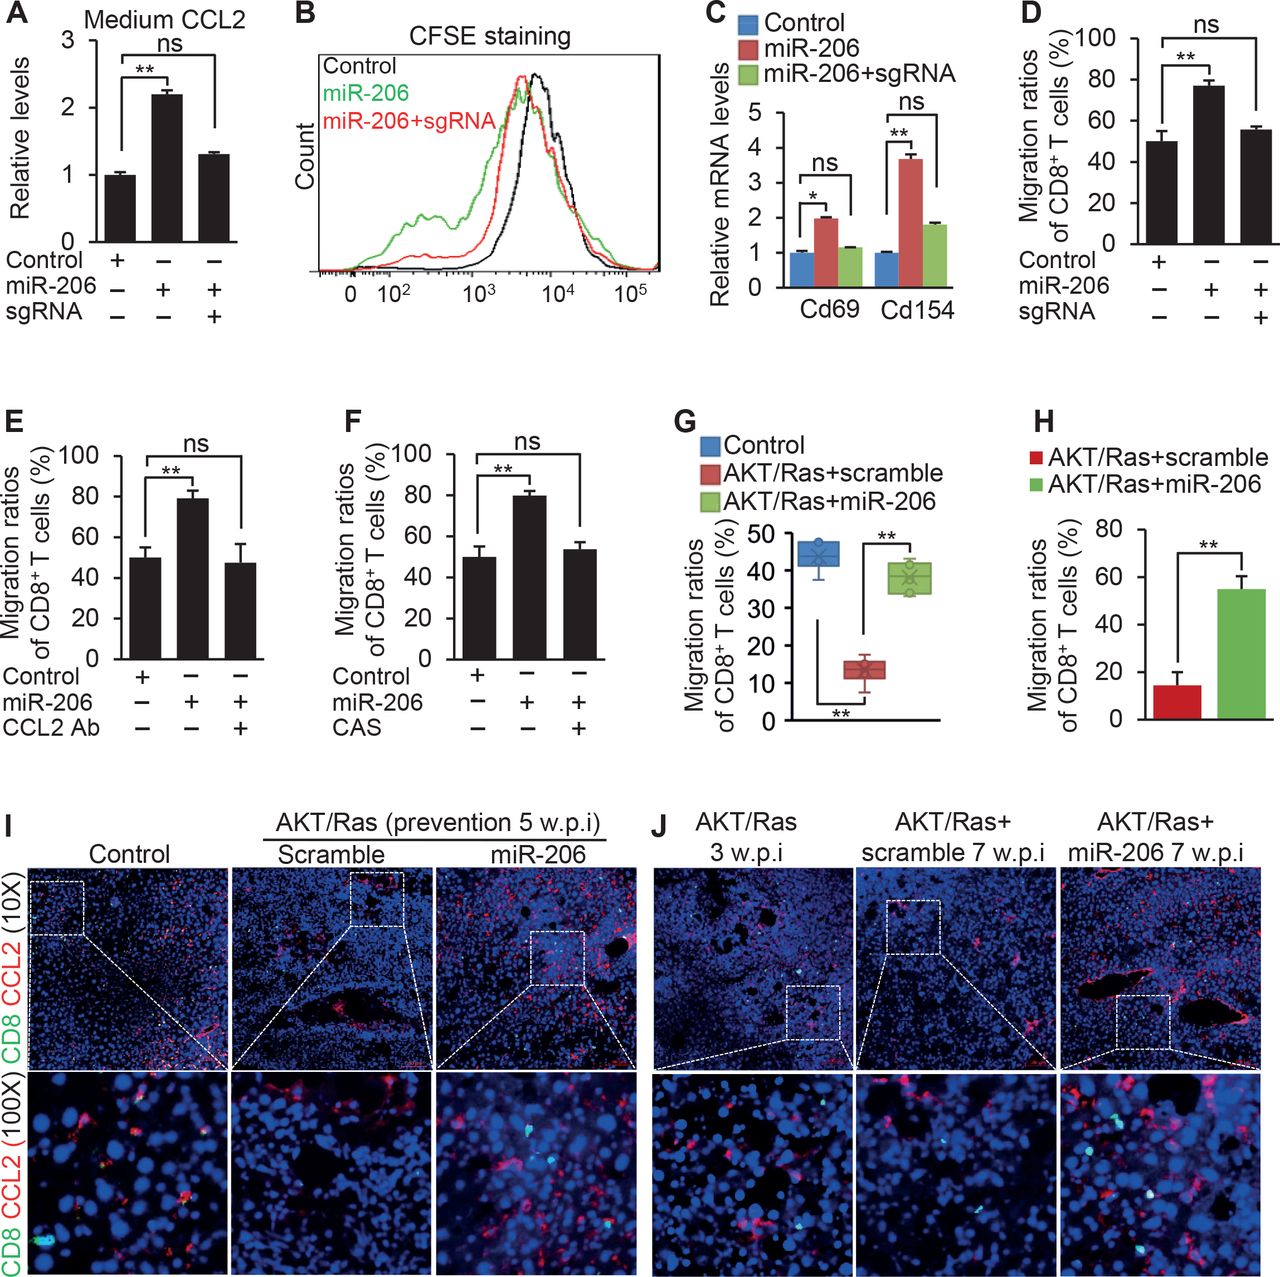
High levels of CCL2 or CCR2 were closely related to improved survival in HCC (online supplemental figure 8B,C). CCL2 is associated with recruitment of CD8+ T cells.27 28 We, therefore, hypothesised that miR-206, by promoting the CCL2/CCR2 axis, recruited CD8+ T cells. We next cocultured CD8+ T cells with miR-206-educated RAW264.7 cells. MiR-206 drove CCL2 secretion and expansion of CD8+ T cells (figure 7A,B). CD69 is an early activation marker of CD8+ T cells. CD154 allows CD8+ T cells to promote their own expansion.29 Indeed, CD8+ T cells showed high expression of Cd69 and Cd154 (figure 7C). MiR-206, by promoting CCL2 production in macrophages, enhanced migration of CD8+ T cells (figure 7D).

miR-206 enhanced chemotaxis of CD8+ T cells by activating the CCL2/CCR2 axis. (A) Levels of CCL2 in the medium of RAW264.7 cells that were transfected with pT3-CD68p-scramble (control), pT3-CD68p-miR-206 (miR-206) or a combination of pT3-CD68p-miR-206 and the sgRNA to ablate the binding site of miR-206 within the 3’UTR of Klf4 (miR-206+sgRNA). (B) Proliferation of CD8+ T cells cocultured with three groups of RAW264.7 cells. (C) mRNA levels of genes encoding CD69 and CD154 in CD8+ T cells that were cocultured with the three groups of RAW264.7 cells. (D) The migration ratios of CD8+ T cells cocultured with three groups of RAW264.7 cells. (E) The migration ratios of CD8+ T cells cocultured with three groups of RAW264.7 cells treated with pT3-CD68p-scramble (control), pT3-CD68p-miR-206 or a combination of pT3-CD68p-miR-206 and CCL2 mAb. CCL2 mAb was used to neutralise CCL2 in the culture medium. (F) The migration ratios of CD8+ T cells cocultured with three groups of RAW264.7 cells treated with pT3-CD68p-scramble (control), pT3-CD68p-miR-206 or a combination of pT3-CD68p-miR-206 and CAS, a CCR2 antagonist. (G) The migration ratios of CD8+ T cells cocultured with KCs isolated from livers of FVB/NJ mice injected with pT3-EF1α (control, n=3, 5 w.p.i.), AKT/Ras/scramble (n=3, 5 w.p.i.) or AKT/Ras/miR-206 (n=3, 5 w.p.i.). (H) The migration ratios of CD8+ T cells cocultured with KCs isolated from livers of AKT/Ras/MC-CD68p-scramble (n=3, 7 w.p.i.) and AKT/Ras/MC-CD68p-miR-206 (n=3, 7 w.p.i.). (I–J) Immunostaining of CD8 and CCL2 in livers of the AKT/Ras models of prevention and treatment. Scale bar: 100 µm. Data represent mean±SEM. *P<0.05; **p<0.01 and NS (figure 7A–G: two-way analysis of variance test. figure 7H: two-tailed Student’s t-test). NS, no significance; KCs, Kupffer cells; w.p.i., weeks postinjection of AKT/Ras.
We next determined whether each component of the KLF4-CCL2-CCR2 axis was required for miR-206 to activate M1 polarisation and subsequent expansion and migration of CD8+ T cells. Ablation of the miR-206 binding site within the 3′UTR of Klf4 impaired the ability of miR-206 to induce CCL2 secretion in RAW264.7 cells (figure 7A). This disruption also limited the ability of miR-206 to promote expansion and migration of CD8+ T cells (figure 7B–D). CCL2 neutralisation and CCR2 antagonism impaired the ability of miR-206 to drive migration of CD8+ T cells (figure 7E,F), indicating that both CCL2 and CCR2 were required for miR-206 to recruit CD8+ T cells. Ablation of the miR-206 binding site within the 3′UTR of KLF4 in the genome of THP-1 cells also impaired the ability of miR-206 to drive proliferation and migration of CD8+ T cells (online supplemental figure 13). KCs from AKT/Ras mice showed a reduced ability to drive migration of CD8+ T cells, while this loss was recovered in KCs isolated from AKT/Ras/miR-206 mice (figure 7G,H). In AKT/Ras/miR-206 mice, the appearance of CCL2 was positively correlated with CD8+ T cells (both prevention and therapeutic models) (figure 7I–J).
Supplemental material
Disrupting the interaction between miR-206 and Klf4 in part impaired the ability of miR-206 to prevent HCC
We set out to establish that the KLF4-CCL2 axis was the downstream effector for miR-206 to prevent HCC development in vivo. To do so, we employed an AAV8-based CRISPR/Cas9 technique to ablate the binding site of miR-206 within the 3′UTR of Klf4 in the genome of KCs in AKT/Ras mice. Ablation of the miR-206 binding site impaired the ability of miR-206 to repress Klf4 in KCs and promote CCL2 production (figure 8A,B). Phenotypically, disrupting the interaction between miR-206 and Klf4 was associated with recovered growth of HCC that was fully prevented by miR-206 (figure 8C). Mechanistically, HDI of miR-206 promoted the M2-to-M1 switch of KCs and hepatic recruitment of CD8+ T cells, while disrupting the interaction between miR-206 and Klf4 brought levels of M1 KCs and CD8+ T cells to those seen in scramble-treated mice (figure 8D–I). Taken together, the KLF4-CCL2 axis, at least in part, mediated the ability of miR-206 to drive M2-to-M1 polarisation of KCs and hepatic recruitment of CD8+ T cells and prevent HCC in AKT/Ras mice.

Disrupting the interaction between miR-206 and Klf4 offset the role of miR-206 in preventing HCC development. (A and B) mRNA levels of Klf4 in KCs and serum CCL2 in AKT/Ras mice injected with pT3-CD68-scramble (n=6, 8 w.p.i.), pT3-CD68-miR-206 (n=6, 8 w.p.i.) or a combination of pT3-CD68-miR-206 and the sgRNA (n=6, 8 w.p.i.). (C) Macroscopic and microscopic (H&E) appearance of livers of three groups of mice. (D–G) Ratios of M1 or M2 KCs in livers of three groups of mice. (H–I) Ratios of CTLs (CD8+GrB+) to CD8+ T cells in livers of three groups of mice. Data represent mean±SEM. **P<0.01 (figure 8: two-way analysis of variance test). HCC, hepatocellular carcinoma; KCs, Kupffer cells; w.p.i., weeks postinjection of AKT/Ras.
Depletion of CD8+ T cells eliminated the ability of miR-206 to prevent HCC development
We hypothesised that CTLs were the major downstream player for miR-206 to prevent HCC. To test this, we depleted CD8+ T cells in AKT/Ras mice by intraperitoneal injection of CD8 or IgG1 mAb (control) (figure 9A). MiR-206 inhibited expression of Klf4, which promoted CCL2 production, drove M1 polarisation of KCs and fully prevented HCC in AKT/Ras mice (figure 9B–E). In contrast, although miR-206 recovered hepatic M1 KCs (figure 9C), depletion of CD8+ T cells offset the ability of miR-206 to inhibit HCC development (figure 9E). In sum, CD8+ T cells were the downstream player of miR-206 to inhibit HCC.

Depletion of CD8+ T cells impaired the ability of miR-206 to prevent HCC. (A) Levels of CD8+ T cells in livers of AKT/Ras treated with scramble (n=6, 7 w.p.i.), miR-206 and IgG1 mAb (n=6, 7 w.p.i.), or a combination of miR-206 and CD8 mAb (n=6, 7 w.p.i.). (B) mRNA levels of Klf4 in KCs and serum CCL2 in three groups of mice. (C and D) Ratios of M1 or M2 KCs in livers of three groups of mice. (E) Macroscopic and microscopic (H&E) appearance of livers in three groups of mice. Data represent mean±SEM. **P<0.01, ***p<0.001 and NS (figure 9: two-way analysis of variance test). HCC, hepatocellular carcinoma; KCs, Kupffer cells; mAb, monoclonal antibody; NS, no significance; w.p.i., weeks postinjection of AKT/Ras.
Discussion
The efficacy of immunotherapy is limited by several unique properties of HCC, most notably the inherently tolerogenic nature of liver in both healthy and diseased states.11 In this study, we identified a typical immune nature of HCC by which M2 polarisation of KCs impaired hepatic enrichment of CD8+ T cells. In contrast, miR-206 drove M1 polarisation of KCs and hepatic recruitment of CD8+ T cells, thereby exhibiting the strong therapeutic potential against HCC.
First, we observed that activation of AKT signalling accounted for M2 polarisation of KCs in AKT/Ras mice. To date, control of macrophage polarisation has largely been attributed to the function of a small group of factors including NF-κB, AP-1, STATs and PPARs.25 Since the identification of miRNAs,30 they have been implicated in human cancers and, in particular, miR-206.17 18 31 32 With respect to miR-206, its role in inhibiting proliferation of many types of cancers has been well studied.17 31 32 However, in HCC, the efficiency of HDI-based in vivo transfection of miR-206 was only 30% of liver cells (online supplemental figure 3C). Therefore, it was unreasonable to conclude that the full prevention of HCC in AKT/Ras/miR-206 was caused by impaired proliferation of malignant hepatocytes. Immune escape of tumour cells is a typical characteristic of HCC.3 Indeed, miR-206-mediated M1 polarisation of KCs, by driving hepatic recruitment of CTLs, at least in part, contributed to the robust inhibition of HCC in AKT/Ras mice. However, it cannot rule out the possibility that miR-206 inhibited HCC by modulating other signalling cascades within the TME.
A second key observation was that miR-206 promoted migration and expansion of CD8+ T cells by driving KCs to produce CCL2. While CCL2 binds promiscuously to CCR1-5, it binds with a particularly high affinity to CCR2.33 The CCL2/CCR2 signalling is best known for its role in regulating macrophage recruitment and polarisation.23 In addition to attracting M2 macrophages, the CCL2/CCR2 axis was shown to also attract Tregs.34 It was reported that CCL2 was increased in HCC patients, and antagonising the CCL2/CCR2 axis impaired growth of HCC.35 However, our TCGA database analysis revealed that reduced CCL2 predicted a poor survival rate of HCC patients (online supplemental figure 8A,B). Notably, levels of CCL2 were also decreased in other types of human cancers in the TCGA database (figure 4C). In sarcoma and lung cancer patients, high expression of CCL2 was associated with an improved prognosis and better overall survival.36 37 The CCR2/CCL2 axis was reported to be associated with increased migration of CTLs towards cancer cells.38 Based on these findings, we speculated that during the initiation and early stage of HCC, M1 polarisation of KCs activated the CCL2/CCR2 signalling, thereby facilitating the migration of CD8+ T cells to HCC. However, in advanced HCC, levels of circulating Tregs were significantly increased and CCR2 on the surface of Tregs rapidly depleted CCL2, which reduced the chance of CCL2 to interact with CCR2 on CD8+ T cells. Therefore, miR-206, at least in part, and via the CCL2/CCR2 axis, contributes to attraction of CD8+ T cells.
Immunosuppression is a typical nature of HCC. Despite the strong role of miR-206 in driving hepatic recruitment of CTLs, it cannot rule out the inhibitory effect of miR-206 on immunosuppression based on its strong inhibitory effect on HCC. In addition, CCR2 is also expressed in Tregs, urging us to evaluate the effect of miR-206 on hepatic Tregs. Unexpectedly, decreased hepatic CD4+ T cells and elevated Tregs were observed in AKT/Ras mice, while KC-specific expression of miR-206 normalised their levels in AKT/Ras mice (both prevention and therapeutic models) (online supplemental figure 14A–F). FOXP3 itself is not enough for Tregs to exhibit suppressive function.39 IL-10 augments is required for Treg function and differentiation.40 We speculated that miR-206, by inhibiting IL-10 production, created an unfavourable environment for Treg differentiation. IL-10 is predominantly expressed in KCs versus hepatocytes (online supplemental figure 15A). KC-specific expression of miR-206 reduced both mRNA levels of Il-10 in KCs and serum IL-10 that were elevated in AKT/Ras mice (online supplemental figure 15B,C). This observation suggested that miR-206, in addition to driving CTL recruitment, also suppressed hepatic immunosuppression, which might partially contribute to the full prevention of HCC in AKT/Ras mice.
Supplemental material
Supplemental material
Cenicriviroc (CVC), a CCR2/5 antagonist, had shown promising results against NASH/fibrosis.41 We next determined the effect of CVC on HCC in AKT/Ras mice. Unexpectedly, CVC treatment slightly accelerated growth of HCC in AKT/Ras mice (online supplemental figure 16). Further studies are needed to optimise the dose of AKT/Ras and CVC to allow AKT/Ras mice to survive for a long term so that we can study the role of CVC in promoting HCC development in AKT/Ras mice. Proinflammatory KCs can suppress early HCC tumourigenesis by eliminating cancer cells and can also sustain the chronic state of inflammation. A threshold of M1 KCs and timely termination of M1 polarisation of KCs is critical to maintain their ability to inhibit HCC but avoid excessive inflammation. It is our speculation that miR-206, by fine-tuning M1/M2 balance and TME, fully prevented HCC without excessive hepatic inflammation.
Supplemental material
Finally, the full prevention of HCC by miR-206-mediated M1 polarisation of KCs underscores the role of miRNAs in maintaining immune homeostasis. They are now well established as naturally occurring non-coding RNAs that fine-tune metabolic and functional pathways.42–44 This characteristic of miRNAs allows us to speculate that they regulate immune response in a highly precise manner, which avoids excessive and off-site effects. In summary, activation of AKT/Ras signalling triggered M2 polarisation of KCs, which subsequently impaired CTLs infiltration to the cancer site. MiR-206 drove M1 polarisation of KCs and CCL2 production. Activation of CCL2/CCR2 signalling facilitated hepatic recruitment of CD8+ T cells and fully prevented HCC. Based on the unique nature of miR-206 to enhance immune surveillance, it represents a potentially novel immunotherapeutic agent against HCC.
Data availability statement
All data relevant to the study are included in the article or uploaded as supplementary information.
Ethics statements
Patient consent for publication
Ethics approval
Institutional Animal Care and Use Committee of the University of Minnesota Animal protocol ID: 1811-36499A.
References
Supplementary materials
Supplementary Data
This web only file has been produced by the BMJ Publishing Group from an electronic file supplied by the author(s) and has not been edited for content.
- Data supplement 1
- Data supplement 2
- Data supplement 3
- Data supplement 4
- Data supplement 5
- Data supplement 6
- Data supplement 7
- Data supplement 8
- Data supplement 9
- Data supplement 10
- Data supplement 11
- Data supplement 12
- Data supplement 13
- Data supplement 14
- Data supplement 15
- Data supplement 16
- Data supplement 17
- Data supplement 18
- Data supplement 19
- Data supplement 20
- Data supplement 21
Footnotes
Contributors NL contributed to data curation, analyses, investigation, methodology and interpretation of data and wrote the original draft. XW contributed to the approach to the study and data collection. CJS contributed to supporting methodology and the reviewing and editing of the original draft. GS initiated and coordinated the study, acquired the funding, edited the manuscript and submitted the manuscript.
Funding This work was supported, in part, by Research Scholar Grant (ISG-16-210-01-RMC) from the American Cancer Society to GS.
Competing interests None declared.
Provenance and peer review Not commissioned; externally peer reviewed.
Supplemental material This content has been supplied by the author(s). It has not been vetted by BMJ Publishing Group Limited (BMJ) and may not have been peer-reviewed. Any opinions or recommendations discussed are solely those of the author(s) and are not endorsed by BMJ. BMJ disclaims all liability and responsibility arising from any reliance placed on the content. Where the content includes any translated material, BMJ does not warrant the accuracy and reliability of the translations (including but not limited to local regulations, clinical guidelines, terminology, drug names and drug dosages), and is not responsible for any error and/or omissions arising from translation and adaptation or otherwise.