Article Text

Abstract
Objectives To examine the prognostic potential of repeated faecal haemoglobin (F-Hb) concentration measurements in faecal immunochemical test (FIT)-based screening for colorectal cancer (CRC).
Design Prognostic model.
Setting Dutch biennial FIT-based screening programme during 2014–2018.
Participants 265 881 participants completing three rounds of FIT, with negative test results (F-Hb <47 µg Hb/g faeces) in rounds 1 and 2.
Interventions Colonoscopy follow-up in participants with a positive FIT (F-Hb ≥47 µg Hb/g faeces).
Main outcomes We evaluated prognostic models for detecting advanced neoplasia (AN) and CRC in round 3, with as predictors, participant age, sex, F-Hb in rounds 1 and 2, and categories/combinations/non-linear transformations of F-Hb. Primary evaluation criteria included: risk prediction accuracy (calibration), discrimination of participants with versus without AN or CRC (optimism-adjusted C-statistics, range 0.5–1.0), the degree of risk stratification and C-statistics in external validation.
Results Among study participants, 8806 (3.3%) had a positive FIT result, 3254 (1.2%) had AN detected and 557 (0.2%) had cancer. F-Hb concentrations in rounds 1 and 2 were the strongest outcome predictors, with adjusted ORs of up to 9.4 (95% CI 7.5 to 11.7) for the highest F-Hb category. Risk predictions matched the observed risk for most participants (calibration intercept −0.008 to −0.099; slope 0.982–0.998), and discriminated participants with versus without AN or CRC with C-statistics of 0.78 (95% CI 0.77 to 0.79) and 0.73 (95% CI 0.71 to 0.75), respectively. The predicted risk ranged from 0.4% to 36.7% for AN and from 0.0% to 5.5% for CRC across participants. In external validation, the model retained similar discrimination accuracy for AN (C-statistic 0.77, 95% CI 0.66 to 0.87) and CRC (C-statistic 0.78, 95% CI 0.66 to 0.91).
Conclusion Participants at lower versus higher risk of future AN or CRC can be accurately identified based on their age, sex and particularly, prior F-Hb concentrations. Risk stratification should be considered based on this information.
- colorectal neoplasm
- screening
- stool markers
Data availability statement
Data may be obtained from a third party and are not publicly available. Data for this study cannot be made publicly available, but access can be requested via the Bevolkingsonderzoek Nederlands (BVO-NL). Analysis scripts can be shared by the authors on request.
This is an open access article distributed in accordance with the Creative Commons Attribution Non Commercial (CC BY-NC 4.0) license, which permits others to distribute, remix, adapt, build upon this work non-commercially, and license their derivative works on different terms, provided the original work is properly cited, appropriate credit is given, any changes made indicated, and the use is non-commercial. See: http://creativecommons.org/licenses/by-nc/4.0/.
Statistics from Altmetric.com
Significance of this study
What is already known on this subject?
Two prior studies found strong associations between negative faecal haemoglobin (F-Hb) concentrations in faecal immunochemical testing (FIT) and subsequent colorectal cancer (CRC). However, no studies formally evaluated the performance and clinical utility of prognostic models including the results from multiple negative FITs.
What are the new findings?
We evaluated prognostic models for advanced neoplasia (AN) and CRC based on participants’ age, sex and F-Hb concentrations from two successive biennial FIT rounds. As we demonstrated, the models accurately predict risk of subsequent AN and CRC, discriminate those outcomes with a high degree of concordance and allow for clinically meaningful risk stratification.
How might it impact on clinical practice in the foreseeable future?
Risk-stratified FIT screening should be considered based on this information.
Introduction
The immunochemical faecal occult blood test, or simply faecal immunochemical test (FIT) for faecal haemoglobin (F-Hb), is a recommended screening test for colorectal cancer (CRC).1 The F-Hb concentration in stool samples is an established diagnostic marker for CRC.2 Most FIT-based screening programmes invite eligible individuals every 1 or 2 years and use the test qualitatively: only individuals with F-Hb concentrations above a predefined cut-off are referred for a follow-up colonoscopy.3
Over the last decade, several studies using quantitative FITs challenged this one-size-fits-all approach.4–6 These studies reported dose–response relationships between measured F-Hb concentrations below the positivity cut-off and detection of advanced colorectal neoplasia in subsequent years. In theory, screening programmes using quantitative FITs may be improved by personalised intervals and cut-offs based on prior F-Hb concentrations.7 However, the success of such approaches depends on how well those past results predict future outcomes. Misclassification of individuals at lower vs higher risk of advanced lesions could render personalised screening ineffective.8
The performance of prediction models is often evaluated in terms of how accurately they estimate risk (calibration), and to what degree they discriminate individuals with versus without relevant outcomes (discrimination). However, the prognostic performance of risk prediction models using prior F-Hb concentrations is unknown. To inform clinicians and policy makers, we evaluated the performance and potential for clinical utility of such models in a population-based context, using information from two biennial FIT rounds to predict screening outcomes in a third round.
Methods
Screening program
This study was conducted within the Dutch CRC screening programme. The programme was rolled out from 2014 through 2019 and was described in detail elsewhere.9 In brief, adults in the age range of 55–75 years receive an FIT by mail (FOB-Gold; Sentinel Diagnostic, Milan, Italy). Participants with a negative result, that is, F-Hb concentration of <47 µg haemoglobin per gram faeces (µg/g), are reinvited after 2 years. Participants with a positive FIT result (≥47 µg/g) are referred for a colonoscopy intake. Those considered eligible (see Primary study population section) receive an invitation to undergo a follow-up colonoscopy at one of the participating endoscopy centres. During colonoscopy, polyps are removed and diagnostic biopsies are taken for cancers not amenable to endoscopic excision. Relevant findings in the programme are defined as advanced adenomas (size ≥10 mm and/or villous histology ≥25% and/or high-grade dysplasia) and CRC. Participants with lesions detected at colonoscopy may undergo further treatment or surveillance according to Dutch guidelines; participants without relevant lesions are reinvited to FIT screening in 10 years.
Process and outcome quality assurance
In the current programme, returned FIT kits are evaluated by one of four FIT laboratories. Participants whose sample is not reliable are mailed a new FIT kit. Participants generally receive the result letter within 7 days. Participants with a positive result generally undergo follow-up colonoscopy intake at one of the endoscopy centres within 15 days. Quality of colonoscopy is assured through certified endoscopists, and potential re-examination in case of inadequate bowel preparation.10 Lesions detected and removed at colonoscopy are referred for review by a pathologist trained to distinguish relevant CRC precursors. All FIT laboratories, endoscopy centres and pathology laboratories are accredited, and audited annually for objective quality criteria. Relevant programme performance data are tracked in ScreenIT, a central IT warehouse which stores invitation dates, FIT results, follow-up colonoscopy appointments, and colonoscopy and pathology findings.
Primary study population
For this study, we included individuals who participated in three successive rounds of screening from 1 January 2014 through 31 December 2018 (invitation dates), with a negative FIT in both the first and second rounds, and a negative or positive FIT in the third round. We excluded participants with a positive FIT in the third round in whom no complete follow-up colonoscopy was performed. By design of the national screening programme, no age-eligible individuals were excluded from the screening programme and study a priori. However, individuals with a recent colonoscopy, frailty or high CRC risk (eg, those with inflammatory bowel disease, a family or personal history of CRC) were advised in the information letter to discuss screening participation with their primary care physician and were generally excluded for follow-up colonoscopy.
Data
Primary data for this study were retrieved from ScreenIT. Data on interval CRCs after negative FITs (used for a sensitivity analysis) were retrieved from the Netherlands Cancer Registry. The primary study outcomes for prediction were detection of advanced neoplasia (AN) or CRC in the third round of FIT screening. AN is a composite outcome consisting of advanced adenoma and/or CRC. Of these cases, 93.7% were histologically confirmed; others had missing pathology reports and were classified AN after endoscopist review. Considered predictors included the participants’ age, sex and measured F-Hb concentrations in rounds 1 and 2, in µg/g.
Analysis
Statistical associations between predictions and outcomes were expressed as ORs and tested for significance using Pearson’s χ2 test for crude (unadjusted) ORs and Student’s t-tests for multivariate-adjusted ORs (ie, those from the risk prediction models). In general, statistical associations and differences were considered significant below a 5% probability threshold.
Multivariate logistic regression was used to predict outcomes of the third round of FIT screening. For the main predictor (F-Hb concentration), we also considered log-transformed, squared, combined (summed), discrete terms (categories of 0, 0.1–2.5, 2.6–9.9, 10–19.9, …, 40–46.9 µg/g), and interactions with age and sex, to allow for non-linear relationships. The category 0.1–2.5 µg/g was included (combined with either 0 or 2.6–9.9) to examine whether concentrations below 2.6 µg/g (limit of detection) are predictive, despite a probability of >5% of misclassification of those concentrations as 0 µg/g.11 The choice between different possible model specifications was made independently for AN and CRC as the primary outcome and was based on (1) statistical model specification tests, (2) the prognostic performance of the model and (3) the clinical face validity. More details on the model selection procedure are in the online supplemental appendix.
Supplemental material
The overall model specifications were statistically compared using the likelihood ratio test for nested models and the Cox test for non-nested models.12
The prognostic performance was evaluated in terms of model calibration and discrimination criteria.13 Model calibration was evaluated graphically using calibration plots, which show the agreement of predicted versus observed risks for 100 population subgroups rank ordered by risk score (percentiles). Discrimination was measured by the area under the receiver operating curve or concordance statistic (C-statistic). The value of the C-statistic can range from 0.5 to 1, where 0.5 represents a model discriminating no better than chance and 1 represents perfect discrimination of individuals with versus without relevant outcomes. A C-statistic >0.75 was considered to have good discriminative ability. To investigate the relative value of different predictors, we compared C-statistics from the full model with simpler models including just age, sex and the (non-linear transformations of the) first or second F-Hb concentration. The models were internally validated using bootstrap with r=500 samples, to correct for optimism.14 15 CIs were also derived using bootstrap (r=500).
The clinical face validity of model predictions was assessed by examining the distribution of absolute risk predictions by age, sex and F-Hb concentration, using a risk score matrix. Predictions were considered valid when demonstrating known positive associations with age, male sex and F-Hb.
As a first step toward assessing clinical utility, we examined the degree of risk stratification facilitated by the prediction models. We plotted, for each risk score percentile, the observed relative rate of AN or CRC detection compared with the overall study population. Additionally, we used decision curve analysis to define the range of predicted risk with potential for utility from risk-stratified screening.16
Sensitivity analysis
Some screening programme participants present clinically with CRC despite a negative FIT.17 While our primary aim was to predict outcomes detected in screening, we performed a sensitivity analysis including these interval CRC cases (with differential follow-up). Interval CRCs before the third round were defined as cases diagnosed ≤24 months from the second FIT invitation and before the third invitation in participants otherwise meeting study inclusion criteria; those after the third round were to be diagnosed ≤24 months from the third FIT evaluation date (median follow-up of 190 days). We reassessed model discrimination. We also compared the risk scores of these cases with controls and screen-detected CRC cases using boxplots and pairwise Wilcoxon tests, and compared the risk scores for all patients with CRC by anatomic subsite and stage of diagnosis. Proximal location was defined as any CRC proximal to the splenic flexure, and early stage was defined as stages I–II.
External validation
We externally validated model predictions for AN and CRC by reassessing the prognostic performance and risk stratification in an independent cohort. Data were obtained from a biennial FIT screening pilot study conducted in the Netherlands during June 2006 through February 2012, as described elsewhere previously.18 We included individuals participating in at least the third round of the pilot. We excluded individuals with a positive result in the preceding rounds or with a positive result in the third round and no complete follow-up colonoscopy. To increase power for the analyses, missing FIT results in the first two rounds were permitted and imputed using multiple imputation. The pilot used a different FIT brand and default cut-off (OC-Sensor; Eiken Chemical, Tokyo, Japan; cut-off ≥10 µg/g). Therefore, we validated a model with continuous F-Hb concentrations as predictors rather than incompatible F-Hb categories (Specification 8; online supplemental table 1). For the validation, we increased the cut-off to ≥47 µg/g in the third round similar to the primary analysis, by treating everyone with a lower F-Hb concentration as negative for AN.
Software
All analyses were performed using R Statistical software V.4.0.3.
Institutional board review
The study was exempt from institutional board review. The permit for the national screening programme is incorporated in the Population Screening Act. Screening programme participants have the option to object to their data sharing, in which case they were excluded from the study.
Role of the funding source
The funder had no role in the study design, collection, analysis and interpretation of the data, or writing. The funder reviewed and approved the report prior to publication.
Results
Study population
There were 299 315 participants in the third round of the Dutch FIT-based screening programme by 2018 (figure 1). After exclusion of participants with missing (n=31 733) or positive prior FITs (n=75) by the third round, and no complete follow-up colonoscopy or missing findings from the participant records (n=1626) after a positive FIT in the third round, a total of 265 881 participants were included in the analysis. Among the included participants, 8806 had a positive FIT in the third round (3.3%), 2697 (1.2%) had histology-confirmed advanced adenoma at follow-up colonoscopy and 557 (0.2%) had CRC.

Study flow diagram and outcomes. FIT, faecal immunochemical test; FU, follow-up.
The cohort consisted of 138 860 (52.2%) women and 127 021 men (47.8%), with a mean age of 69.0 years (SD±1.9 years) (table 1). The measured F-Hb concentration was 0 µg/g in 77.8% of participants in the first round (prevalence round) and in 91.1% in the second round. F-Hb concentrations in the first or second round close to the cut-off were relatively rare (table 1).
Study population characteristics and outcomes
Statistical associations
The F-Hb concentrations were strongly associated with outcomes (table 1), with unadjusted ORs of up to 21.8 (95% CI 17.6 to 27.0) for the highest F-Hb category (40–46.9 µg/g) compared with 0 µg/g. Concentrations below the limit of detection (<2.6 µg/g) were associated with ORs of up to 5.0 (95% CI 3.6 to 7.0), despite potential conflation with 0 µg/g. Age and sex were more weakly associated with outcomes (table 1), with ORs between 0.9 and 2.3.
Model specification
Of the models evaluated for prediction of detected AN and CRC in the third round, multiple specifications demonstrated similar goodness-of-fit and discriminatory performance (online supplemental appendix). A model including age, sex and discrete F-Hb categories performed best in terms of all criteria, and only the results from this model are reported below (Specification 3; online supplemental table 1).
In this final model (table 2), male sex and different F-Hb categories were all statistically significant predictors. Age was a statistically significant predictor only for CRC. For the F-Hb concentrations measured in the first round, multivariate-adjusted ORs for AN varied from 2.8 (95% CI 2.6 to 3.1) to 9.4 (95% CI 7.5% to 11.7%) across F-Hb categories of 0.1–9.9 µg/g to 40.0–46.9 µg/g. ORs for CRC varied from 2.5 (95% CI 2.0 to 3.2) to 6.3 (95% CI 3.5 to 11.1). Similarly, for the F-Hb concentrations measured in the second round, multivariate-adjusted ORs for AN increased from 4.8 (95% CI 4.3 to 5.3) to 8.6 (95% CI 7.0 to 10.5) across concentration categories, and ORs for CRC increased from 3.0 (95% CI 2.2 to 4.0) to 4.9 (95% CI 2.8 to 8.4).
Prediction model coefficients*
Prognostic performance
The final model calibrated well for the detection of AN and CRC (online supplemental figure 1). Predicted detection rates were comparable with observed rates for most of the risk score percentiles (calibration intercept –0.008 to –0.099, slope 0.982–0.998).
The model also discriminated well between participants with and without relevant outcomes. The optimism-corrected C-statistics were 0.78 (95% CI 0.77 to 0.79) for AN and 0.73 (95% CI 0.71 to 0.75) for CRC (figure 2). Assuming a risk threshold for earlier screening or colonoscopy equal to the average detection rate of AN (≥1.2%), 64.6% of participants with AN could be detected earlier by inviting just 18.8% of other participants earlier. Conversely, 82.2% of other participants could be screened less intensively. Analogously for CRC, with an average-risk threshold (≥0.2%), 62.5% of cases could be identified earlier by inviting just 23.5% of other participants earlier.

Receiver operating characteristic curves for predicted faecal immunochemical test (FIT) screening outcomes. Optimism-corrected C-statistics for the full model were 0.78 (95% CI 0.77 to 0.79) for advanced neoplasia and 0.73 (95% CI 0.71 to 0.75) for colorectal cancer (CRC). Marked points on the curves highlight the sensitivities and specificities for a dichotomous transformation (positive/negative scores), with a threshold of 1.2% for AN and 0.2% for CRC (relative risk=1; figure 4). A=age; S=sex; F1=first faecal haemoglobin (F-Hb) measurement (categorical); F2=second F-Hb measurement (categorical).
In contrast to the full model, models including just age, sex and the first-round or second-round F-Hb concentration resulted in lower C-statistics of 0.72 (95% CI 0.71 to 0.73) for AN and 0.67 (95% CIs 0.65 to 0.70 and 0.64 to 0.69) for CRC. Models including only age and sex resulted in even lower C-statistics, whereas models excluding age and sex but including both measured F-Hb concentrations had C-statistics close to the full model (Specification 12; online supplemental appendix).
Clinical face validity
As expected from the prediction model coefficients (table 2), the risk score chart demonstrates a higher risk of AN with increasing age, for men versus women, and with higher F-Hb concentrations in the first and second screening rounds (figure 3). Most participants (73.5%) had zero F-Hb concentrations in both rounds, which was associated with low predicted AN risk of 0.4%–0.6%, irrespective of age and sex. Whereas the predicted risk remained <6% for participants with one non-zero F-Hb concentration (20.0%), the risk rapidly increased for participants with two non-zero concentrations (4.5%), up to 36.7% for men aged 75 years with two prior F-Hb concentrations ≥40 µg/g. The predicted risk of CRC was also higher for older ages and men, but more variable across F-Hb categories, and ranged from 0.0% to 5.5% (online supplemental figure 2).
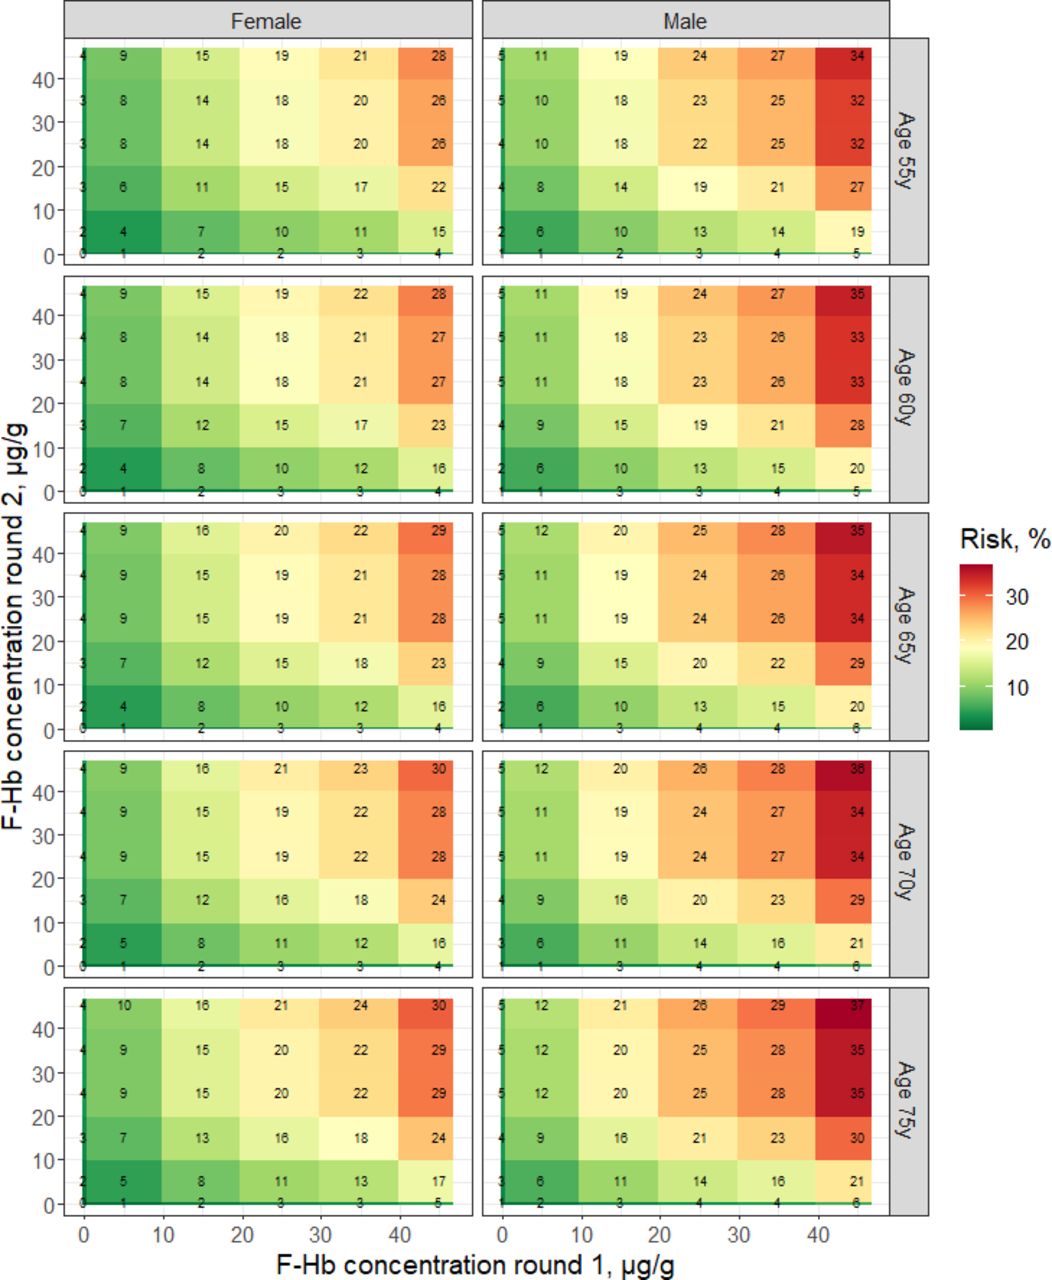
Risk score chart for future detection of advanced neoplasia. Tile sizes in this figure reflect defined faecal-haemoglobin (F-Hb) level categories in the prediction model, and not the prevalence of those values. The majority of participants are in the origin of the plot, with two consecutive measurements of 0 μg Hb/g faeces.
Potential for clinical utility
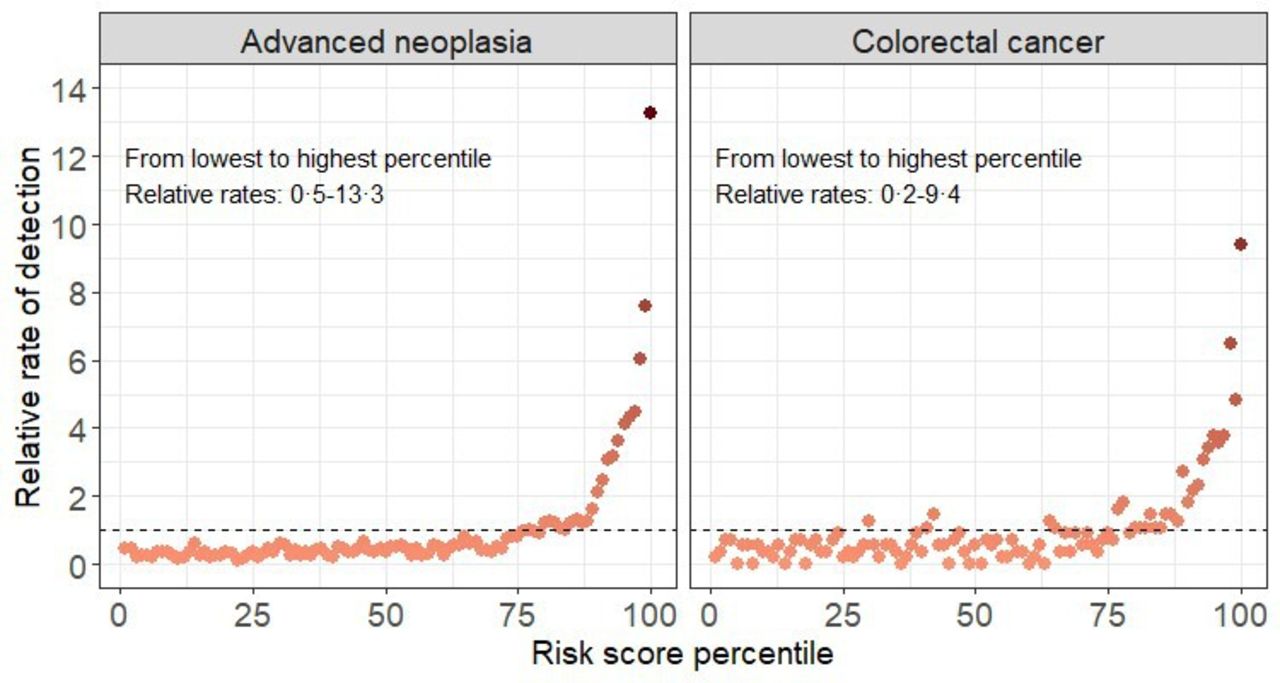
Relative rates of AN and CRC detection were similar and below average for most participants (figure 4). From lowest to highest risk score percentile, the observed relative rate ranged from 0.5 to 13.3 for AN and from 0.2 to 9.4 for CRC. Decision curve analysis supported the potential clinical utility from risk-stratified screening for risk thresholds in the range of 0.6%–20.6% for AN and 0.1%–2.0% for CRC (online supplemental figure 3). In this framework, these thresholds imply accepting trade-offs of one true positive for AN for every ≥4.9 participants invited or examined earlier and one true-positive for CRC per ≥50.0 earlier invitees.
Observed relative outcome risk by predicted risk score percentile. The x-axis plots 100 population subgroups rank ordered by risk score (percentiles). The y-axis plots their observed outcomes relative to the total study population in the third round of the faecal immunochemical test-based screening program.
Sensitivity analysis
In the screening population, 222 participants had interval CRCs diagnosed before the third round, and 34 participants had interval CRCs after the third round (online supplemental figure 4). Inclusion of these cases did not affect the model discrimination (unchanged C-statistics). Risk scores were not significantly different for interval CRCs before the third round and screen-detected CRCs in the third round (p=0.15), but they were significantly lower for interval CRCs detected after the third round (p<0.001) (online supplemental figure 5). Risk scores were also significantly lower for proximal CRCs than for distal CRCs (p<0.001), but did not differ significantly for early-stage versus late-stage CRCs (p=0.90) (online supplemental figure 6).
External validity
In external validation, there were 11 903 pilot programme participants included, of which 90 had AN and 24 had CRC (online supplemental table 2). Despite test differences, the models calibrated reasonably well for CRC (online supplemental figure 7) and retained C-statistics of 0.77 (95% CI 0.66 to 0.87) for AN and 0.78 (95% CI 0.66 to 0.91) for CRC. Risk stratification was qualitatively similar as the primary analysis, with four risk score quintiles having an average or below-average risk, and the upper quintile having a threefold increased rate of AN (3.1 95% CI 2.4 to 4.0)) and CRC (3.1 (95% CI 1.8 to 5.1)) (online supplemental figure 8). Risk scores in these upper quintiles were ≥1.9% for AN and ≥0.3% for CRC.
Discussion
In this study, we demonstrated that prognostic models incorporating age, sex, and particularly, results from two prior negative FITs, can accurately identify individuals at lower versus higher risk of future AN or CRC. Predicted risk closely matched observed risk, and discriminated participants with versus without AN or CRC with a moderate-to-high degree of concordance (C-statistics up to 0.78). Observed risk of AN and CRC also meaningfully increased with predicted risk. The models demonstrated external validity despite differences in screening organisation for the primary and validation cohort.
Our study has some limitations. First, sensitivity analysis revealed that prior negative FIT results may be less predictive for CRCs missed during the next FIT round, that is, the interval CRCs occurring after the third round in our study (online supplemental figure 5). Those cases may be predictable by the time of the third round, when additional F-Hb information is acquired. Thus, our models need to be further developed and validated in future years. Second, the prognostic potential of prior F-Hb concentrations has to be further established in programmes with annual screening, different FIT brands and cut-offs.3 19 While our model demonstrated good external validity, the performance may be influenced by the cut-off in our study. In some settings, such as the UK, standard cut-offs are higher than 47 µg/g, whereas in others, such as the USA, cut-offs are lower. The fact that even small concentrations were predictive is reassuring of a sustained prognostic value irrespective of cut-off. Although we found high ORs for concentrations between 0 µg/g and the limit of detection, test manufacturers do not vouch for the reliability of such measurements. Thus, this finding should be interpreted with caution and examined further in future analyses. Study strengths include the large size of study population, our extensive model validation and the consistent findings across settings on the longitudinal F-Hb outcome association, which all provide confidence in the robustness of prior F-Hb concentrations for the prediction of future CRC outcomes.
The development and evaluation of prognostic models is an important step toward personalised screening based on more than one risk factor.13 Several studies associated prior F-Hb concentrations with future CRC outcomes.4–6 20–22 To our knowledge, few other studies formally evaluated CRC risk prediction models in a population-based context; fewer evaluated prediction accuracy (calibration); only one study assessed the discriminatory performance of F-Hb, combining outcomes after positive and negative FITs23; and no studies evaluated F-Hb as a purely prognostic marker after multiple negative FITs. Previous studies evaluating existing models using participant demographics, physical, behavioural and genetic risk factors reported C-statistics for CRC in the range of 0.60–0.70.24–27 In comparison, the values we found by including F-Hb were higher, despite correction for overfitting. This underscores the potential value of F-Hb as a prognostic marker.
The relatively good model discrimination can be explained by individuals with AN having moderate faecal occult blood loss for longer periods of time. Apparently, many AN bleed at levels below FIT positivity for at least 2–4 years before being detected through a positive FIT result. In our analysis, both the first and second F-Hb measurements were independent predictors of AN. While the risk increased with higher F-Hb concentrations, even concentrations between 0 and 2.6 µg/g, below the limit of detection of 2.6 µg/g,11 were predictive. Conversely, participants with consecutive 0 µg/g concentrations had a lower risk of AN. Thus, the likelihood of AN is strongly associated with the propensity and consistency to bleed.
During the time window that AN are present but not detected, some lesions may progress to a more advanced and less treatable stage. While earlier detection of those lesions by a lower FIT cut-off for all may unacceptably increase false-positive results, our findings suggest that repeated F-Hb measurements can help signal out those participants most likely to present with AN or CRC in the future. Thus, the accumulated information can help inform who, despite consecutive negative FIT results, may benefit from colonoscopy, or shorter screening intervals. Conversely, screening deintensification might be considered for lower-risk participants.
There are many possibilities for tailoring FIT-based screening to a participant’s risk, all of which result in different trade-offs of long-term health outcomes, burden, cost and required resources. The evaluation of long-term outcomes of risk-stratified screening was beyond the present study. Our study did reveal that most participants had an average or below-average risk and that only 15%–25% of participants were at increased risk of having AN or CRC detected in the near future. As a result, adopting an average-risk threshold for earlier rescreening or colonoscopy could earlier identify >60% of participants with AN or CRC, while burdening relatively few participants overall. Decision-analytic modelling can help elucidate whether screening intensity should be reduced for the majority of participants and increased for those at increased risk or whether a different breakdown is better.28 A favourable harms–benefits ratio also needs to be further demonstrated through clinical trials. Meanwhile, prior modelling studies8 and decision curve analysis (online supplemental figure 3) support the potential clinical utility of risk-stratified screening based on these predictions, particularly for relatively ‘sensitive’ strategies. The suggested trade-off of accepting one true positive for AN for every five or more participants invited earlier seems acceptable considering the high CRC burden, enhancing the potential for clinical impact.
Application of risk-based FIT screening and follow-up could be particularly valuable in settings or situations with limited screening capacity. For example, during new pandemic waves, screening invitations or colonoscopy follow-up could be prioritised to participants with high successive F-Hb concentrations, to optimise yield and medical resource needs. For such application to be possible, however, developed models should account for missing information and/or variable screening interval length due to intermittent screening. Further, the digital infrastructure is needed to automatically update risk estimates and adapt programme invitations. While this may exist in some organised programmes, this will not be immediately implementable everywhere. In some settings, simpler invitation algorithms could be considered that, for example, use only the last-measured F-Hb concentration. Finally, attention is also needed for the public acceptability of risk-based screening, and the question how to organise monitoring and evaluation. In the Netherlands, a pilot study addressing some of these issues is in preparation.
To conclude, this study establishes F-Hb concentrations measured during FIT screening as a valuable prognostic marker for future screening outcomes. Organised screening programmes should consider how to capitalise on this by more efficiently allocating limited resources across participants according to their FIT history. Future modelling studies and randomised trials should evaluate the potential improvements in burden, benefits and costs from such more personalised FIT screening approaches.
Data availability statement
Data may be obtained from a third party and are not publicly available. Data for this study cannot be made publicly available, but access can be requested via the Bevolkingsonderzoek Nederlands (BVO-NL). Analysis scripts can be shared by the authors on request.
Ethics statements
Patient consent for publication
Ethics approval
This study involves human participants, but the study was exempt from institutional board review. The permit for the national screening program is incorporated in the Population Screening Act. Screening program participants have the option to object to their data sharing, in which case they were excluded from the study. Participants gave informed consent to participate in the study before taking part.
Acknowledgments
We acknowledge Mirjam Harmsen, Iris Seriese and Arjan Lock for helpful feedback on our analyses. We also acknowledge Dr Thomas Imperiale for helpful feedback on an early manuscript draft.
References
Supplementary materials
Supplementary Data
This web only file has been produced by the BMJ Publishing Group from an electronic file supplied by the author(s) and has not been edited for content.
Footnotes
Contributors Authors fulfill ICMJE criteria for authorship. RGSM contributed to the design, data analysis, data interpretation, drafting and revision of the manuscript for important intellectual content. HSV and DN contributed to the data analysis, and revision of the manuscript. ETZ, AIK, ECHB, LJ, CR, MCWS, FJK, and ED contributed to the data interpretation and revision of the manuscript. MEL and ILV contributed to the conception of the work, data interpretation, and revision of the manuscript. RGSM acceps full responsibility for the work, had access to the data, and controlled the decision to publish.
Competing interests None declared.
Patient and public involvement Patients and/or the public were not involved in the design, conduct, reporting or dissemination plans of this research.
Provenance and peer review Not commissioned; externally peer reviewed.
Supplemental material This content has been supplied by the author(s). It has not been vetted by BMJ Publishing Group Limited (BMJ) and may not have been peer-reviewed. Any opinions or recommendations discussed are solely those of the author(s) and are not endorsed by BMJ. BMJ disclaims all liability and responsibility arising from any reliance placed on the content. Where the content includes any translated material, BMJ does not warrant the accuracy and reliability of the translations (including but not limited to local regulations, clinical guidelines, terminology, drug names and drug dosages), and is not responsible for any error and/or omissions arising from translation and adaptation or otherwise.