Article Text

Abstract
Objective The success of personalised therapy depends on identification and inhibition of the oncogene(s) on which that tumour is dependent. We aimed to determine whether a receptor tyrosine kinase (RTK) array could be used to select the most effective therapeutic strategies in molecularly heterogeneous oesophago-gastric adenocarcinomas.
Design Gene expression profiling from oesophago-gastric tumours (n=75) and preinvasive stages (n=57) identified the active signalling pathways, which was confirmed using immunohistochemistry (n=434). RTK arrays on a cell line panel (n=14) determined therapeutic targets for in vitro cytotoxic testing. Feasibility of this personalised approach was tested in tumour samples (n=46).
Results MAPK was the most frequently activated pathway (32/75 samples (42.7%)) with progressive enrichment in preinvasive disease stages (p<0.05) and ERK phosphorylation in 148/434 (34.3%) independent samples. Cell lines displayed a range of RTK activation profiles. When no RTKs were activated, tyrosine kinase inhibitors (TKIs) and a Mek inhibitor were not useful (MKN1). In lines with a dominant phosphorylated RTK (OE19, MKN45 and KATOIII), selection of this TKI or Mek in nM concentrations induced cytotoxicity and inhibited Erk and Akt phosphorylation. In cells lines with complex activation profiles (HSC39 and OE33), a combination of TKIs or Mek inhibition (in nM concentrations) was necessary for cytotoxicity and inhibition of Erk and Akt phosphorylation. Human tumours demonstrated diverse activation profiles and 65% of cases had two or more active RTKs.
Conclusions The MAPK pathway is commonly activated in oesophago-gastric cancer following activation of a variety of RTKs. Molecular phenotyping can inform a rational choice of targeted therapy.
- Oesophageal adenocarcinoma
- oncogene addiction
- small molecular inhibitors
- receptor tyrosine kinases
- MAPK pathways
- oesophageal cancer
- cell signalling
- Barrett's oesophagus
- biostatistics
- cancer genetics
- adenocarcinoma
- gastro-oesophageal reflux disease
Statistics from Altmetric.com
- Oesophageal adenocarcinoma
- oncogene addiction
- small molecular inhibitors
- receptor tyrosine kinases
- MAPK pathways
- oesophageal cancer
- cell signalling
- Barrett's oesophagus
- biostatistics
- cancer genetics
- adenocarcinoma
- gastro-oesophageal reflux disease
Significance of this study
What is already known on this subject?
-
▸ Molecularly targeted therapies are improving outcomes in some cancers.
-
▸ For most cancer types, only a small proportion of patients will benefit from any given antibody or small molecular inhibitor.
-
▸ Selection of the appropriate drug for an individual patient is challenging given the molecularly heterogeneous nature of many epithelial cancers.
-
▸ Oesophago-gastric adenocarcinomas have poor outcomes and the application of molecularly targeted therapy lags behind that of other cancers.
What are the new findings?
-
▸ The MAPK pathways is frequently activated in oesophago-gastric adenocarcinoma and constitutively active receptor tyrosine kinases (RTKs) can be identified on a per patient basis using RTK arrays.
-
▸ Application of specific targeted therapy(s) based on individualised RTK profiling is effective in vitro.
-
▸ Targeting the downstream inhibitor Mek for cases with MAPK activation may be an alternative strategy to targeting the RTK in this disease.
How might it impact on clinical practice in the foreseeable future?
-
▸ For molecularly heterogeneous cancers, target selection could be individualised using applications such as receptor tyrosine kinase (RTK) arrays.
-
▸ In oesophago-gastric cancers, RTK and MAPK pathway inhibitors warrant further investigation.
-
▸ Innovative clinical trial designs in which one of a panel of drugs can be selected depending on the individual molecular phenotype are needed to advance the concept of personalised medicine.
Introduction
Oesophageal and gastric cancers, combined, are the leading causes of cancer worldwide, with over 1 390 000 diagnoses per annum.1 By 2030, gastric cancer is predicted to be the 10th leading cause of global mortality.2 In the Westernised world, the incidence of oesophageal carcinoma has increased over fivefold in 30 years.3 ,4 The late presentation of tumours together with their chemo-resistant nature contribute to the dismal 15% 5-year survival.5 New therapeutic strategies are therefore required.
Recent trials of combinations of cytotoxic therapies have at best resulted in modest incremental improvements in survival; 6–9however, the addition of a targeted agent inhibiting a defined molecular abnormality may result in dramatic improvements.10 ,11 The rationale for these individualised regimens is centred on the theory of oncogene dependence which proposes that a single or small number of abnormalities are key drivers of cancer cell growth and maintenance;12 if identified and silenced, a period of oncogenic shock ensues resulting in tumour regression.13 ,14 Despite their considerable promise, this approach has not been broadly adopted in the management of epithelial malignancies because of considerable inter-patient heterogeneity despite the activation of common signalling pathways.15
The identification in each cancer for the presence of a single, specific molecular abnormality prevalent in a given tumour type for which an inhibitor is available would improve the efficacy of targeted therapy. The identification of ErbB2 is used clinically in patients with breast or gastric tumours16 and EGFR mutations in specific situations in lung tumours.17 ,18 However, focusing on a single target significantly limits the therapy to the 15%–20% of patients with this abnormality; furthermore, it fails to identify those with additional molecular abnormalities which would confer resistance to therapy.19 For personalised therapy to benefit a greater proportion of patients and to overcome resistance mechanisms, a broader panel of targets could be characterised at initial presentation. Such a panel would evolve from systematic approaches to screen a range of candidates for identification of therapeutic target(s) such as the mutation profiling of 12 genes in lung cancer.20 For many cancers, including oesophago-gastric cancer, the comprehensive list of mutations is not yet clear. Furthermore, the constitutive activation of receptor tyrosine kinases (RTKs) can result from a translocation and/or amplification event at the genomic level as well as from mutation requiring more than one type of assay for analysis. Determining RTK activation status by assaying phosphorylation might be an alternative way to determine the optimal therapeutic approach.
The aims of this study were therefore to: (1) determine the most frequently active cell signalling pathways, (2) evaluate whether an RTK array measuring phosphorylation status could be used to select the most effective and broadly applicable therapeutic strategies in a panel of disease specific cell lines and (3) apply this approach to human tissue samples as proof of principle.
Methods
Human samples
The work using human tissue was covered by relevant institution ethics approvals (MREC number 07/H0305/52) and informed consent was obtained in all cases.
Tissue microarrays (TMAs) of oesophageal and gastric samples (n=434) were generated21 (demographics in table S1 for samples in the TMA). An expert gastrointestinal pathologist selected three separate cores for each case. All other human specimens were collected prospectively at Addenbrooke's Hospital, Cambridge, UK (see table S1 for demographics).
Gene expression datasets
Cancer cohort
The methods for expression array analysis for oesophago-gastric adenocarcinoma samples (n=75) have been described elsewhere (demographics in table S1).21
Progression cohort
For mRNA isolation and gene expression profiling, a section was taken from each frozen specimen for consensus histopathological diagnosis from two expert gastrointestinal pathologists. Samples with a minimum of 50% of the asserted diagnosis were used (normal oesophagus (n=6), Barrett's oesophagus (n=21), dysplastic Barrett's oesophagus (n=30 including high-grade and low grade dysplasia) and oesophageal cancer (n=8)). The methods for expression array analysis for oesophago-gastric adenocarcinoma samples (n=75) have been described elsewhere.22
Cell lines and reagents
Our cell line panel was derived from primary tissues and consisted of the Barrett's oesophagus lines ChTert and QhTert (gift from P Rabinovicth);23the oesophageal adenocarcinoma lines, Flo (gift from D Beer24), OACp4, OACM5.1 and OC3 (gift from W Dinjens25), OE33, OE19 (ECACC), PT1590 (gift from C Klein26) and Jh-Eso-Ad1 (gift from A Maitra27); as well as the gastric adenocarcinoma lines KatoIII, MKN45, MKN1 (gifts from A Kistimaki28) and HSC39 (gift from K Yanagihara29) (table S2). The identity of Flo, OACp4, OACM5.1, OE33, OE19 and Jh-Eso-Ad1 has been previously verified.30 All cell lines were cultured in RPMI medium (Sigma-Aldrich, Gillingham, UK) with 10% fetal calf serum (PAA, Yeovil, UK) except for KatoIII which required 20% fetal calf serum and OC3 and Flo which were grown in DMEM (Gibco, Invitrogen, Paisley, UK).
The EGFR/ErbB2 inhibitor (Lapatinib, Tykerb) and the Mek inhibitor (compound GSK1120212B) were provided by GlaxoSmithKline while other tyrosine kinase inhibitors (TKIs) were purchased: EGFR TKI (Erlotinib, Xing Cheng Chempharm, Taizhou, China), Met TKI (PD0325901; Biovision, Cambridge, UK), FGFR TKI (PD173074; Sigma-Aldrich) and Ret TKI (SU5416; Calbiochem, Merck, Nottingham, UK). TKIs were diluted to working concentrations in DMSO (Sigma-Aldrich, Cat n#D8418) and all treatment assays were carried out using serum supplemented medium to reduce the background stress on the cells.
GSEA and HOPACH clustering
Gene set enrichment analysis (GSEA) determines whether a defined set of genes correlates with a particular phenotype within microarray data. GSEA was performed using the GSEA software (http://www.broad.mit.edu/gsea/index.jsp) using the normalised score from the cancer and the progression cohorts. The KEGG and Biocarta signalling pathways selected from the molecular signatures database (MSigDB; http://www.broadinstitute.org/gsea/msigdb/index.jsp) were used as gene sets. A statistical significance of p<0.05 based on normalised enrichment score was required for a sample to be considered as enriched for a particular pathway. The normalised enrichment score is the primary statistic for examining gene set enrichment results. By normalising the enrichment score, GSEA accounts for differences in gene set size and in correlations between gene sets and the expression dataset; therefore, the normalised enrichment scores can be used to compare analysis results across gene sets.
The hierarchical ordered partitioning and collapsing hybrid (HOPACH) package31 implemented in bioconductor (http://bioconductor.org) was used to cluster samples using pathway enrichment scores. A similarity matrix for samples was generated from the distance matrix used to cluster samples. The result of clustering was visualised in the Maple Tree program (http://mapletree.sourceforge.net/).
Immunohistochemistry for P-ERK
Immunohistochemistry was performed on a BondMax autostainer (Leica, Milton Keynes, UK) using an antibody against P-Erk (Cell Signalling, Hitchin, UK).21 Each of the triplicate TMAs was scored for nuclear P-Erk based on intensity (1+ for weak, 2+ for medium and 3+ for strong) of staining. Data are presented as a final binary score where Erk was considered inactive for scores of 0 and 1+ and active for scores of 2+ and 3+.
RTK phosphorylation profiling
RTK membrane arrays (R&D systems, Abingdon, UK) covering 42 of the 58 human RTKs were used to profile individual tumours and cell lines (complete array map in figure 3B). Snap frozen tumour samples were homogenised in ice cold lysis buffer (50 mM tris-HCl, 1% triton X-100, 10% glycerol, 1 mM phenylmethylsulfluoride, 100 mM sodium fluoride, sodium pyrophosphate, protease and phosphatase inhibitor tablets (Roche, Welwyn Garden City, UK)). Cell lines were washed in phosphate buffered saline (PBS) and grown in serum-free medium for 24 h before harvest. In all, 250 μg of cell line protein or 1–2 mg of protein were incubated with the membrane array (R&D Systems) following the manufacturer's instructions.
Proliferation assays
A total of 1000 cells (in 96 well-plate) were grown for 24 h in complete media and then treated with a TKI at a range of concentrations for 72 h. Cell proliferation was assessed using the CellTitreGlo assay (Promega, Southampton, UK). When combinations of TKIs were used, the concentration of the TKI inhibiting the most active RTK was used across a broad concentration range while the concentration of TKI(s) against the remaining RTKs was held constant at 1 μM.
Apoptosis assays
Cleaved caspase 3/7 assay and flow cytometry were run for all single drug targets with IC50 in the nm range and using TKI combinations if they had been significantly better at suppressing cell proliferation than single TKI treatment.
Cells were seeded as described for proliferation assays. The Caspase 3/7 Glo assay (Promega) was used.
For cell cycle analysis, cells were grown for 24 h in complete media, treated with a specific TKI in complete medium for 24, 48 and 72 h, harvested by trypsinisation, washed in PBS, fixed in ice cold 70% ethanol and stored at −20°C. Cells were then washed in PBS and incubated with 4 μg/ml RNase at 37°C for 1 h before addition of 10 mM propidium iodide and processed using an LSR II instrument with FACSDiva software (BD Biosciences, Oxford, UK).
Protein phosphorylation status
Antibodies for EGFR, P-EGFR, ErbB2, P-ErbB3, Met, P-Met, Ret, P-Ret, Akt, P-Akt, ERK, P-ERK and β-actin were purchased from Cell Signalling. The P-ErbB2 antibody was from Thermo Fisher Scientific; FGFR2 and P-FGFR antibodies were from R&D Systems; and the ErbB3 antibody was from DAKO, Ely, Surrey, UK.
Cells were cultured for at least 24 h and then treated with a specific TKI or TKI combination for 8 h in serum supplemented medium. Cells were harvested in ice cold lysis buffer as outlined above. In all, 40 μg of protein was used for western blotting following standard procedures. Separate blots from a single protein extraction were run for each protein species.
Statistical analysis
Cell proliferation, caspase activation and cell cycle analyses were performed using GraphPad Prism statistical software (version 3; La Jolla, California, USA). In all cases, the mean of three biological replicates, each with at least three technical replicates, was calculated with the corresponding SD. Where appropriate, curves of best fit were used to calculate an inhibitory concentration 50 (IC50) value for TKI treatment. The effects of different treatments were determined using ANOVA with Bonferroni correction.
Results
The mitogen activated protein kinase (MAPK) pathway is an enriched pathway in oesophageal and gastric adenocarcinomas
HOPACH clustering was performed to visualise groups with similar GSEA enrichment scores in a cohort of 75 largely chemo-naive patients with oesophago-gastric junction (GOJ) malignancies (demographics in table S1)21 for signalling pathways denoted in the Kyoto Encyclopedia of Genes and Genomes (KEGG) and Biocarta databases (figure 1A). A large group (38/75, 50.7%) of samples enriched for overexpression of signalling pathway genes was identified (p<0.001), and was more stable than the non-overenriched groups using non-parametric bootstrap resampling (n=10 000) (figure 1A).

MAPK pathway is the most overenriched pathway in oesophago-gastric cancers. Hierarchical ordered partitioning and collapsing hybrid clustering (A) was applied to the enrichment scores for the KEGG signalling pathway in the cohort of 75 cancer samples. The distance matrix allows visualisation of the similarity of gene expression: red represents close proximity and white a large distance. Clusters with similar expression appear as blocks on the diagonal axis; solid lines indicate a stable cluster of samples enriched for overexpression of signalling pathway genes (n=38/75, indicated in the highlighted box). The signalling pathways on the KEGG database which were statistically enriched in the cancer dataset are shown in order of frequency (B). Pathways signalling through the MAPK pathway (hashed bars), including ErbB2 and Toll-like receptor which the KEGG database annotates separately, represent the most enriched pathways in oesophago-gastric cancers. The dashed line shows those pathways enriched in >25% cases. The six pathways enriched in more than 25% of the samples from the cancer cohort (above dashed line in panel B) were then examined in a progression cohort (C) consisting of samples from normal oesophagus (NE) (n=6), Barrett's oesophagus (BE) (n=21), dysplastic Barrett's (DYS) (n=30) and adenocarcinoma (AC) (n=8).
The signalling pathways from KEGG displaying statistically significant enrichment in the case cohort (p<0.05) are displayed in figure 1B. The MAPK pathway was statistically enriched in the highest number of samples (32/75 samples, 42.7%). Three MAPK related pathways (MAPK, ErbB2 and Toll-like receptor), out of the 21 statistically enriched pathways, were relevant in 80% of samples. The same analysis was performed using pathways from the Biocarta database and six out of the top 20 (30%) statistically enriched pathways (MAPK, EGF, PDGF, p38, Erk and Akt) were found to contribute to the MAPK pathway (data not shown). If oesophageal and gastric cancers were considered separately, the MAPK related pathways remained the most commonly enriched pathway suggesting that tumours from adjacent anatomical sites, including around the GOJ, have similar pathway dependence.
Signalling pathways are not independent and therefore some caution must be exercised in determining the importance of individual pathways from these analyses. However, if pathways are biologically important, the frequency of their enrichment should increase progressively over the pathogenesis of the disease. To examine this, enrichment of KEGG pathways, known to be relevant in more than 25% of cancer cases in the microarray analysis (MAPK, GNRH, ErbB2, insulin, Wnt, phosphatidyl inositol and calcium which are displayed above the dotted line in figure 1B), were assessed in samples representative of the pathogenic stages of oesophageal and GOJ adenocarcinoma (normal squamous oesophagus, Barrett's metaplasia, Barrett's with dysplasia and adenocarcinoma). MAPK and Wnt were the only pathways with progressive enrichment over the progression continuum (p<0.05, figure 1C). While the Wnt pathway is interesting in itself and has a known role in colonic carcinogenesis,32 it is not easily targetable by drugs at present. We therefore focused our efforts on the MAPK pathway.
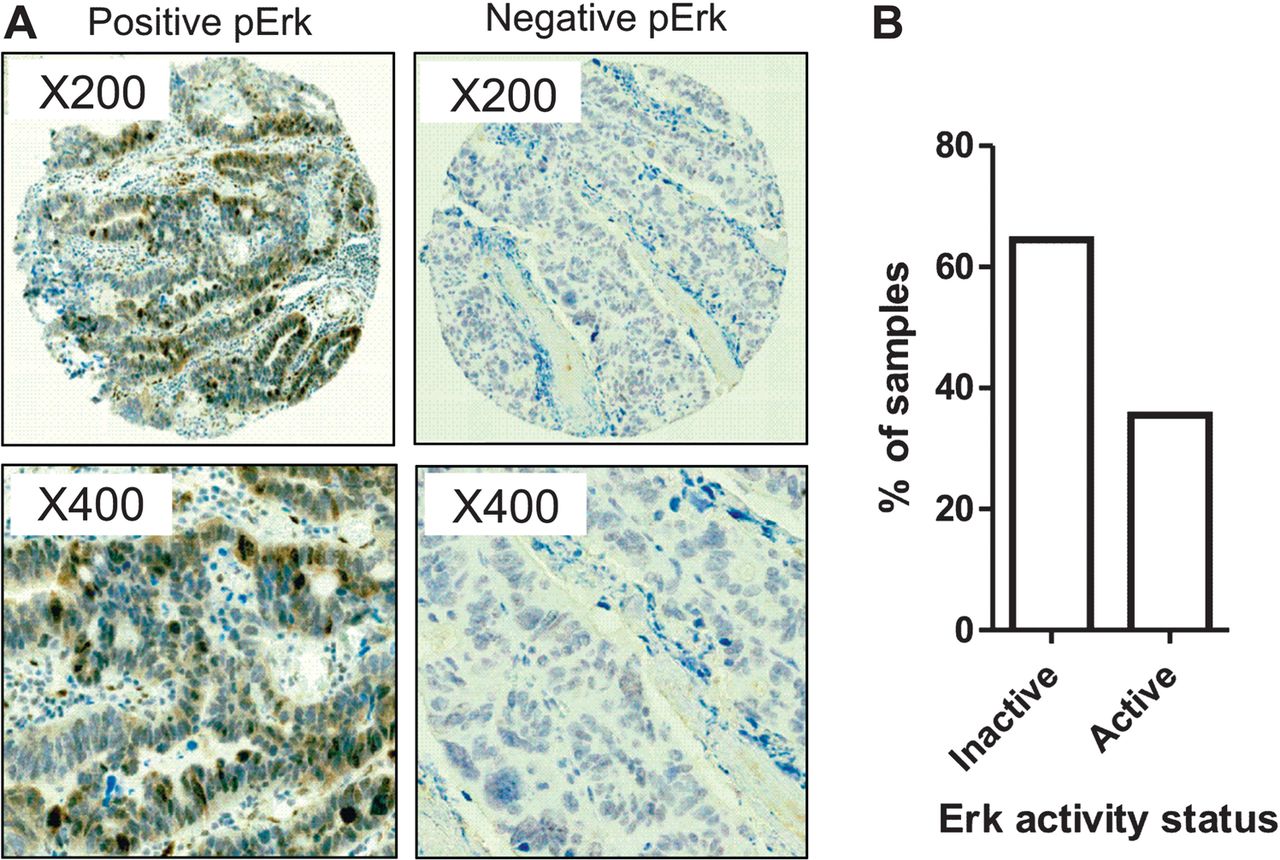
Phospho-Erk status confirms MAPK as a key pathway
The importance of the activation status of the MAPK pathway, measured by phospho-Erk immunostaining, was confirmed in a large independent cohort of 434 cases of oesophageal and gastric adenocarcinomas (figure 2A, demographics in table S1).21 In all, 148/434 (34.3%) of cases expressed high levels of phosphorylated Erk (2+, 3+) (figure 2B). This is in the same range of the samples displaying MAPK pathway enrichment (42.7%) from our expression profiling data.

MAPK pathway activation is driven by multiple active receptor tyrosine kinases (RTKs). MAPK activation was confirmed by examining P-Erk status in 434 samples on a tissue microarray (A). Two representative cases, one with P-Erk and one lacking P-Erk are shown. Percentage of the 434 cases with and without P-Erk (B).
Constitutive phosphorylation of Erk may also be a consequence of a single base substitution in codon 12 or 13 of RAS; however, no mutations were identified in a subset of 67 samples from the cancer cohort (data not shown).
Selective inhibition of activated RTKs inhibits MAPK signalling, cell growth and results in a loss of cell viability
We next profiled a panel of 14 oesophageal and gastric cell lines using an RTK array (table S2 and examples of arrays are shown in figures 3⇓–5). To determine whether RTK profiling could be used to infer therapeutic decisions, relevant TKIs were selected based on the RTK profile. Inhibition of the downstream MAPK component Mek was also performed since resistance to RTK inhibition develops clinically and so alternative approaches need to be pursued. A range of RTK profiles were seen in the cell lines and varied from no RTK activation, MKN1 (figure 3A), to one dominant active RTK in OE19, MKN45 and KATOIII (figure 4A–C) and highly complex profiles with multiple active RTKs in HSC39 and OE33 (figure 5A,B).

Receptor tyrosine kinase (RTK) inhibition is ineffective in inducing cell death in a cell line without RTK activation. MKN1 RTK activation profile (A) and full RTK array map (B). Each RTK is represented in duplicate on the array and each dot in the four corners is a loading control. A number of negative controls are included: IgG1, IgG2A and IgG2B are mouse-IgG controls, IgG is a goat control and a PBS control. The proliferation dose–response of MKN1 to tyrosine kinase inhibitors is shown in (C). Data are presented as median (±95% CIs) as a percentage of DMSO treated cells.

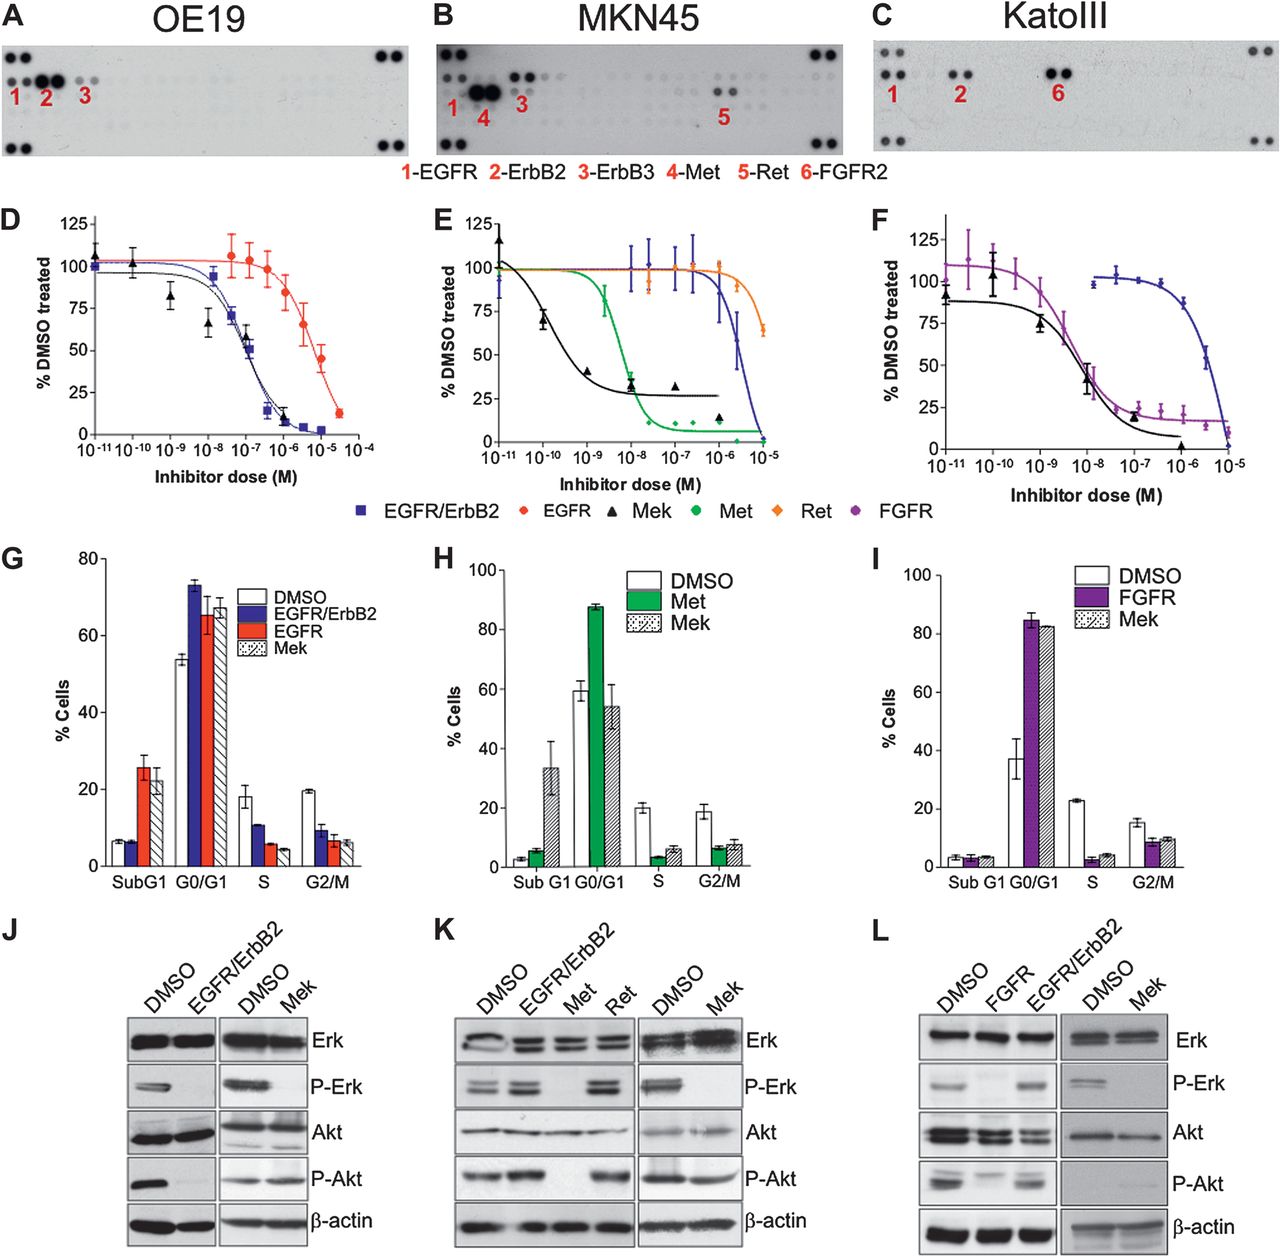
Single tyrosine kinase inhibitors (TKIs) or Mek inhibition, identified from receptor tyrosine kinase (RTK) array, are sufficient to induce cell death and downstream targets loss of phosphorylation in OE19, MKN45 and KatoIII. RTK activation profile (A–C), proliferation dose–response to TKIs (D–F), cell cycle profile in response to TKIs (G–I) and western blotting for downstream MAPK components Atk and ERK (J–L) for OE19, MKN45 and KatoIII. Each active RTK is numbered with the corresponding name indicated below the membranes and each pair of dots in the four corners is loading controls. Proliferation and cell cycle profiles were performed following treatment with a variable concentration of TKIs (alone or in combination). Data are presented as median (±95% CIs) as a percentage of DMSO treated cells. Only the single inhibitors and the best combinations are presented; a full summary of all is given in table 1.

Multiple tyrosine kinase inhibitors (TKIs) or Mek inhibition, identified from receptor tyrosine kinase (RTK) array, are required to induce cell death and downstream targets loss of phosphorylation in HSC39 and OE33. RTK activation profile (A and B), proliferation dose–response to TKIs (C and D), caspase 3/7 activation dose–response to TKIs (E and F) and western blotting for downstream MAPK components Atk and ERK (G and H) for HSC39 and OE33. Each active RTK is numbered with the corresponding name indicated below the membranes and each pair of dots in the four corners are loading controls. Proliferation and cell cycle profiles were performed following treatment with a variable concentration of TKIs (alone or in combination). When combinations of drugs were used, the concentration of the TKI targeting the most active RTK (FGFR2 for HSC39 and Met for OE33) was varied (from 0.01 nM to 100 μM; exact range depending on the cell type) and the concentration used for the other TKIs was kept constant at 1 μM. Data are presented as median (±95% CIs) as a percentage of DMSO treated cells. Only the single inhibitors and the best combinations are presented.
For each cell line, TKIs were used singly or in combination on the basis of the RTK activity profile to establish whether RTK(s) could be predicted to be critical for cell proliferation and survival on a case by case basis. The complete experimental data are shown in table 1.
Summary of the effect of tyrosine kinase inhibitor (TKI) and combinations on proliferation, cleaved caspase 3/7, cell cycle profile and phosphorylated status of receptor tyrosine kinase (RTK) and downstream targets in a panel of oesophago-gastric cell lines
In MKN1, with no active RTKs, TKIs or Mek inhibition did not inhibit proliferation until the μM range (figure 3C).
A single TKI targeting the most highly phosphorylated RTK (EGFR/ErbB2 for OE19, Met for MKN45 and FGFR for KatoIII; figure 4A–C) in cells with a simple RTK profile inhibited proliferation with IC50 of 100 nM (95% CI 39 to 120) for OE19, 5.6 nm (95% CI 4.0 to 7.7) for MKN45 and 4.8 nM (95% CI 3.4 to 6.7) for KatoIII (figure 4D–F). This was accompanied by a cytotoxic effect with an increased subG0 fraction in OE19 and a cytostatic effect with an increased G0/G1 fraction in MKN45 and KatoIII together with a fourfold increase in caspase 3/7 activity in OE19 and a twofold increase in MKN45 and KatoIII at 24 h (figure 4G–I and table 2). Alternatively, the use of a Mek inhibitor was also sufficient to inhibit proliferation with IC50 values of 95 nM (95% CI 34 to 263) for OE19, 14 nM (95% CI 0.4 to 46) for MKN45 and 5.8 nM (95% CI 3.9 to 8.4) (figure 4D–F). Apoptosis was also induced with a cytotoxic effect in OE19 and cytostatic effect in MKN45 and KatoIII by 24 h (figure 4G–I). These effects correlated with the abrogation of Erk phosphorylation at a TKI or Mek inhibitor concentration comparable with the IC50 (figure 4J–L). However, loss of Akt phosphorylation was only seen for the TKI and but not for Mek inhibition (figure 4J–L). The addition of further TKIs to inhibit RTKs coactivated at a lower level had no cumulative effect; and when used alone had little efficacy (table 1). This finding was in keeping with the failure of these additional TKIs to suppress downstream pathway activity, especially phosphorylation of ERK and Akt (table 1).
Summary of caspase 3/7 activity following treatment with the best drug combination
HSC39, with constitutive activation of four RTKs (EGFR, ErbB3, FGFR2 and Met), demonstrated a different response to RTK inhibition (figure 5A). First, HSC39 was sensitive to a single TKI targeting the most highly active RTK alone, FGFR2. The FGFR2 inhibitor resulted in a dramatic reduction in proliferation with an IC50 of 5.9 nM (95% CI 4.8–7.3 nM, figure 5C, table 1); a cytotoxic effect (figure 5E) and a fivefold increase in caspase 3/7 activation within 24 h (table 2); and suppressed phosphorylation of ERK and Akt (figure 5G, table 1). A similar effect was seen with Mek inhibition although 72 h incubation was necessary to have the cytotoxic effect (data not shown). Treatment with single TKIs targeting the other coactivated RTKs had negligible effects (figure 5C,E, table 1). However, in contrast to the previous cell lines, a combination of TKIs to target FGFR2, EGFR, ErbB2 and Met, which were all constitutively active in HSC39, was significantly better than FGFR2 inhibition alone, though the absolute benefit was small (figure 5C,E and table 1).
OE33 displayed a complex activation map with six constitutively active RTKs: EGFR, ErbB2, ErbB3, FGFR3, Met and Ret (figure 5B). Treatment with a single TKI against any of these RTKs failed to inhibit proliferation unless doses in the μM range were used (figure 5D) and none fully abrogated ERK or Akt phosphorylation (table 1, figure 5H). However, the combined use of TKIs targeting Met (or with siRNA against Met, figure S1) and the ErbB family or of a Mek inhibitor inhibited OE33 proliferation (IC50 124 nm, 95% CI 80–193 nM for TKI combination and IC50 9.1 nm, 95% CI 3.7–22 nm for Mek inhibition; figure 5D), triggered caspase activation by 48 h with a small but consistent increased subG0 fraction at 24 h and completely suppressed downstream pathway activation (table 2 and figure 5F). In contrast to HSC39, the further addition of inhibitors targeting Ret and/or the FGFR family was not superior to the combined EGFR/ErbB2 and Met inhibition (figure 5D and table 1).
In summary, in 3/5 cases, inhibition of the single most active RTK predictable from the RTK array or using a Mek inhibitor had the maximal therapeutic effect (KATOIII, MKN45, OE19); in two cases with a more complex RTK activation profile, the use of TKI combinations or using a Mek inhibitor had an additional benefit (HSC39) or was essential to achieve the maximal effect (OE33). Furthermore, the choice of TKI would have been arduous and not as predictable without the RTK array and functional data.
RTK activation in a patient cohort
Since using an RTK array in cell lines could help in drug selection to ensure the maximal therapeutic effect, we postulated that a similar approach could be used in patients.
The phosphorylation status of 42 different RTKs in 46 snap frozen or fresh tumour samples (95% chemonaive) was measured using the same membrane array to determine the extent and range of RTK activation potentially in largely chemo-naive (93%) oesophageal and gastric tumours potentially responsible for this MAPK signalling (demographics in table S1 and figure 6). No RTKs were active in 8/46 cases (17.4%); EGFR alone was active in 8/46 cases (17.4%); two RTKs, usually members of the EGFR family, were active in 13/46 cases (28.3%); and multiple RTKs (median of 9) were active in 17/46 cases (37.0%) (figure 6A,B). The range of activated RTKs was extremely diverse with 38 different receptors, representing 13 distinct families, showing phosphorylation in at least one tumour case (table S3). These data confirm that MAPK activation can be driven by a range of upstream receptors and that individual tumours need to be profiled to maximise the therapeutic benefit.

Receptor tyrosine kinase (RTK) activation in human oesophageal adenocarcinoma specimens. RTK activation in human specimens using membrane arrays (A) was used to classify patients according to the number and the type of active RTKs (B).
Discussion
We have used a comprehensive and systematic approach entailing human tumour samples of oesophago-gastric adenocarcinoma and in vitro inhibition studies of human cell lines to characterise the key signalling pathways driving oesophago-gastric carcinogenesis. We have demonstrated that the choice of therapy can be enhanced by knowledge of the activation profiles of the RTKs and in keeping with other studies shown that targeting a downstream target, such as Mek, may also represent an efficacious strategy.
The strengths of this study lie in the direct assessment of human material from large clinical cohorts and the attempt to directly compare the efficacy of a number of small molecular inhibitors informed by a detailed knowledge of the RTK activation status of a given cell line. Limitations include the lack of in vivo data for the inhibitors and although a number of drugs were used in our study this could have been extended further, for logistical reasons, the number of already large experiments had to be kept manageable.
MAPK was identified as a putative dominant signalling pathway in oesophago-gastric adenocarcinomas and subsequent characterisation of potential upstream drivers demonstrated the diversity of RTKs which can be activated in these tumours. In contrast, RAS mutations were not identified in our cohort of 67 cases; in keeping with the literature.33–35 The incidence of RTK activation in our profiled cases is similar to that observed in previous studies of glioblastomas and non-small cell lung cancers.36 ,37 The leading RTKs identified from the cell line and human tumour screen were the EGFR family (EGFR, ErbB2, ErbB3 and ErbB4), the FGFR family (FGFR1–4) and Met. The potential role of the identified targets in this tumour type is supported by a number of descriptive studies which reported Met and ErbB2 amplification in 8%–10% and 7%–18% of oesophago-gastric tumours, respectively.38–42 FGFR2 has been shown to be mutated at key conserved residues in gastric adenocarcinomas.43 A recent international clinical trial has demonstrated an increased survival afforded by Trastuzumab (ErbB2 inactivating antibody) treatment in combination with chemotherapy in patients with ErbB2-positive advanced oesophago-gastric tumours.44
These in vitro data demonstrate that in the absence of RTK activation (figure 3, 17.4% of cases), the addition of a targeted agent is unlikely to be effective. However, in patients with evidence of RTK activation (82.6% of cases), inhibition of the upstream targets by single TKIs or combinations of inhibitors demonstrated three different scenarios for inducing a cytotoxic effect in vitro. In cell lines with an obvious dominant RTK (figure 4), therapy with a single TKI was sufficient to produce the cytotoxicity; this situation was present in almost half of human tumour samples. However, in the remaining 37% of tumours a more diverse range of RTKs were active (figure 5); this was modelled by two of the cell lines panel. In one line, HSC39, a combination of three TKIs proved more effective than single agent inhibition alone while in a third situation, OE33, dual agent treatment was necessary due to the high level activation of two RTKs causing redundancy. The dominance of a single RTK in a subset of our cell lines is in keeping with the theories of oncogene dependence and oncogenic shock12 ,13 whereas the requirement for a broader inhibition of activated RTKs to maximise the tumour response in other cell lines supports previous findings in glioblastomas.36
We also investigated the efficacy of a Mek inhibitor since it has been suggested that targeting downstream components of the activated pathway may highlight areas of extreme fragility and attractive therapeutic targets.45 ,46 In all, 27 multicentre, early phase trials of various oral Mek inhibitors are currently ongoing in patients with advanced tumours.47 Early results suggest that they are well tolerated and have efficacy in suppressing target phosphorylation in tumour tissue.48 Resistance to current TKI therapies has been associated with the upregulation of alternative RTKs or by mutating the target RTKs;49–51 these mechanisms would not result in resistance to Mek inhibition. There also remains the possibility that the most effective therapy in the long term would be a multi-targeted TKI or dual targeted approach which combined upstream and downstream target inhibition to give a sustained suppression of signalling while also pre-empting potential mechanisms of tumour resistance. The major challenge is not identifying individual therapeutic targets (the literature addressing this aspect is vast) but determining which are the most clinically relevant candidates and whether inhibition using a single inhibitor or a combination is most effective and then translating this information into a therapeutic strategy which allows personalised chemotherapy to maximise outcomes and minimise toxicity in a manner that is practical and applicable to the clinic. This study aimed to address these problems using oesophago-gastric adenocarcinomas as a model since the key signalling pathways in this disease have not been thoroughly elucidated and targeted therapy is only just beginning to be applied.
Overall, we have demonstrated that the MAPK pathway is commonly activated in oesophago-gastric cancer secondary to activation of a number of RTKs. Knowledge of the RTK activity profile, using RTK arrays, is useful to guide which TKI would offer therapeutic efficacy. If multiple RTKs are active, inhibition of downstream signalling might offer an alternative clinical approach. It would be interesting to assess such a personalised strategy in a clinical trial setting.
Acknowledgments
We thank Zarah Abdullahi, Irene Debiram, Sarah Hilborne and Adrienne Pate for their invaluable help in obtaining human specimens and patients' demographics information. We thank the OCCAMS consortium for providing samples for this study. We thank Richard Wooster, Tona Gilmer and Sylvie Laquerre from GlaxoSmithKline for their gifts of Tykerb and of the Mek inhibitor (compound GSK1120212B). We are grateful for Beverley Haynes and the staff of Addenbrooke's tissue bank for their continued support and expertise.
References
Supplementary materials
Supplementary Data
This web only file has been produced by the BMJ Publishing Group from an electronic file supplied by the author(s) and has not been edited for content.
Files in this Data Supplement:
- Data Supplement 1 - Online tables
- Data Supplement 2 - Online figure 1
Footnotes
▸ Additional materials are published online only. To view these files please visit the journal online (http://dx.doi.org/10.1136/gutjnl-2012-302039).
-
Funding This work was supported by an MRC core grant, Cambridge Experimental Cancer Medicine Centre, NIHR Cambridge Biomedical Research Centre and a Coutts-Trotter studentship from Trinity College, Cambridge.
-
Competing interests None.
-
Ethics approval Ethics approval was provided by LREC Cambridgeshire.
-
Provenance and peer review Not commissioned; externally peer reviewed.