Article Text

Abstract
Objective The commensal microbiota, host immunity and metabolism participate in a signalling network, with diet influencing each component of this triad. In addition to diet, many elements of a modern lifestyle influence the gut microbiota but the degree to which exercise affects this population is unclear. Therefore, we explored exercise and diet for their impact on the gut microbiota.
Design Since extremes of exercise often accompany extremes of diet, we addressed the issue by studying professional athletes from an international rugby union squad. Two groups were included to control for physical size, age and gender. Compositional analysis of the microbiota was explored by 16S rRNA amplicon sequencing. Each participant completed a detailed food frequency questionnaire.
Results As expected, athletes and controls differed significantly with respect to plasma creatine kinase (a marker of extreme exercise), and inflammatory and metabolic markers. More importantly, athletes had a higher diversity of gut micro-organisms, representing 22 distinct phyla, which in turn positively correlated with protein consumption and creatine kinase.
Conclusions The results provide evidence for a beneficial impact of exercise on gut microbiota diversity but also indicate that the relationship is complex and is related to accompanying dietary extremes.
Statistics from Altmetric.com
Significance of this study
What is already known about this subject?
-
An altered gut microbiota composition has been associated with a number of diseases and syndromes, including obesity.
-
We and others have shown the primacy of diet in influencing the microbiota in obesity.
-
Loss of gut microbiota diversity has been linked to an increasing number of conditions such as autism, GI diseases and obesity associated inflammatory characteristics.
-
Akkermansia muciniphilla abundance has been shown to inversely correlate with obesity and associated metabolic disorders.
What are the new findings?
-
This is the first report that exercise increases gut microbial diversity in humans.
-
Protein consumption positively correlates with microbial diversity (correlation coefficients 0.24–0.43).
-
The athletes in the low body mass index (BMI) group had significantly higher proportions of the genus Akkermansia levels compared with the high BMI group.
How might it impact on clinical practice in the foreseeable future?
-
Our findings indicate that exercise is another important factor in the relationship between the microbiota, host immunity and host metabolism, with diet playing an important role. Further, intervention-based studies to tease apart this relationship will be important and provide further insights into optimal therapies to influence the gut microbiota and its relationship with health and disease.
Introduction
The commensal human gut microbiota has become the focus of converging interest from diverse disciplines, primarily because of its contribution to health and risk of disease throughout life.1 ,2 The changing composition of the human microbiota is linked with changes in human behaviour.3 Many of the elements of a modern lifestyle, particularly in early life, influence the composition of the microbiota.4 Disturbances of the microbiota at various ages may confer disease risk. In the elderly, the diversity and composition of the microbiota has been linked with various health parameters, including levels of inflammatory cytokines.5 The microbiota may also be a risk or protective factor in relation to immunoallergic and metabolic disorders.6––9 Thus, a signalling network among the microbiota, host immunity and host metabolism has become evident, with diet influencing each component of this triad.10 ,11
Although obesity-related disorders have been linked with alterations in the microbiota,12 the relationship between the microbiota and exercise or a sedentary lifestyle has received less attention. Some evidence suggests that exercise may modify the microbiota;13 therefore, we predicted that athletes should have a more diverse microbiota than their sedentary counterparts. To address this, we studied a professional rugby team while in the regulated environment of a preseason camp and performed a high-throughput DNA sequencing-based analysis of faecal microbiota with contemporaneous measurements of inflammatory cytokines and metabolic health. Since extremes of exercise are often associated with dietary extremes, the findings were correlated with diet. Because of the physical size of modern rugby players, two control groups were assessed; one matched for athlete size with a comparable body mass index (BMI) and another reflecting the background age-matched and gender-matched population. The results confirm differences in composition and diversity of the microbiota of athletes when compared with both control groups which correlate with dietary differences, and which are linked with a more favourable metabolic and inflammatory profile.
Materials and methods
Subjects characteristics
Male elite professional rugby players (n=40) were recruited for this study; the mean age of the athletes was 29 (±4) years and they had a mean BMI of 29.1 (±2.9). Healthy male controls were recruited from the Cork city and county region of Ireland; the mean age of controls was 29 (±6) years. Two groups of control were specifically recruited based on their physical size (BMI) relative to the athletes, with group 1 (n=23) having a BMI ≤25 and group 2 (n=23) having a BMI >28 (table 1). All subjects except one (Indian ethnicity) were of Irish ethnicity and all subjects gave written informed consent prior to the beginning of the study. This study was approved by the Cork Clinical Research Ethics Committee. Exclusion criteria included having a BMI between 25 and 28, antibiotic treatment within the previous 2 months or suffering from any acute or chronic cardiovascular, GI or immunological condition.
Subject characteristics
Experimental design
Faecal and blood samples were collected from all participants. DNA was extracted from fresh stool samples which were stored on ice prior to use. Each participant was interviewed by a nutritionist and completed a detailed food frequency questionnaire (FFQ). Body composition analysis data from dual-energy X-ray absorptiometry scans were received from the Irish Rugby Football Union for all athletes, dual-energy X-ray absorptiometry scans for controls were performed in University Hospital Cork and waist:hip measurements were taken for athletes and controls.
Nutritional and clinical data collection
Dietary data were collected by means of a FFQ which was administered by a research nutritionist. The FFQ was an adapted version of that used in the UK arm of the European Prospective Investigation into Cancer (EPIC) study14 which in turn, is based on the original Willett FFQ.15 ,16 To more comprehensively reflect the Irish diet, the 130-food item EPIC FFQ was extended to include an additional 57 food items. Participants were asked to recall dietary intakes over the previous 4 weeks. A photographic food atlas was used to pictorially quantify foods and beverages.17 Manufacturer's weights on packaging and household measures were also used to quantify foods. Intakes of nutritional supplements were recorded. Completed FFQs were coded and quantified by researchers and entered in the Weighed Intake Software Package (WISP, Tinuviel Software, Anglesey, UK), which uses McCance and Widdowson's The Composition of Foods, sixth edition plus all supplemental volumes to generate nutrient intake data.18 Data were subsequently imported into SPSS V.18 (SPSS, Chicago, USA) for analysis. Dietary data was visualised with correspondence analysis (R statistical package V.2.13.1).19 Fasting blood samples were collected and analysed at the Cork Mercy University Hospital clinical laboratories. Commercial multispot microplates (Meso Scale Diagnostics) were used to measure cytokines.
Control physical activity levels
As the athletes were involved in a rigorous training camp we needed to assess the physical activity levels of both control groups. To determine this we used an adapted version of the EPIC-Norfolk questionnaire.20 T-Tests were carried out to compare high BMI and low BMI controls.
DNA extraction and high-throughput amplicon sequencing
Stool samples were stored on ice until processed. DNA was purified from fresh stool samples using the QIAmp DNA Stool Mini Kit (Qiagen, Crawley, West Sussex, UK) according to manufacturer's instructions with addition of a bead-beating step (30 s×3) and stored at −20°C. The microbiota composition of the samples was established by amplicon sequencing of the 16S rRNA gene V4; universal 16S rRNA primers estimated to bind to 94.6% of all 16S rRNA genes (ie, the forward primer F1 (5′-AYTGGGYDTAAAGNG) and a combination of four reverse primers R1 (5′-TACCRGGGTHTCTAAAGNG), R2 (TACCAGAGTATCTAATTC), R3 (5′-CTACDSRGGTMTCTAATC) and R4 (5′-TACNVGGGTATCTAATC) (Ribosomal Database Projects Pyrosequencing Pipeline: http://pyro.cme.msu.edu/pyro/help.jsp) were employed for PCR amplification. Molecular identifier tags were attached between the 454 adaptor sequence and the target-specific primer sequence, allowing for identification of individual sequences from the pooled amplicons. Ampure purification system (Beckman Coulter, Takeley, UK) was used to clean the amplicons before being sequenced on a 454 Genome Sequencer FLX platform (Roche Diagnostics, Burgess Hill, West Sussex, UK) in line with 454 protocols at the Teagasc high throughput sequencing centre. DNA sequence reads from this study are available from the Sequence Read Archive (accession number PRJEB4609).
Bioinformatic analysis
The Stoney supercomputer at the Irish Centre for High End Computing was used for the following analysis. Raw sequences were quality trimmed using the Qiime Suite of programmes,21 any reads not meeting the quality criteria of a minimum quality score of 25 and sequence length shorter than 150 bps for 16S amplicon reads. The SILVA 16S rRNA (V.106) database was employed to BLAST the trimmed fasta sequence files using default parameters.22 ,23 Parsing of the resulting BLAST output files was achieved through MEtaGenome ANalyzer which uses a lowest common ancestor algorithm to assign reads to the National Center for Biotechnology Information taxonomies.24 Filtering was carried out within MEtaGenome ANalyzer using bit scores prior to tree construction and summarisation, similar to previous studies a bit-score cut-off of 86 was selected.25 Clustering of sequence reads into operational taxonomical units at 97% identity level was achieved using Qiime. The ChimeraSlayer program was used to remove chimaeras from aligned operational taxonomical units and the FastTreeMP tool generated a phylogenetic tree.26 ,27 α Diversity indices and rarefaction curves were generated using Qiime. β Diversities were also calculated on the sequence reads based on weighted and unweighted Unifrac and Bray-Curtis distance matrices; subsequently principal coordinate analysis (PCoA) and unweighted pair group method with arithmetic mean clustering was performed on the samples. KiNG viewer and Dendroscope software were used to visualise PCoA plots and unweighted pair group method with arithmetic mean clustering, respectively.28 Enterotype clustering was carried out according to the approach previously described.29
Statistical methods
Statistical analysis was carried out using GraphPad Prism V.5.04 (La Jolla, California, USA) R statistical package (V.2.13.1) and SPSS software package V.18 (SPSS, Chicago, USA).19 Kruskal-Wallis and Mann-Whitney tests were used to find significant differences in microbial taxa, α diversity, and clinical and biochemical measures. Adjustment for multiple testing was estimated using the false discovery rate functions (phylum and family level) in the R statistical package (V.2.13.1) using the Benjamini and Hochberg method.30
Results
Athletes have lower inflammatory and improved metabolic markers relative to controls
Subject characteristics are shown in table 1. While physical activity across the control groups was assessed using an adapted version of the EPIC-Norfolk questionnaire (see online supplementary table S1), plasma creatine kinase (CK, a marker of extreme exercise) was used to compare exercise levels between athletes and controls. Despite greatly increased levels of CK (figure 1), the athletes studied had a lower inflammatory status than controls (see online supplementary figures S1 and S2). Metabolic markers in athletes and low BMI controls were improved relative to the high BMI cohort (see online supplementary table S2 and figures S3 and S4).

Creatine kinase levels are elevated in athletes compared with controls. Plasma creatine kinase levels are significantly elevated in athletes (n=39) compared with low (n=23) and high (n=23) body mass index (BMI) controls. Results are expressed as mean value±SEM. Statistical significance was determined by Mann-Whitney tests for each pairwise comparison.
The gut microbiota of athletes is more diverse than that of controls
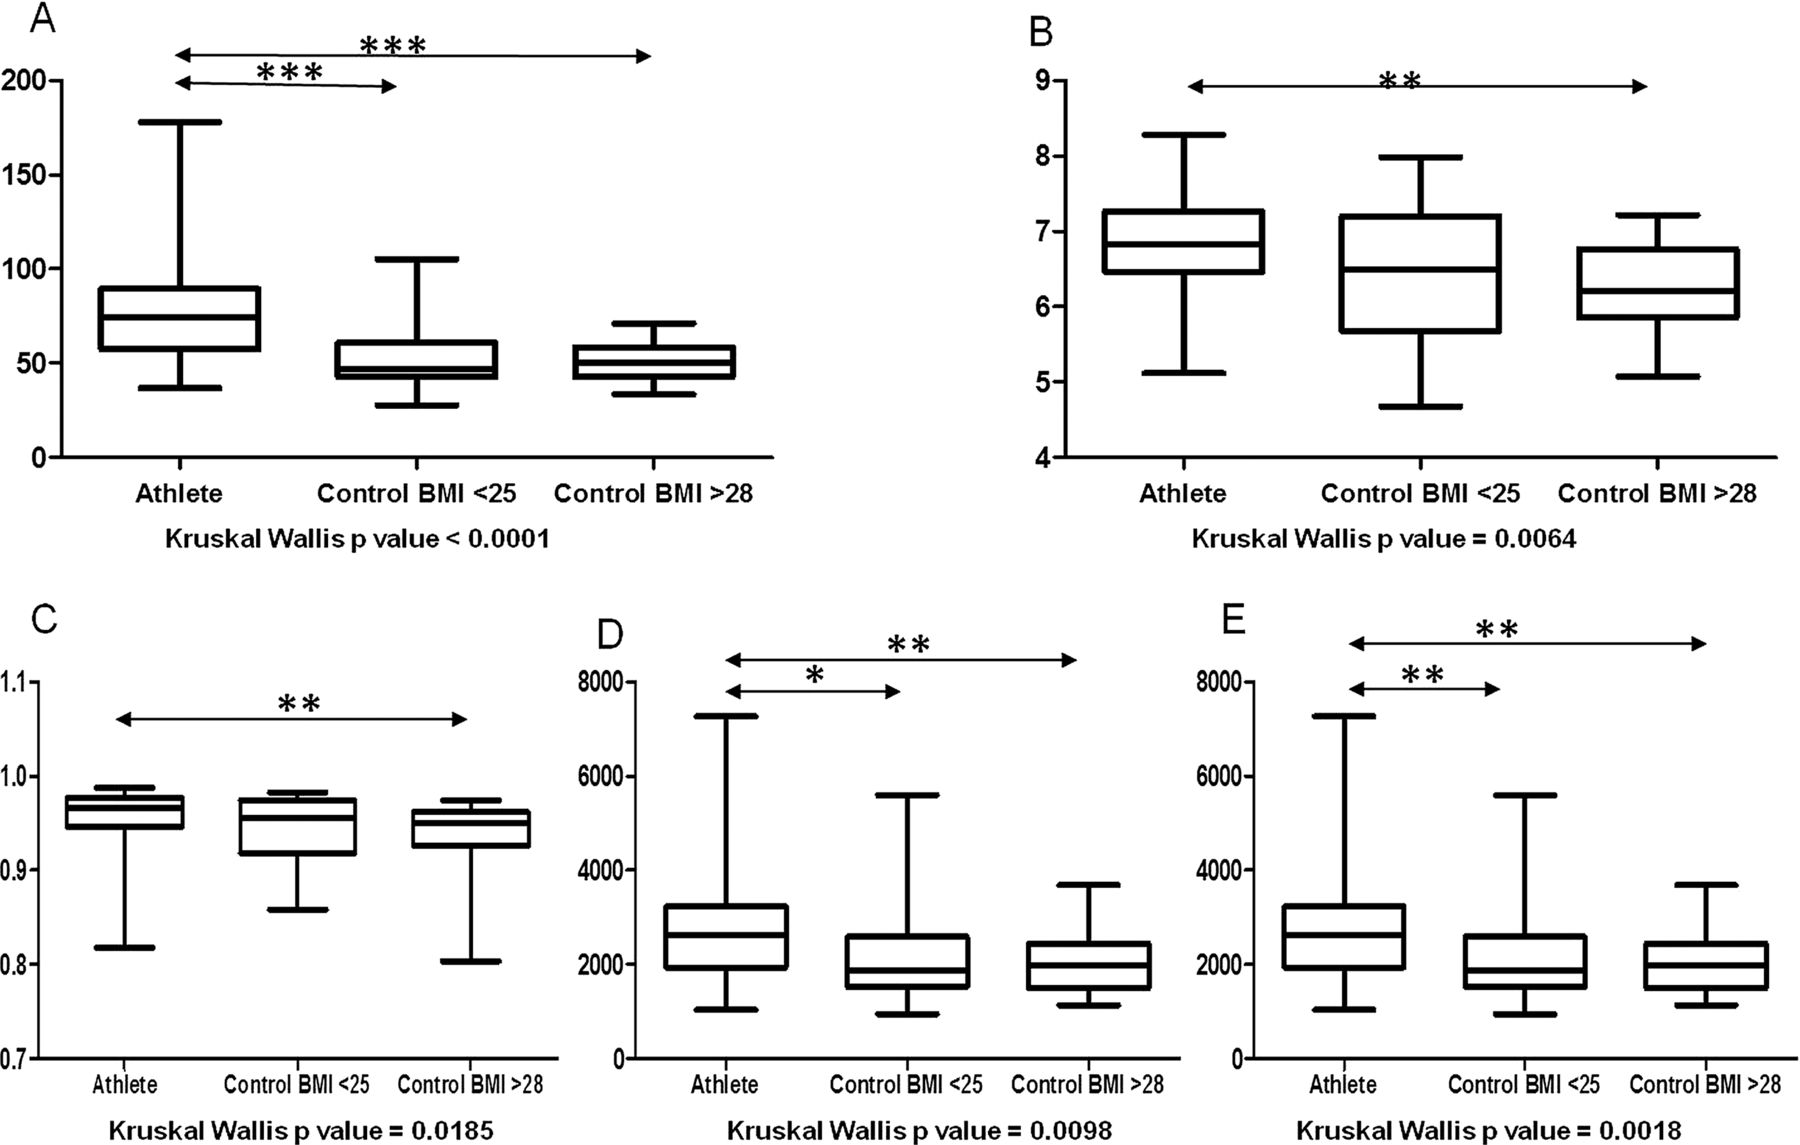
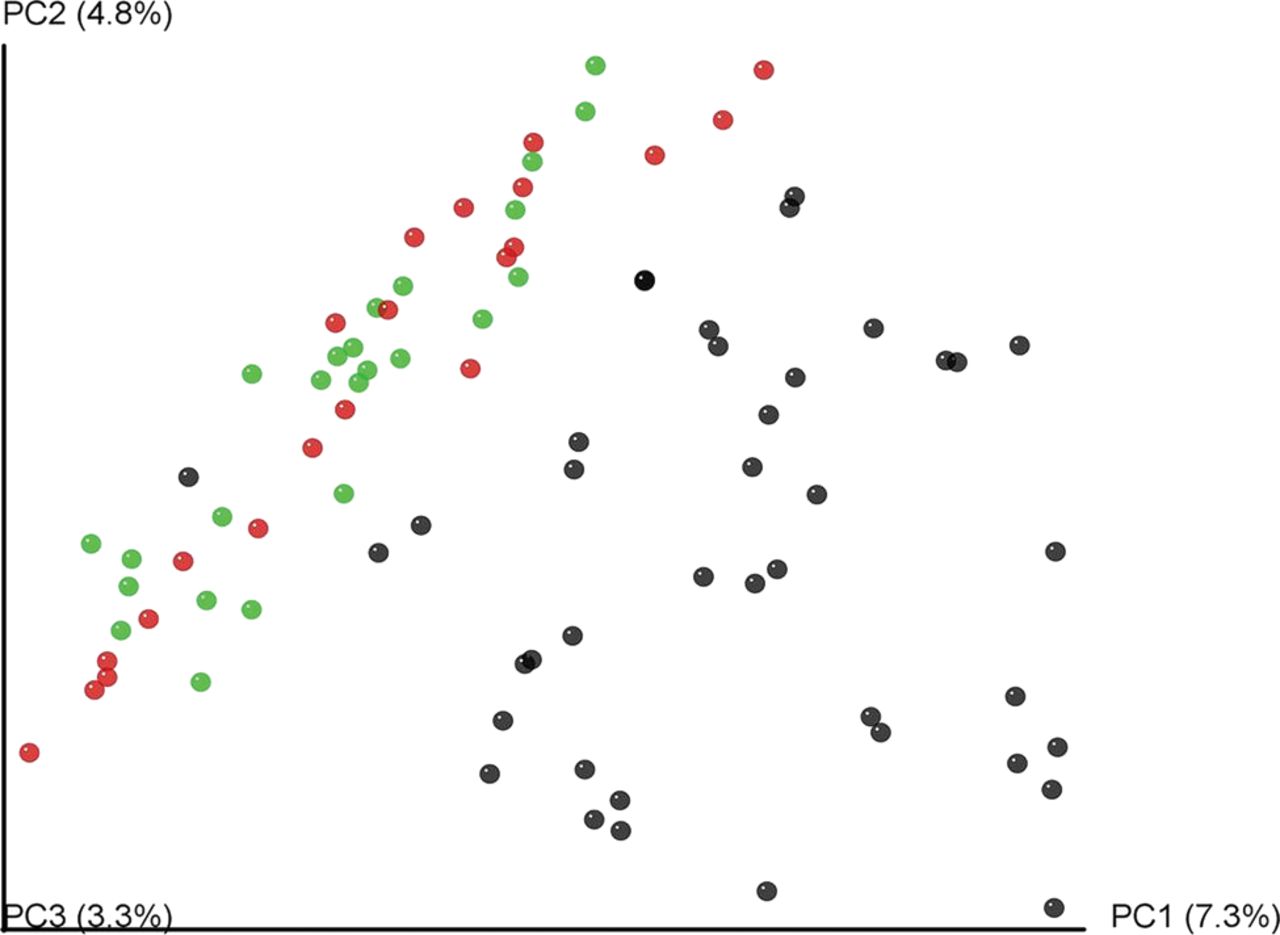
A total of 1 217 954 (1.2 million) 16S rRNA reads were generated from faecal samples provided by elite athletes and controls, with an average of 14 736 (±6234 SD) reads per athlete and 11 941 (±4515 SD) reads per control. In both cases rarefaction curves established that extra sampling would be of limited benefit (see online supplementary figure S5). Analysis of this data revealed that the α diversity of the elite athlete microbiota was significantly higher than that of the high BMI (Shannon index, Simpson) or both control groups (Phylogenetic diversity, Chao1, Observed species) (figure 2). The α diversity of the two control groups did not differ significantly from each other. PCoA based on unweighted Unifrac distances of the 16S rRNA sequences highlighted a clear clustering of the microbial populations of athletes away from that of controls (figure 3). This was further confirmed using hierarchical clustering (see online supplementary figure S6). No separation was observed between control groups. None of the previously reported enterotypes were identified.

Increased α diversity in athletes compared with controls. Comparison of microbiota indices across the three cohorts. (A) Phylogenetic diversity; (B) Shannon index; (C) Simpson; (D) Chao1 and (E) Observed species. Mann-Whitney tests were performed for each pairwise comparison. *p<0.05, **p<0.009, ***p<0.009. Kruskal-Wallis p values refer to tests performed across all three groups.

Unweighted UniFrac separates the athlete and control microbiota. Unweighted UniFrac principal coordinate analysis (PCoA) of faecal microbiota from 86 subjects. Subject colour coding: black, elite athletes; green, high body mass index (BMI) controls; and red, low BMI controls.
Proportions of several taxa are significantly higher in the gut microbiota of elite athletes relative to controls
Reads corresponding to 22 phyla, 68 families and 113 genera were detected in athlete faecal samples. In contrast, just 11 phyla, 33 families and 65 genera were detected in low BMI samples and 9 phyla, 33 families and 61 genera in high BMI samples (see online supplementary table S3). Pairwise comparisons of the elite athlete gut microbiota and the high BMI controls revealed that athletes had significantly greater proportions of 48 taxa than high BMI controls while only one taxon, Bacteroidetes, was significantly (p=0.022) less abundant in athletes (see online supplementary figure S7). The top six flux changes in relative abundance were in the Firmicutes, Ruminococcaceae, S24-7, Succinivibrionaceae, RC9 gut group and Succinivibrio groups. Notably, there were significantly higher proportions of Akkermansiaceae (family; p=0.049) and Akkermansia (genus; p=0.035) in elite athletes compared with the high BMI controls. A comparison of the elite athlete gut microbiota with that of low BMI controls revealed significantly higher proportions of 40 taxa and lower proportions of only three taxa, Lactobacillaceae (p=0.001) Bacteroides (p=0.035) and Lactobacillus (p=0.001), in the former (see online supplementary figure S8). The top six flux changes in relative abundance were noted among the Prevotellaceae, Erysipelotrichaceae, S24-7, Succinivibrionaceae, Prevotella and Succinivibrio groups. Pairwise comparisons of the microbiota of the control groups revealed differences in the proportions of seven taxa (see online supplementary figure S9). At genus level, significantly greater proportions of Dorea (p=0.026) and Pseudobutyrivibrio (p=0.022) and significantly lower proportions of Ruminococcaceae Incertae Sedis (p=0.021) and Akkermansia (p=0.006) were observed in the high BMI, relative to low BMI, controls.
Protein accounted for considerably more of the total energy intake of athletes than of controls
As expected, total energy intake was significantly higher in athletes than either control group (table 2). Athletes consumed significantly higher quantities of calories, protein, fat, carbohydrates, sugar and saturated fat per day than either of the control groups and consumed significantly higher quantities of fibre, monounsaturated fat and polyunsaturated fat than the high BMI control group (table 2). Protein accounted for considerably more (22%) of the total energy intake of athletes, than of the low BMI (16%) and high BMI (15%) control groups (table 2). While meat/meat products were the top contributors of dietary protein across all groups, supplements were the second highest (15%) contributor to protein in athletes and did not contribute considerably to protein consumption in controls (see online supplementary figure S10). Visualisation of dietary data with correspondence analysis highlighted a clear separation between the types of foods consumed by athletes and controls (figure 4A). The most discriminating food types were fruit, vegetables (athletes) and snacks (controls), whose consumption changes in a gradual manner along the y-axis (figure 4B).
Macronutrient intake in study participants
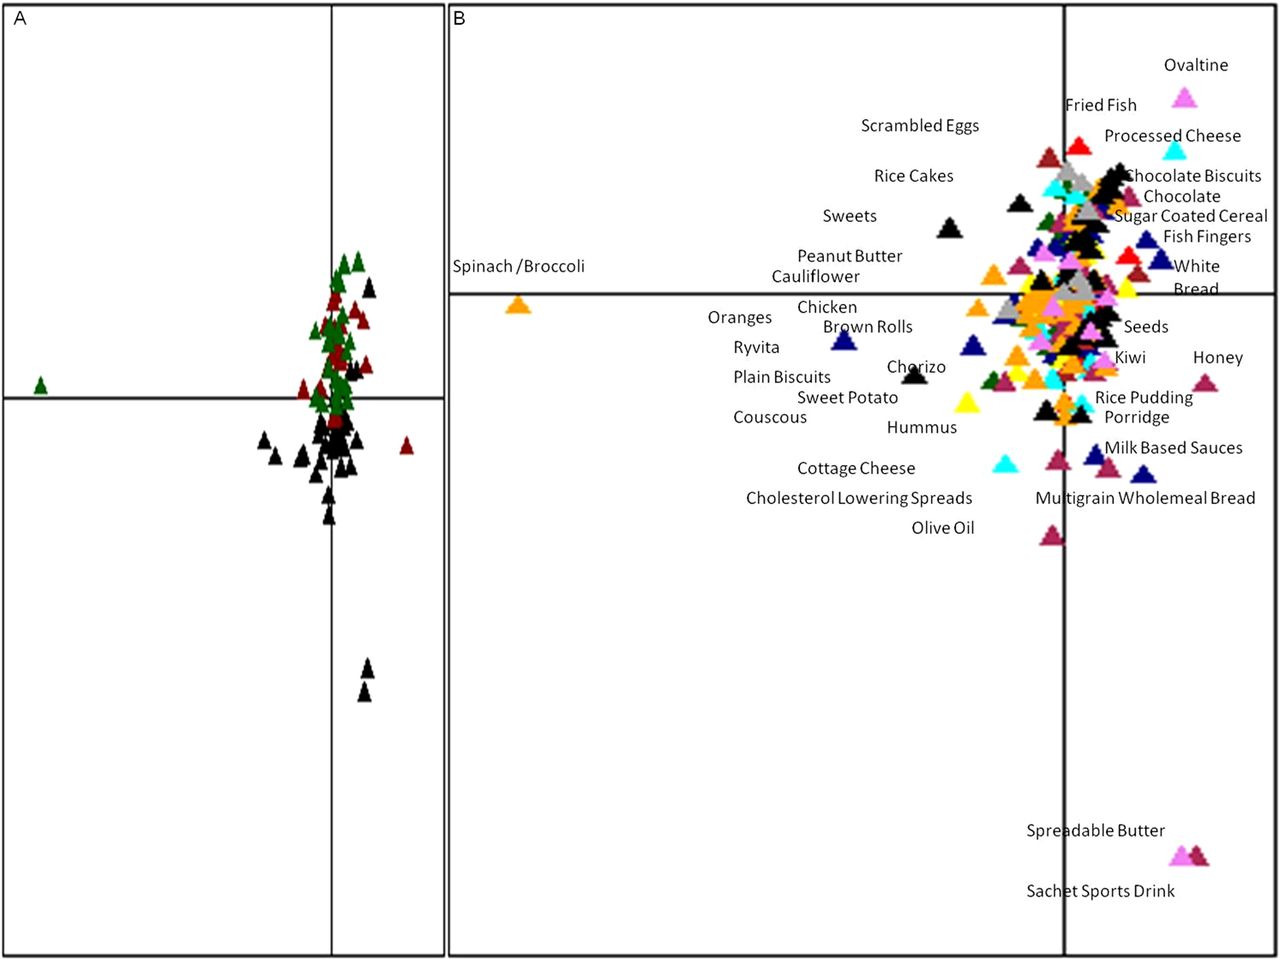
Dietary patterns separate elite athletes from controls. Food correspondence analysis: (A) Food frequency data visualised by correspondence analysis. By describing subjects’ responses according to their dominant sources of variation (food types), correspondence analysis can produce a single score for a subject from multiple measurements. Colour codes green-high body mass index (BMI) controls, red-low BMI controls and black-elite athletes. (B) Driving food types. Using the same scoring system, food can be evaluated and plotted on the same axis, providing a visual aid to get an overall view of how food drives the clustering. Colour codes green-meat, red-fish, blue-bread and cereal, brown-eggs, yellow-carbohydrates, cyan-dairy, maroon-spreads and sauces, orange-fruit and vegetables, black-snacks, violet-non-alcoholic beverages and dark grey-alcohol.
Exercise and protein intake as drivers of increased gut microbiota diversity in athletes
Correlations between health parameters (BMI, waist:hip ratio, metabolic and inflammatory markers) or diet with the respective taxa or microbial diversity were examined using Pearson correlations. Significantly positive correlations were revealed between leptin levels and BMI, body fat percentage and waist/hip measurement, while significantly negative correlations between leptin and lean body mass (see online supplementary figure S11), as well as between adiponectin levels and BMI and lean body mass (see online supplementary figure S12), were observed. Significantly, positive associations were noted between microbial diversity and protein intake (figure 5), CK levels (figure 6) and urea (see online supplementary figure S13). No correlations were observed after adjustment for multiple testing using false discovery rate values between microbial taxa and health parameters.

Protein intake positively correlates with α diversity. Subject colour coding: black, elite athletes; green, high body mass index (BMI) controls; and red, low BMI controls.

Creatine kinase positively correlates with α diversity. Subject colour coding: black, elite athletes; green, high body mass index (BMI) controls; and red, low BMI controls.
Discussion
Although the relationship between diet, the gut microbiota, host immunity and host metabolism is becoming more evident,10 ,11 the relationship between the microbiota and exercise has not been fully explored. Our findings show that a combination of exercise and diet impacts on gut microbial diversity. In particular, the enhanced diversity of the microbiota correlates with exercise and dietary protein consumption in the athlete group.
Diversity is important in all ecosystems to promote stability and performance. Microbiota diversity may become a new biomarker or indicator of health.31 Loss of biodiversity within the gut has been linked to an increasing number of conditions such as autism, GI diseases including IBD or recurrent Clostridium difficile-associated diarrhoea and obesity-associated inflammatory characteristics while increased diversity has been associated with increased health in the elderly.5 ,6 ,32––34 In this study, the diversity of the athlete gut microbiota was significantly higher than both control groups matched for physical size, age and gender. The proportions of several gut microbial taxa were also altered in athletes relative to controls. However, few differences were seen between the two control cohorts. Of note, the athletes and low BMI group had significantly higher proportions of the genus Akkermansia levels than the high BMI group. Akkermansia muciniphilla has been identified as a mucin-degrading bacteria that resides in the mucus layer and its abundance has been shown to inversely correlate with obesity and associated metabolic disorders in mice and humans.35 ,36 Everard et al35 recently showed that feeding Akkermansia, or restoration of Akkermansia levels by prebiotic treatment in diet-induced mice, correlated with an improved metabolic profile possibly due to enhanced barrier function. Interestingly, the athletes had lower inflammatory and improved metabolic markers relative to controls, and in particular the high BMI controls, demonstrating the enhanced health profile of this group. While the microbiota diversity of the two control groups did not differ significantly, it was noted that α diversity in the high BMI controls was numerically, although not significantly, lower than that of their low BMI counterparts. Reductions in the diversity of microbial populations in high BMI individuals has been reported in a recent study with a larger cohort size6 which also showed that dietary intervention can increase microbiota diversity in an obese cohort.10
Rugby is a vigorous contact sport requiring considerable fitness and increased dietary requirements.37 The levels of plasma CK and creatinine were significantly elevated in the elite athlete group consistent with the high exercise loads.38––40 Furthermore, diet was significantly different from that of controls, with increased intake of calories, protein, fat and carbohydrate. Diversity in the diet has been linked to microbiota diversity.5 In our study, microbiota diversity indices positively correlated with protein intake and CK suggesting that diet and exercise are drivers of biodiversity in the gut. The protein and microbiota diversity relationship is further supported by a positive correlation between urea levels, a by-product of diets that are rich in protein and microbiota diversity. Long-term diets have been linked to clusters in the gut microbiota with protein and animal fat associated with Bacteroides and simple carbohydrates with Prevotella.41 Fermentation of protein has also been suggested to result in the production of various potentially toxic products, such as amines and ammonia (NH3), and in one report, with growth of potential pathogens.42 In contrast, feeding of whey protein to mice mediates against the negative effects of a high fat diet.43 ,44 Indeed, in athletes, whey protein supplements represented a significant component of the protein intake in athletes but not controls. Whey protein has been associated with reductions in body weight and increased insulin sensitivity in the past and is frequently a major component of the athlete diet.45 ,46 Taken together, our results suggest that the relationship between exercise, diet and the gut microbiota warrants further investigation.
In conclusion, exercise seems to be another important factor in the relationship between the microbiota, host immunity and host metabolism, with diet playing an important role. Further, intervention-based studies to tease apart this relationship will be important and provide further insights into optimal therapies to influence the gut microbiota and its relationship with health and disease.
Acknowledgments
The authors thank Fiona Crispie and Eva Rosberg-Cody for their high throughput DNA sequencing service, Patricia Egan for her clinical assistance and for facilitating subject recruitment and Irish Centre for High End Computing in particular S Wong for supercomputer access. The authors are grateful to the Irish Rugby Football Union, Charlie Daly, Andrea Doolan, Susan Power and all those people who kindly donated their time, effort and samples to this study.
References
Supplementary materials
Press release
Files in this Data Supplement:
Supplementary Data
This web only file has been produced by the BMJ Publishing Group from an electronic file supplied by the author(s) and has not been edited for content.
Files in this Data Supplement:
- Data supplement 1 - Online supplement
Footnotes
SFC and EFM are joint first authors.
-
Contributors SFC, EFM, OO, EQ, EF, PDC and FS designed the experiment. AH, IBJ, MH, AJL, MOR, RWM and PH collected and analysed the food frequency questionnaire (FFQ). SFC collected and prepared the faecal samples for sequencing. SFC and OO analysed the compositional data. All authors discussed the results. SFC, EFM, OO, PDC and FS wrote the manuscript, which was polished by RPR and PWOT The project was conceived and supervised by PDC, MGM, DMK and FS.
-
Funding Teagasc Walsh Fellowship. This work was supported by a Science Foundation Ireland (SFI) award to the Alimentary Pharmabiotic Centre, grant number 12/RC/2273.
-
Competing interests SFC is funded by the Teagasc Walsh fellowships. Research in the Cotter laboratory is supported by a SFI Principal Investigator award, grant number 11/PI/1137.
-
Ethics approval Cork Clinical Research Ethics Committee.
-
Provenance and peer review Not commissioned; externally peer reviewed.
-
Data sharing statement DNA sequence reads from this study are available from the Sequence Read Archive (accession numbers PRJEB4609).