


Abstract
Gastric cancer is one of the most common malignancies worldwide. Histopathologic studies have identified a sequence of changes in the gastric mucosa that mark the slow progression from normal tissue to carcinoma. Epidemiologic evidence suggests that a diet rich in fresh fruit and vegetables could be a protective factor against this disease. This effect may be mediated through antioxidant vitamins.
A randomized, double-blind chemoprevention trial was conducted among 1980 subjects in Tachira State, Venezuela (whose population is at high risk for gastric cancer), to determine the effect of dietary supplementation with vitamin C, vitamin E, and beta-carotene on the progression and regression of precancerous gastric lesions. Subjects were randomly assigned to receive either a combination of vitamin C (750 mg/day), vitamin E (600 mg/day), and beta-carotene (18 mg/day) or placebo for 3 years. Changes in the gastric mucosa were determined by histologic diagnosis based on five biopsies taken from prespecified areas of the stomach at baseline and annually for 3 years. All biopsies were reviewed by a single expert pathologist. Progression rates (and regression rates) were calculated by comparing the first and last available gastroscopies for each subject and dividing the number of subjects whose diagnoses increased (decreased) in severity by the total follow-up time. Overall rate ratios were calculated by Poisson regression, controlling for baseline diagnosis. All statistical tests were two-sided.
Median plasma vitamin levels were increased in the treatment group between baseline and 1 year after randomization from 0.43 μmol/L (interquartile range [IQR] = 0.26–0.69) to 2.89 μmol/L (IQR = 1.76–4.22) for beta-carotene, from 26.7 μmol/L (IQR = 23.1–31.2) to 54.9 μmol/L (IQR = 42.8–67.6) for alpha-tocopherol, and from 47.70 μmol/L (IQR = 36.9–58.5) to 61.9 μmol/L (IQR = 52.2–72.7) for vitamin C. Overall progression rates per 100 person-years were 74.3 in the placebo group and 67.8 in the group randomly assigned to vitamins. Overall regression rates were 109.4 in the placebo group and 116.5 in the group randomly assigned to vitamins. There was no statistically significant difference in progression rate (rate ratio = 0.92, 95% confidence interval [CI] = 0.74 to 1.15) or regression rate (rate ratio = 1.09, 95% CI = 0.90 to 1.33) between vitamin and placebo groups.
Supplementation with antioxidant micronutrients is not an effective tool for gastric cancer control in this high-risk population. The results of this trial are consistent with previous findings on the lack of effect of nutritional supplementation on precancerous gastric lesions.
Epidemiologic evidence has suggested that a diet rich in fresh fruits and vegetables is protective against gastric cancer.
This was a randomized double-blind chemoprevention trial.
The work suggests that supplementation with antioxidant vitamins is not an effective tool for the control of gastric cancer in a high-risk population.
The factors that account for the association of a diet rich in vegetables and fruit and low rates of gastric cancer seen in epidemiologic studies remain to be identified.
The focus on changes in precancerous lesions in this trial may have introduced some sources of error based on imprecision in histologic diagnosis and loss to follow-up when patients did not return for gastroscopy.
According to the most recent estimates of global cancer incidence, gastric cancer is the fourth most common cancer with 934 000 new cases per year. Incidence and mortality due to gastric cancer are declining worldwide ( 1 ). The wide spatial and temporal variations in incidence and mortality suggest an important role of environmental factors in gastric cancer risk. Epidemiologic studies suggest a predominant role for diet and infection by the bacterium Helicobacter pylori ( 2 , 3 ).
Epidemiologic evidence, mainly from case–control studies, suggests that a diet rich in fresh fruits and vegetables is associated with a lower risk of gastric cancer ( 4 ). This effect may be mediated through vitamins with antioxidant properties, but few trials have been conducted to evaluate the effectiveness of antioxidant vitamins as chemopreventive agents against gastric cancer. A systematic review of intervention trials for cancer prevention that was performed before the commencement of this trial ( 5 ) found only two ongoing chemoprevention trials with precancerous gastric lesions as trial outcomes ( 6 , 7 ).
Histopathologic studies conducted in high-risk populations have identified a sequence of changes in the gastric mucosa that apparently represent a continuum from normal tissue to carcinoma, with intermediate stages of chronic gastritis, atrophy, intestinal metaplasia, and dysplasia that may be diagnosed by taking gastric biopsies ( 8 ). The use of precancerous gastric lesions as an intermediate endpoint, instead of gastric cancer, may allow intervention trials against gastric cancer to be conducted in a shorter time and with a smaller number of subjects.
In this article, we report the results of a randomized trial on the effects of vitamin supplementation on precancerous lesions of the stomach conducted in Tachira State, Venezuela. The incidence rate of gastric cancer in men in Venezuela, age-standardized to the world population is estimated to be 19.2 per 100 000 years ( 1 ). This may be compared with incidence rates of less than 10 per 100 000 years in South Asia, North and East Africa, North America, and Australia and New Zealand ( 1 ). Although there are no regional incidence estimates for Tachira State, it lies in the Andean region of South America, which forms a belt of extremely high gastric cancer incidence, with age-standardized rates of 46.1 in Chile, 37.5 in Peru, 37.8 in Ecuador, and 36.0 in Colombia ( 1 ). Thus, Tachira State is considered to be a high-risk area for gastric cancer.
In the early 1980s, a gastric cancer screening program was set up in Tachira State, based on the Japanese model of photoflouroscopic screening followed by gastroscopy if radiologic abnormalities were detected in the screening ( 9 ). This program was established with the advice of Japanese gastroenterologists and was supported by the Japan International Cooperation Agency from 1983 to 1987. Although an evaluation of this screening program based on a case–control study of gastric cancer mortality found it to be ineffective in reducing gastric cancer mortality ( 9 ), it nevertheless provided infrastructure (particularly the presence of skilled endoscopists) for the randomized trial reported here. The goal of the trial was to determine whether the progression or regression of precancerous gastric lesions would be affected by a 3-year course of dietary supplementation with antioxidant vitamins (beta-carotene, vitamin C, and vitamin E). The initial plan was that dietary vitamin supplementation would be combined with anti– H. pylori treatment. However, anti– H. pylori treatment was dropped from the protocol after completion of two pilot studies, in which three anti– H. pylori treatment regimes were tested separately but none was found to eradicate more than 26% of H. pylori infections ( 10 , 11 ). The design of this trial has been previously described along with a summary of the baseline data ( 11 ).
Methods
Patient Population and Eligibility
Subjects in the trial were participants in the gastric cancer control program of Tachira State, Venezuela, who had been selected for gastroscopy after radiologic abnormalities had been detected by photofluoroscopy. Subjects who were between the ages of 35 and 69 years, in general good health, and permanent residents of Tachira State were eligible for the trial. Potential subjects with a serious illness, including any type of cancer, those whose mental status made long-term adherence to the treatment regimen unlikely and pregnant women were excluded. A full description of the trial and an explanation of the implications of participation were given to eligible participants, and subjects who then signed informed consent forms were included in the trial. Ethical clearance for the study was obtained from the International Agency for Research on Cancer (IARC) Ethical Committee in Lyon, France, and the Cancer Control Center in San Cristobal, Venezuela. The trial protocol is available online as Supplementary Data.
Calculation of Sample Size
The study was designed to have more than 90% power to detect a 30% decrease in the progression rate of precancerous lesions. Sample size calculations for the study were based on the estimated prevalence of precancerous lesions ( 12 ) and their progression and regression rates ( 13 ) in a follow-up study conducted in Colombia (see Tables 1 and 5 , respectively, of these references).
Baseline demographic and clinical characteristics of analyzed subjects at baseline
| Demographic characteristics | Control | Treatment | ||||
|---|---|---|---|---|---|---|
| N | % | N | % | |||
| Age | ||||||
| <40 | 153 | 22 | 145 | 21 | ||
| 40–44 | 147 | 21 | 150 | 22 | ||
| 45–49 | 98 | 14 | 102 | 15 | ||
| 50–54 | 113 | 16 | 109 | 16 | ||
| 55–59 | 96 | 14 | 65 | 10 | ||
| 60–64 | 59 | 8 | 73 | 11 | ||
| ≥65 | 39 | 6 | 34 | 5 | ||
| Sex | ||||||
| Male | 335 | 48 | 319 | 47 | ||
| Female | 370 | 52 | 359 | 53 | ||
| Years of education | ||||||
| <4 | 169 | 24 | 166 | 24 | ||
| 4–6 | 231 | 33 | 244 | 36 | ||
| 7–9 | 106 | 15 | 100 | 15 | ||
| ≥10 | 198 | 28 | 168 | 25 | ||
| Country of origin | ||||||
| Venezuela | 581 | 82 | 562 | 83 | ||
| Other | 124 | 18 | 116 | 17 | ||
| Smoking status | ||||||
| Never | 542 | 77 | 503 | 74 | ||
| Former * | 42 | 6 | 48 | 7 | ||
| Current <10 cigarettes/day | 72 | 10 | 70 | 10 | ||
| Current >10 cigarettes/day | 49 | 7 | 56 | 8 | ||
| Baseline diagnosis † | ||||||
| NAG | 169 | 24 | 158 | 23 | ||
| MAG | 316 | 45 | 301 | 44 | ||
| IM | 208 | 30 | 211 | 31 | ||
| DYS | 12 | 2 | 8 | 1 | ||
Former smokers quit smoking at least 1 year before study entry.
NAG = nonatrophic gastritis; MAG = multifocal atrophic gastritis; IM = intestinal metaplasia; DYS = dysplasia.
Collection of Baseline Data
In addition to undergoing a baseline gastroscopy examination, all participants in the trial completed a questionnaire that was administered by specially trained interviewers. It requested information on sociodemographic and lifestyle variables. Dietary history was assessed by a food-frequency questionnaire on 41 typical local food items. Subjects were also examined by a physician, who took measurements of height and weight as well as details of medical history. Fifteen milliliters of heparinized blood and 10 mL of urine were also taken. Cross-sectional analyses of this baseline data have been previously reported ( 14 – 18 ).
Measurement of Plasma Vitamin Levels
Plasma levels of vitamin C, beta-carotene, and alpha-tocopherol were measured at the Vitamin Research Laboratories of Hoffmann-La Roche (Basel, Switzerland) as previously described ( 16 ). Briefly, when blood samples were taken, they were centrifuged immediately to obtain plasma. For carotenoid analysis, 1 mL of plasma was frozen immediately and stored at 20 °C. For vitamin C analysis, 0.5 mL of plasma was stabilized with 4.5 mL of a 5% meta -phosphoric acid solution before storage at −20 °C. Vitamin C was assessed as descibed by Brubacher and Vuilleumier ( 19 ). After one single extraction of the plasma, beta-carotene and alpha-tocopherol were measured with other carotenoids simultaneously on a reverse high-performance liquid chromatography phase system, as described by Hess et al. ( 20 ).
Interventions
Subjects were randomly assigned to receive either antioxidant vitamins or placebo for 3 years and were blinded to the treatment allocation. The treatment was taken in the form of three capsules per day, one with each of the three main meals. Each capsule contained 250 mg vitamin C, 200 mg vitamin E, and 6 mg of beta-carotene, for a daily dose of 750 mg of vitamin C (12.5 times the recommended daily allowance), 600 mg vitamin E (20 times the recommended daily allowance), and 18 mg beta-carotene (considered the maximum dose if carotenoderma is to be avoided). This daily regimen has been demonstrated to increase levels of vitamin C, beta-carotene, and alpha-tocopherol in plasma ( 21 ). The placebo was prepared in the form of capsules identical to those containing the vitamins. Both vitamin capsules and placebo were supplied by Hoffman-La Roche. The capsules were supplied to subjects on a monthly basis for the first 6 months. Then capsules were supplied every 3 months to subjects with good compliance, defined as less than 10% of capsules returned unused, at the end of the month. Subjects with poor compliance continued to receive capsules monthly. The random allocation sequence to determine treatment group was generated by Hoffmann-La Roche, using random permuted blocks of size eight. All histologic diagnoses and assays on biologic samples were conducted blind to the treatment allocation. During the trial, the central study database at IARC did not contain data on treatment allocation. The data were added to the database after the trial had been completed.
Follow-up
When subjects returned to the study center for their replacement capsules, they were asked whether they had experienced 1) skin yellowing, 2) weight gain or loss, 3) allergic reaction, or 4) any other side effects. These side effects were recorded and then evaluated by the coordinating physician to determine if treatment should continue. Subjects who did not return for their supply of capsules were contacted first by telephone, then visited at home by social workers who enquired about the reasons for nonattendance, encouraged continuing participation, and provided the next month's supply of capsules. At 12 and 24 months after initiation of treatment, all subjects underwent a follow-up physical examination and gastroscopy and provided additional blood samples. At the end of the 3-year treatment period, gastroscopy and all other procedures conducted at baseline were repeated.
Outcomes
The primary outcome of the trial was the progression and regression of precancerous lesions of the stomach, as determined by histologic findings. Seven biopsies were taken from each subject at each gastroscopy: five were used for histologic diagnosis and two were frozen for use in investigational analyses. The five biopsies used for histologic diagnosis were taken from the following locations: the lesser curvature of the antrum approximately 1 cm from the pylorus, the greater curvature of the antrum approximately 1 cm above the pylorus, the lesser curvature of the antrum immediately below the incisura, the greater curvature of the antrum approximately 1–2 cm below the antrum–corpus junction, and the middle corpus approximately 2 cm from the lesser curvature.
Histologic diagnosis during the course of the trial was done by three local pathologists (GL, E. Carillo, SP, all blinded to the treatment allocation) after training sessions with consultant pathologists. For the purposes of evaluating treatment effect, it was decided to conduct a standardized review of the first and last available biopsies for all subjects with more than one gastroscopy by one of the three local pathologists (GL) after a 1-month training period with an expert pathologist (JCB). This review was also conducted blind to the treatment status of the patient.
Pathologic diagnoses were performed according to the updated Sydney System for classification and grading of gastritis ( 22 ). Each biopsy was classified as one of the following: normal mucosa, nonatrophic gastritis (NAG), nonmetaplastic multifocal atrophic gastritis (MAG), intestinal metaplasia (IM), or dysplasia (DYS). The most severe diagnosis among any of the biopsies was taken as the overall diagnosis for each subject.
Gastric biopies were also stained with Giemsa for the detection of H. pylori . Presence of H. pylori was evaluated on a scale from 0 to 3 (0, none; 1, difficult to find; 2, easy to find; and 3, abundant). For each subject, two summary scores were calculated, one based on the most severe biopsy and the other based on the average score over all biopsies.
Statistical Analysis
The statistical analysis performed was the preplanned analysis that was decided upon before breaking the code. This analysis was based on intention to treat. It used only the histologic diagnosis resulting from the standardized review. For the purpose of the analysis, the histologic diagnoses were grouped into four categories: 1) normal mucosa and NAG, 2) MAG, 3) IM, and 4) DYS. The decision to group normal mucosa and NAG together was based on the low probability that these lesions would progress to cancer during the course of the study and findings of a reliability substudy that indicated low reproducibility of histologic diagnoses of low-grade lesions ( 23 ).
Progression was defined as an increase in the severity of the lesions to the extent that there was a change in diagnosis category. The progression rates and the rate ratio between vitamin and placebo groups were estimated within strata defined by baseline diagnosis (categories 1, 2, and 3). A Poisson regression model was used to estimate the overall rate ratio between vitamin and placebo groups, controlling for baseline diagnosis. Heterogeneity of treatment effect by baseline diagnosis was evaluated by testing for interaction between treatment and baseline diagnosis. The same procedures were used for regression rates using baseline diagnostic categories 2, 3, and 4, with regression defined as a decrease in the severity of the lesions to the extent that there was a change in category.
Progression and regression rates were calculated based on the first and last available gastroscopy for each subject. Therefore, subjects who withdrew from the study before returning for at least one follow-up gastroscopy were censored. Subjects who withdrew after at least one follow-up gastroscopy but before completing the full trial protocol were included in the analysis but contributed only the follow-up time between study entry and the last available gastroscopy.
Subgroup analyses were conducted by testing for an interaction between the treatment allocation and the variable defining the subgroups. The null hypothesis under these tests is that of the main analysis, i.e., that the treatment effect is the same across subgroups. Unless otherwise stated, all statistical tests use the Wald approximation to the likelihood ratio. All statistical tests were two-sided.
Results
Between May 1992 and February 1995, 1980 subjects were recruited into the trial, of whom 1383 were included in the this analysis. The participant flow is detailed in Fig. 1 . The extent of censoring was similar in the vitamin and placebo groups ( P = .29 for difference of two proportions). In September 1996, an interim analysis was conducted following the publication of preliminary results from the Alpha-tocopherol, Beta-carotene (ATBC) trial, which showed an adverse effect of treatment on lung cancer risk ( 24 ), and the subsequent decision by the investigators of the Beta Carotene and Retinol Efficacy Trial to discontinue the intervention ( 25 ). The interim analysis was based on the histologic diagnoses of the first 220 subjects to complete the study and a review of all withdrawals and all deaths that had occurred among study participants. No adverse effect of vitamin supplementation was found. However, the IARC Ethical Committee requested that all current smokers and ex-smokers who had smoked within the last 10 years who were receiving vitamins be given placebo instead of vitamin treatment and that advice on quitting smoking should be reinforced for all smokers. This unplanned protocol change was ignored by the intention-to-treat analysis, so smokers on active treatment who were switched to placebo were still considered to be in the vitamin treatment group.
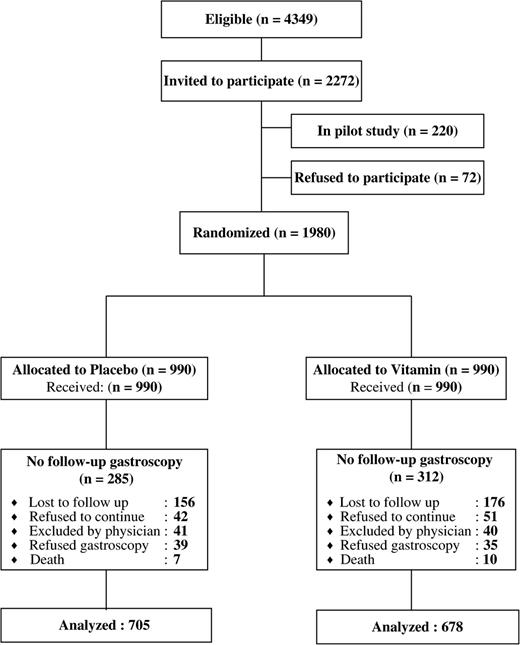
Flow of study participants.
Baseline demographic and clinical characteristics of each group are shown in Table 1 . The vitamin and placebo groups were balanced with respect to age, sex, education, country of origin, smoking status and history, and baseline diagnosis. In a previous cross-sectional analysis of the baseline data, refrigerator use and intake of fruits and starchy vegetables had been identified as potential confounders ( 18 ). These were also found to be balanced with respect to treatment (data not shown).
Figure 2 shows plasma vitamin levels for the three vitamins by treatment group, at baseline and at 1 and 2 years after randomization. In the treatment group, the median beta-carotene level was 0.43 mmol/L (interquartile range [IQR] = 0.26–0.69) at baseline and it increased to 2.89 mmol/L (IQR = 1.76–4.22) at 1 year and 2.53 mmol/L (IQR = 1.31–4.14) at 2 years. The median alpha-tocopherol level in the treatment group was 26.7 mmol/L (IQR = 23.1–31.2) at baseline and increased to 54.9 mmol/L (IQR = 42.8–67.6) at 1 year and 54.4 mmol/L (IQR = 40.9–69.2) at 2 years. Thus, there were clear increases in beta-carotene and vitamin E levels in the treated group beyond the levels observed at baseline. In the placebo group, by contrast, no changes were observed. For vitamin C, the median baseline level in the treatment group was 47.7 mmol/L (IQR = 36.9–58.5) at baseline, 61.9 mmol/L (IQR = 52.2–72.7) at 1 year, and 54.4 mmol/L (IQR = 40.9–69.2) at 2 years. Thus, the difference in vitamin C levels was less marked, and the interquartile ranges of plasma vitamin C levels before and after treatment were overlapping. Vitamin C levels in the placebo group were 46.8 mmol/L (IQR = 36.3–57.9) at baseline, 44.3 mmol/L (IQR = 31.2–55.7) at 1 year, and 35.2 mmol/L (IQR = 21.6–47.1) at 2 years. A small decline in vitamin C levels occurred between years 1 and 2 in both the control and treatment groups. Since this decline was observed in both vitamin and placebo groups, and was not seen for the other vitamins, it was not an effect of reduced compliance but may have been caused by sample degradation during storage or transport. Excellent compliance was indicated by pill counts when subjects returned for their vitamin pills: 91% of all containers were returned with less than 10% of pills.
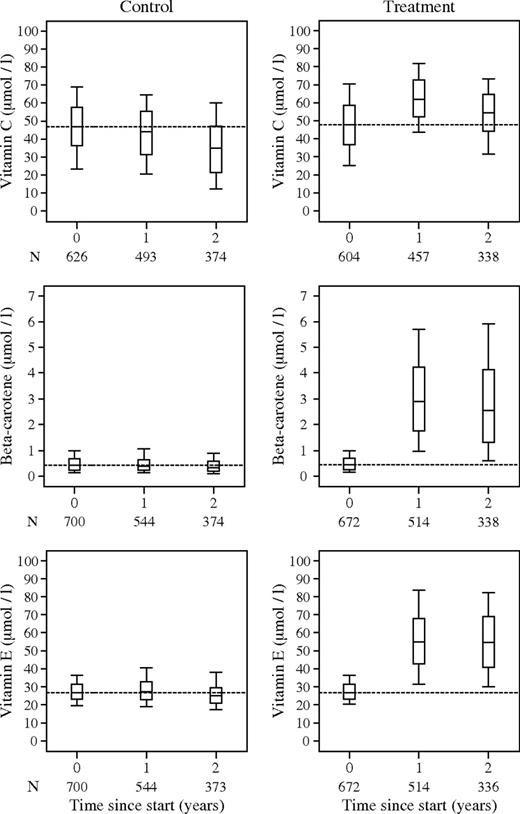
Box and whisker plots of concentrations of vitamin C, beta-carotene, and vitamin E in plasma at baseline and at 1 and 2 years after randomization. The top and bottom of the boxes indicate the upper and lower quartiles, with the horizontal line indicating the median. The whiskers show the maximum and minimum observed values.
Changes in the prevalence of precancerous lesions between the beginning and end of the trial were assessed by determining, for each set of subjects receiving a given initial diagnosis, the distribution of subjects receiving the four possible final diagnoses ( Table 2 ). The number of subjects with superficial gastritis increased from 327 at baseline to 452 at final diagnosis, and the number of subjects with dysplasia also increased from 20 at baseline to 45 at final diagnosis. There was also a clear reduction in the number of subjects with atrophy from 617 at baseline to 455 at final diagnosis. Thus, in the course of the trial there was an increase in the frequency of diagnoses of both extremes of disease. However, overall, there was no strong evidence of net progression or regression.
Initial versus final diagnosis *
| Final diagnosis | |||||||||
|---|---|---|---|---|---|---|---|---|---|
| Initial diagnosis | NAG | MAG | IM | DYS | All | ||||
| Overall | |||||||||
| NAG | 152 | 122 | 51 | 2 | 327 (24%) | ||||
| MAG | 248 | 249 | 114 | 6 | 617 (45%) | ||||
| IM | 52 | 83 | 252 | 32 | 419 (30%) | ||||
| DYS | 0 | 1 | 14 | 5 | 20 (1%) | ||||
| All | 452 (32.7%) | 455 (32.9%) | 431 (31.2%) | 45 (3.25%) | 1383 | ||||
| Control | |||||||||
| NAG | 77 | 63 | 28 | 1 | 169 (24%) | ||||
| MAG | 125 | 124 | 65 | 2 | 316 (45%) | ||||
| IM | 28 | 36 | 128 | 16 | 208 (30% | ||||
| DYS | 0 | 0 | 9 | 3 | 12 (2%) | ||||
| All | 230 (32.6%) | 223 (31.6%) | 230 (32.6%) | 22 (3.12%) | 705 | ||||
| Treatment | |||||||||
| NAG | 75 | 59 | 23 | 1 | 158 (23%) | ||||
| MAG | 123 | 125 | 49 | 4 | 301 (44%) | ||||
| IM | 24 | 47 | 124 | 16 | 211 (31%) | ||||
| DYS | 0 | 1 | 5 | 2 | 8 (1%) | ||||
| All | 222 (32.7%) | 232 (34.2%) | 201 (29.7%) | 23 (3.39%) | 678 | ||||
NAG = nonatrophic gastritis; MAG = multifocal atrophic gastritis; IM = intestinal metaplasia; DYS = dysplasia.
We calculated the progression rate for each category of diagnosis according to treatment allocation ( Table 3 ) and rate ratios between the vitamin and placebo groups. Overall progression rates per 100 person-years were 74.3 in the placebo group and 67.8 in the group allocated to vitamins. The rate ratio for progression was 0.95 (95% CI = 0.70 to 1.28) in subjects with NAG, 0.84 (95% CI = 0.59 to 1.21) in subjects with MAG, and 1.02 (95% CI = 0.51 to 2.04) in subjects with IM. The overall rate ratio for progression, controlling for initial diagnosis by Poisson regression, was 0.92 (95% CI = 0.74 to 1.15). There was no evidence of heterogeneity in the rate ratio by initial diagnosis ( P for interaction = .95). Regression rates in the two treatment groups were analyzed in a similar fashion ( Table 4 ). Overall regression rates per 100 person-years were 109.4 in the placebo group and 116.5 in the group allocated to vitamins. The rate ratio for regression was 1.05 (95% CI = 0.81 to 1.35) in subjects with MAG, 1.15 (95% CI = 0.82 to 1.61) in subjects with IM, and 1.09 (95% CI = 0.36 to 3.34) in subjects with DYS. The regression rate was thus slightly higher in the treatment group in all subgroups of gastric lesions. The overall rate ratio, controlling for initial diagnosis, was 1.08 (95% CI = 0.89 to 1.32). There was no evidence of heterogeneity by initial diagnosis ( P for interaction = .98).
Progression of precancerous lesions *
| Initial diagnosis | N | Person-years | Progressions | Rate per 1000 | RR | 95% CI |
|---|---|---|---|---|---|---|
| NAG | ||||||
| Control group | 169 | 578.0 | 92 | 159.2 | 1.00 | – |
| Treatment group | 158 | 542.9 | 83 | 152.9 | 0.95 | 0.70 to 1.28 |
| MAG | ||||||
| Control group | 316 | 1081.8 | 67 | 61.9 | 1.00 | – |
| Treatment group | 301 | 1015.1 | 53 | 52.2 | 0.84 | 0.59 to 1.21 |
| IM | ||||||
| Control group | 208 | 695.9 | 16 | 23.0 | 1.00 | – |
| Treatment group | 211 | 682.4 | 16 | 23.4 | 1.02 | 0.51 to 2.04 |
| All † | ||||||
| Control group | 693 | 2356 | 175 | 74.3 | 1.00 | – |
| Treatment group | 670 | 2240 | 152 | 67.8 | 0.92 | 0.74 to 1.14 |
RR = rate ratio; CI = confidence interval; NAG = nonatrophic gastritis; MAG = multifocal atrophic gastritis; IM = intestinal metaplasia.
Controlling for initial diagnosis.
Regression of precancerous lesions *
| Initial diagnosis | N | Person-years | Regressions | Rate per 1000 | RR | 95% CI |
|---|---|---|---|---|---|---|
| MAG | ||||||
| Control group | 316 | 1081.8 | 125 | 115.5 | 1.00 | – |
| Treatment group | 301 | 1015.1 | 123 | 121.2 | 1.05 | 0.81 to 1.35 |
| IM | ||||||
| Control group | 208 | 695.9 | 64 | 92.0 | 1.00 | – |
| Treatment group | 211 | 682.4 | 71 | 104.0 | 1.15 | 0.82 to 1.61 |
| DYS | ||||||
| Control group | 12 | 32.44 | 9 | 277.4 | 1.00 | – |
| Treatment group | 8 | 18.55 | 6 | 323.4 | 1.09 | 0.36 to 3.34 |
| All † | ||||||
| Control group | 536 | 1810.2 | 198 | 109.4 | 1.00 | – |
| Treatment group | 520 | 1716.0 | 200 | 116.5 | 1.08 | 0.89 to 1.32 |
RR = rate ratio; CI = confidence interval; MAG = multifocal atrophic gastritis; IM = intestinal metaplasia; DYS = dysplasia.
Controlling for initial diagnosis.
As a secondary endpoint, we considered degree of H. pylori infection. Due to fading of the Giemsa stain, the pathology review did not produce a usable H. pylori score for most subjects. Hence, the H. pylori scores are based on the original diagnosis by the three local pathologists. The H. pylori diagnosis was determined by taking the most severe score over all biopsies from the same subject. There was a net decrease in the most severe H. pylori score from baseline to final gastroscopy ( P <.001 by McNemar's test) in both placebo and vitamin groups. Differences in H. pylori infection were also compared using an average score over all biopsies. The placebo and vitamin groups were balanced at baseline with average scores of 1.58 (95% CI = 1.53 to 1.63) and 1.54 (95% CI = 1.50 to 1.60), respectively ( P = .36 for difference). At exit, average H. pylori scores were reduced to 1.38 (95% CI = 1.32 to 1.43) in the placebo group and 1.33 (95% CI = 1.28 to 1.39) in the vitamin group, but still balanced across the groups ( P = .22, by paired t test). This balance persisted after adjusting for the score at baseline ( P = .37).
Table 5 details total dropout during the course of the study in terms of reasons for withdrawal. Of the subjects who dropped out (636, 299 in the control arm and 336 in the treatment arm), 53 subjects in the placebo group and 60 subjects in the vitamin group were included in the this analysis because they returned for a follow-up gastroscopy before dropping out and therefore provided data on changes in the gastric mucosa during part of the follow-up. The number of subjects who dropped out was slightly higher in the vitamin group than in the placebo group, but the difference was not statistically significant ( P = .14, for difference of two proportions). The most common reason for dropout from the study (accounting for 189 and 209 in the vitamin and placebo groups, respectively) was loss to follow-up. These subjects could not be traced by the social workers at their given address.
Withdrawals from the study during follow-up
| Reasons | Placebo | Vitamin |
|---|---|---|
| Death | 11 | 16 |
| Refusal | 51 | 60 |
| Lost to follow-up | 189 | 209 |
| Exclusions by coordinating physician | ||
| Gastric cancer | 1 | 3 |
| Other cancer | 1 | 0 |
| Other digestive disease | 1 | 2 |
| Cardiovascular disease | 0 | 1 |
| Allergic reaction | 5 | 5 |
| Side effect of treatment | 28 | 25 |
| Carotenoderma | 0 | 1 |
| Weight gain | 3 | 3 |
| Weight loss | 2 | 0 |
| Other | 7 | 12 |
| Total | 299 | 337 |
Two post hoc subgroup analyses—on smokers and subjects with low plasma vitamin levels at baseline—were conducted. The first group was of interest because of the possibility that beta-carotene supplementation may be harmful in smokers. The decision to cease active treatment in current and former smokers was designed to attenuate such a subgroup effect if it existed. The second group would be of interest if vitamin supplementation was only effective in subjects with a low vitamin intake. Among current smokers and recent (within <10 years) ex-smokers, the rate ratio for progression (treatment versus placebo) was 1.08 (95% CI = 0.70 to 1.67). Among never smokers and long-term ( 3 10 years) ex-smokers, the rate ratio was 0.86 (95% CI = 0.67 to 1.11). The difference in the rate ratios by smoking status was not statistically significant ( P = .38 for interaction). The corresponding rate ratios for regression were 1.28 (95% CI = 0.86 to 1.92) for current and recent smokers and 1.01 (95% CI = 0.81 to 1.27) for never smokers and long-term ex-smokers. Again, there was no statistically significant difference in the rate ratios ( P = .48) by smoking status. For assessment of the effect of baseline plasma vitamin levels on response to treatment, subjects in the lowest tertile group for each vitamin were compared with the rest. There was no statistically significant difference in progression rates between subjects with low plasma vitamin levels and the rest ( P = .56 for vitamin C; P = .99 for beta-carotene; P = .58 for vitamin E). Nor were there any statistically significant differences in regression rates ( P = .18 for vitamin C; P = .36 for beta-carotene; P = .59 for vitamin E). Hence, there was no evidence that the treatment effect differs by smoking status or levels of these vitamins in plasma.
Logistic regression analyses were conducted to see if there were systematic differences between subjects who were included in the analysis and those who were censored. The outcome in these analyses was inclusion in the analysis versus censoring, and the predictor variables were the set of potential confounders that were tested at baseline to check that the treatment and placebo groups were balanced. Compared with those who were censored, subjects included in this analysis were older (odds ratio [OR] = 1.57 for being 40 years of age or older, 95% CI = 1.27 to 1.95), were less likely to be born outside of Venezuela (OR = 0.73, 95% CI = 0.57 to 0.92), had higher socioeconomic status as measured by education level (OR = 1.56 for having R 3 7 years of education, 95% CI = 1.06 to 1.56) and number of years with a refrigerator in the home (OR = 1.63 for >30 years versus <10 years, 95% CI = 1.16 to 2.30), and were less likely to be smokers (OR = 0.71, 95% CI = 0.58 to 0.88). There were no statistically significant differences according to sex or consumption of fruits or starchy vegetables.
Discussion
No statistically significant association was found between supplementation with antioxidant vitamins (beta-carotene, vitamin C, vitamin E) for a period of 3 years and progression or regression of precancerous gastric lesions. The data were inconsistent with a 25% decrease in progression rates or a 30% increase in regression rates due to vitamin supplementation.
Three chemoprevention trials on the effects of antioxidant vitamin supplementation have reported results on gastric cancer incidence. The first trial was conducted in the general adult population of Linxian, China, an area with a high incidence of esophageal and gastric cardia cancer. Four different interventions were tested in a one-half replicate of a 2 4 factorial design : retinol and zinc; riboflavin and niacin; vitamin C and molybdenum; and beta-carotene, vitamin E, and selenium. During the 5.25-year follow-up period, a statistically significant reduction in gastric cancer mortality (risk ratio, treatment versus control = 0.79; 95% CI = 0.64 to 0.99) was observed in those receiving beta-carotene, vitamin E, and selenium. Reductions in total mortality and total cancer mortality were also observed in subjects receiving this treatment ( 26 ). The second trial, for which gastric cancer incidence was a secondary endpoint, was the ATBC study ( 27 ) in which alpha-tocopherol and beta-carotene supplementation, or placebo, was given, in a 2 × 2 factorial design, to a population of 29 133 male smokers aged 50–69 years. This study was designed as a study of lung cancer incidence, but 126 cases of gastric cancer were identified during the 6-year follow-up period. A modest, but not statistically significant, increase in gastric cancer incidence was observed in subjects treated with alpha-tocopherol (risk ratio = 1.21, 95% CI = 0.85 to 1.74) and beta-carotene (risk ratio = 1.26, 95% CI = 0.88 to 1.80) ( 28 ). In both the Linxian trial and the ATBC study, gastroscopic surveys were conducted at the end of follow-up to examine the prevalence of precancerous lesions. Neither trial found a statistically significant difference between treatment groups in prevalence ( 29 , 30 ). The third trial was conducted among 22 071 male physicians in the United States who were randomly assigned to beta-carotene supplementation or placebo for 12 years. Nineteen subjects in the beta-carotene group and 21 subjects in the placebo group developed gastric cancer ( 31 ).
In addition to the trials in which gastric cancer was an endpoint, two chemoprevention trials on precancerous lesions of the stomach have been conducted, one in Colombia ( 7 ) and one in the Shandong province of China ( 32 ). Unlike the trials described above, these trials were specifically designed to look at precancerous lesions and included a gastroscopy at the beginning and the end of the follow-up period.
The trial in Colombia compared supplementation with vitamin C, beta-carotene, and anti– H. pylori treatment in a 2 3 factorial design. With 976 subjects randomly assigned (of whom 631 completed follow-up), this trial was smaller than the one reported here, but the follow-up period of 6 years was longer, and the doses of vitamin C and beta-carotene were both higher (30 mg/day versus 18 mg/day for beta-carotene and 2 g/day versus 750 mg/day for vitamin C in that trial and the one reported here, respectively). All seven groups receiving active treatment showed similarly high regression of precancerous lesions (19%–29% regression) compared with the placebo group (it showed 7% regression), but the combination of more than one treatment was not associated with a statistically significant increase in regression rates compared to any single treatment. After 12 years of follow-up, and 6 years after antioxidant treatment was concluded, an additional gastroscopy was conducted, and the treatment allocation was reevaluated using a histopathology score as the outcome. Subjects allocated to anti– H. pylori treatment had improved histopathology scores relative to baseline, but no beneficial effect of antioxidants was found ( 33 ).
The trial in Shandong province, China, also used a 2 3 factorial design comparing H. pylori eradication, garlic supplementation for 7.3 years, and vitamin supplementation (vitamin C, vitamin E, and selenium) for 7.3 years in 3365 subjects. In follow-up gastroscopic surveys conducted after 5 years and 9 years, no statistically significant favorable effects were seen for either of the nutritional supplementation (vitamins and garlic oil), but H. pylori treatment resulted in a statistically significant decrease in prevalence of lesions diagnosed as severe chronic atrophic gastritis or worse.
The main motivation for studying precancerous lesions instead of gastric cancer incidence is to reduce the sample size and the follow-up period that is required. However, there are two potential disadvantages to this approach. The first is the possible imprecision of the histologic diagnosis due to poor inter- and intrarater reliability and to random variation in the location of the biopsy. Imprecision in histologic diagnosis was minimized in this study by taking five biopsies from prespecified regions in the stomach and by basing the initial and final diagnosis on a review by a single pathologist. However, one component of error that cannot be controlled is the degree to which the biopsy is representative of the extent of disease in the gastric mucosa. Because multi- focal atrophic gastritis, intestinal metaplasia, and dysplasia are multifocal lesions, a certain degree of random variation in the location of the biopsy will occur. Random error in histologic diagnosis would have the effect of increasing the apparent rates of progression and regression and decreasing the discernible effect of treatment.
A second problem with using precancerous lesions as an endpoint is that it requires a gastroscopy. Overall, 30% of the participants did not contribute to this analysis as they had no follow-up gastroscopy. The profile of the censored subjects, who were younger, had lower socioeconomic status, and were less likely to be born in Venezuela, suggests that migration for economic reasons to neighboring Colombia contributed to the overall loss to follow-up, despite the requirement that participants be permanent residents of Tachira State.
A further limitation of this study, in comparison to the trial in Colombia, is that it did not include anti– H. pylori treatment. Although this treatment was in the original protocol, it was dropped after unsuccessful testing in the pilot phase ( 10 , 11 ). Therefore, we were unable to investigate the effects of anti– H. pylori treatment on the progression and regression of precancerous lesions.
Randomized trials of H. pylori eradication [reviewed by Correa ( 34 )] include two other trials with long-term follow-up, both in high-risk areas of China. The first one, in Fujian Province ( 35 ), used gastric cancer incidence as an outcome and did not find a strong effect of H. pylori eradication on gastric cancer incidence: after 7.5 years, seven cases of cancer occurred in the treated group and 11 cases in the placebo group. In the subgroup of subjects without precancerous lesions at the start of the trial, none of those receiving the anti– H. pylori treatment developed cancer, and six subjects in the placebo group did. This finding of a positive effect of H. pylori eradication in a subgroup of subjects without precancerous lesions raises the possibility that the beneficial effect of eradication is confined to the earlier phases of the process. However, this result must be interpreted with caution because the findings of post hoc subgroup analyses generally have poor reproducibility. The second study, in Shandong province, used a gastroscopy at 1 and 5 years to measure precancerous endpoints. After 5 years of follow-up, the risk of progression of intestinal metaplasia was reduced to a statistically significant extent in the group randomly assigned to anti– H. pylori treatment (OR = 0.63, 95% CI = 0.43 to 0.93) ( 36 ). Thus, the balance of the available evidence suggests that H. pylori eradication may decrease the progression of precancerous lesions.
This study was conducted in a population at high risk for gastric cancer, and, in particular, with a high prevalence of infection with H. pylori . The results of this study can therefore be generalized to those populations in low- and medium-resource countries where gastric cancer is still fairly common. They may not necessarily apply to populations with low gastric cancer risk or low H. pylori prevalence or where the intake of antioxidants through diet and supplements is higher.
The results of this study address two questions: Do antioxidant vitamins interfere with the progression of precancerous lesions? Is large-scale chemoprevention with antioxidant vitamins a useful strategy for gastric cancer control? We found no statistically significant effect of antioxidant vitamins on gastric precancerous lesions. If there is a beneficial effect, it is small and not consistent with a 30% benefit in progression/regression. There was also no evidence of a strong harmful effect of treatment on progression and regression rates. The null result from this study does not contradict the evidence from observational studies that a diet rich in fresh fruits and vegetables is protective against gastric cancer because we do not know whether the protective agents in such a diet have been correctly identified and used as treatment in this trial ( 37 ). More importantly, it is not certain that a short, intensive period of treatment in middle age can compensate for a high-risk diet that is lifelong ( 38 ).
Any intervention against gastric cancer should be viewed in the context of the global decline in gastric cancer incidence and mortality. Data from the World Health Organization mortality database suggest that gastric cancer mortality is declining at the rate of 2%–3% per year in many countries. In Venezuela, between the years 1970 and 1994, the age-standardized gastric cancer mortality rate per 100 000 person-years decreased from 36.2 to 16.8 in men and from 16.4 to 9.7 in women. The reasons for the widespread decline are not known, but they may include improvements in diet, food storage, and a decline in the prevalence of H. pylori infection. An intervention that accelerated this decline would still have an important impact on public health since gastric cancer remains one of the most common cancers worldwide. However, the absence of any strong benefit suggested by this study suggests that vitamin supplementation would not have a major impact on the existing secular trends.
This study was supported by European Community contract CT90-0555. The study sponsor had no role in the design of the study; the collection, analysis, and interpretation of the data; the writing of the manuscript; or the decision to publish.
The authors wish to thank P. Correa and I. Filipe for their assistance in training the pathologists in this study and the Social Work Team of the “Centro de Control de Cáncer Gastrointestinal Dr Luis Anderson” for their help in carrying out the study.
This paper is dedicated to the memory of Julio Torrado, a Spanish pathologist and collaborator on this project.
References
Parkin DM, Bray F, Ferlay J, Pisani P. Global cancer statistics,
IARC. Monographs on the evaluation of carcinogenic risks to humans. Volume 61: Schistosomes, liver flukes and helicobacter pylori. Lyon (France): International Agency for Research on Cancer;
Plummer M, Franceschi S, Muñoz N. Epidemiology of gastric cancer. In: Mechanisms of carcinogenesis: contributions of molecular epidemiology. IARC Scientific Publications No. 157. Lyon (France): IARC Press;
Riboli E, Norat T. Epidemiologic evidence of the protective effect of fruit and vegetables on cancer risk.
Buiatti E. Intervention trials of cancer prevention: results and new research programmes. IARC Technical Report No. 18. Lyon (France): International Agency for Research on Cancer;
Correa P, Fontham ET, Bravo JC, Bravo LE, Ruiz B, Zarama G, et al. Chemoprevention of gastric dysplasia: randomized trial of antioxidant supplements and anti-helicobacter pylori therapy.
Correa P. Human gastric carcinogenesis: a multistep and multifactorial process—First American Cancer Society Award Lecture on Cancer Epidemiology and Prevention.
Pisani P, Oliver WE, Parkin DM, Alvarez N, Vivas J. Case-control study of gastric cancer screening in Venezuela.
Buiatti E, Muñoz N, Vivas J, Cano E, Peraza S, Carillo E, et al. Difficulty in eradicating Helicobacter pylori in a population at high risk for stomach cancer in Venezuela.
Muñoz N, Vivas J, Buiatti E, Kato I, Oliver W. Chemoprevention trial on precancerous lesions of the stomach in Venezuela: summary of study design and baseline data. In: Stweart BW, McGregor D, Kleihues P, editors. Principles of chemoprevention. IARC Scientific Publication No. 139. Lyon (France): International Agency for Research on Cancer;
Correa P, Haenszel W, Cuello C, Zavala D, Fontham E, Zarama G, et al. Gastric precancerous process in a high risk population: cross-sectional studies.
Correa P, Haenszel W, Cuello C, Zavala D, Fontham E, Zarama G, et al. Gastric precancerous process in a high risk population: cohort follow-up.
Kato I, Miki K, Muñoz N, Vivas JH, Lopez G, Peraza S, et al. Determinants of plasma pepsinogen levels in a population at high risk for stomach cancer in Venezuela.
Muñoz N, Kato I, Peraza S, Lopez G, Carrillo E, Ramirez H, et al. Prevalence of precancerous lesions of the stomach in Venezuela.
Buiatti E, Muñoz N, Kato I, Vivas J, Muggli R, Plummer M, et al. Determinants of plasma anti-oxidant vitamin levels in a population at high risk for stomach cancer.
Torrado J, Plummer M, Vivas J, Garay J, Lopez G, Peraza S, et al. Lewis antigen alterations in a population at high risk of stomach cancer.
Kato I, Vivas J, Plummer M, Lopez G, Peraza S, Castro D, et al. Environmental factors in Helicobacter pylori-related gastric precancerous lesions in Venezuela.
Brubacher G, Vuilleumier JP, Vitamin C. In: Curtius HC, Roth M, editors. Clinical biochemistry principles and methods. New York: de Gruyter;
Hess D, Keller HE, Oberlin B, Bonfanti R, Schuep W. Simultaneous determination of retinol, tocopherols, carotenes and lycopene in plasma by means of high-performance liquid chromatography on reversed phase.
de Sanjosé S, Muñoz N, Sobala G, Vivas J, Peraza S, Cano E, et al. Antioxidants, Helicobacter pylori and stomach cancer in Venezuela.
Dixon MF, Genta RM, Yardley JH, Correa P. Classification and grading of gastritis. The updated Sydney System. International Workshop on the Histopathology of Gastritis, Houston
Plummer M, Buiatti E, Lopez G, Peraza S, Vivas J, Oliver W, et al. Histological diagnosis of precancerous lesions of the stomach: a reliability study.
The Alpha-Tocopherol Beta Carotene Cancer Prevention Study Group. The effect of vitamin E and beta carotene on the incidence of lung cancer and other cancers in male smokers. The Alpha-Tocopherol, Beta Carotene Cancer Prevention Study Group.
Bowen DJ, Thornquist M, Anderson K, Barnett M, Powell C, Goodman G, et al. Stopping the active intervention: CARET.
Blot WJ, Li JY, Taylor PR, Guo W, Dawsey S, Wang GQ, et al. Nutrition intervention trials in Linxian, China: supplementation with specific vitamin/mineral combinations, cancer incidence, and disease-specific mortality in the general population.
Albanes D, Heinonen OP, Huttunen JK, Taylor PR, Virtamo J, Edwards BK, et al. Effects of alpha-tocopherol and beta-carotene supplements on cancer incidence in the Alpha-Tocopherol Beta-Carotene Cancer Prevention Study.
Malila N, Taylor PR, Virtanen MJ, Korhonen P, Huttunen JK, Albanes D, et al. Effects of alpha-tocopherol and beta-carotene supplementation on gastric cancer incidence in male smokers (ATBC Study, Finland).
Varis K, Taylor PR, Sipponen P, Samloff IM, Heinonen OP, Albanes D, et al. Gastric cancer and premalignant lesions in atrophic gastritis: a controlled trial on the effect of supplementation with alpha-tocopherol and beta-carotene. The Helsinki Gastritis Study Group.
Wang GQ, Dawsey SM, Li JY, Taylor PR, Li B, Blot WJ, et al. Effects of vitamin/mineral supplementation on the prevalence of histological dysplasia and early cancer of the esophagus and stomach: results from the General Population Trial in Linxian, China.
Hennekens CH, Buring JE, Manson JE, Stampfer M, Rosner B, Cook NR, et al. Lack of effect of long-term supplementation with beta carotene on the incidence of malignant neoplasms and cardiovascular disease.
You WC, Brown LM, Zhang L, Li JY, Jin ML, Chang YS, et al. Randomized double-blind factorial trial of three treatments to reduce the prevalence of precancerous gastric lesions.
Mera R, Fontham ET, Bravo LE, Bravo JC, Piazuelo MB, Camargo MC, et al. Long term follow up of patients treated for Helicobacter pylori infection.
Wong BC, Lam SK, Wong WM, Chen JS, Zheng TT, Feng RE, et al. Helicobacter pylori eradication to prevent gastric cancer in a high-risk region of China: a randomized controlled trial.
Leung WK, Lin SR, Ching JY, To KF, Ng EK, Chan FK, et al. Factors predicting progression of gastric intestinal metaplasia: results of a randomized trial on Helicobacter pylori eradication.
Meyskens FL Jr, Szabo E. Diet and cancer: the disconnect between epidemiology and randomized clinical trials.

