Article Text

Abstract
Background: Peptides from α-gliadins have been used to characterise the immunodominant coeliac toxic epitope. A peptide corresponding to amino acid residues 57–73 of A-gliadin causes peripheral blood mononuclear cells from coeliac patients to secrete interferon γ (IFN-γ); gluten specific small intestinal T cell clones proliferate in response to peptides corresponding to residues 57–68 and 62–75 of α-gliadins. We wished to investigate whether a peptide corresponding to residues 56–75 of α-gliadins exacerbates coeliac disease in vivo.
Methods: Four adults with coeliac disease, all of whom were on a gluten free diet, underwent three challenges. Peptic-tryptic gliadin (PTG 1 g) served as a positive control. The test peptide and a negative control peptide were studied on separate occasions. The peptides were instilled into the duodenum and biopsies were taken before the infusion, and two, four, and six hours after commencing the infusions, using a Quinton hydraulic multiple biopsy capsule. Biopsy specimens were assessed blindly for villus height to crypt depth ratio (VH:CD), enterocyte cell height (ECH), and intraepithelial lymphocyte (IEL) count. We used the Mann-Whitney U test, with 95% confidence intervals, for statistical analysis.
Results: VH:CD and ECH fell, and IEL increased significantly 4–6 hours after commencing infusions with both PTG and the test peptide in all subjects. The negative control peptide caused no significant changes to villus morphology, enterocyte height, or IEL count in any patient.
Conclusion: We have confirmed that the putative immunodominant epitope, a peptide corresponding to residues 56–75 of α-gliadins, exacerbates coeliac disease in vivo.
- coeliac disease
- toxic epitope
- peptide challenge
- mucosal immunity
- PTG, peptic-tryptic digest of gliadin
- VH:CD, villus height to crypt depth ratio
- ECH, enterocyte surface cell height
- IEL, intraepithelial lymphocytes
- IFN-γ, interferon γ
- tTG, tissue transglutaminase
- HPLC, high pressure liquid chromatography
- PCR, polymerase chain reaction
- TEAF, triethylammonium formate
Statistics from Altmetric.com
- PTG, peptic-tryptic digest of gliadin
- VH:CD, villus height to crypt depth ratio
- ECH, enterocyte surface cell height
- IEL, intraepithelial lymphocytes
- IFN-γ, interferon γ
- tTG, tissue transglutaminase
- HPLC, high pressure liquid chromatography
- PCR, polymerase chain reaction
- TEAF, triethylammonium formate
Peptides corresponding to sequences of gluten proteins (gliadins and glutenins) have been studied to characterise the toxic epitope in coeliac disease. Several groups have demonstrated that there may be a number of gluten peptides involved in the disease process.1–9
A peptide corresponding to amino acid residues 31–49 of A-gliadin was found to cause significant histological changes in small intestinal biopsy specimens after in vivo challenge by intraduodenal infusion.10
Anderson and colleagues11 subsequently studied 51 overlapping synthetic 15 amino acid peptides, spanning the complete sequence of A-gliadin. They assessed optimal peripheral blood mononuclear cell secretion of the Th1 cytokine interferon γ (IFN-γ) in response to incubation with each of the peptides to demonstrate a transient, disease specific, HLA-DQ2 restricted, CD4 T cell response to a single dominant epitope. This peptide corresponded to residues 57–73 of A-gliadin, which had been partially deamidated by tissue transglutaminase (tTG) at position 65 (Q65 to E).
Arentz-Hansen and colleagues12 produced 11 different recombinants from α-gliadins (α1–α11) to demonstrate that the intestinal T cell response to α-gliadins in adult coeliac disease patients focuses on two immunodominant DQ2 restricted peptides that overlap by a seven residue fragment. Seven gluten specific T cell clones from small intestinal biopsies of four different adult patients with coeliac disease all responded to one or both of the peptides, following deamidation with tTG. This indicates that these epitopes are highly relevant to disease pathology. The peptides correspond to residues 62–75 of α2-gliadin and 57–68 of α9-gliadin with Q65 to E (see table 1).
Amino acid sequences* and origin of peptides
In separate experiments, we have shown that T cell clones isolated from coeliac patients respond to both individual peptides and the combined peptide by multiplying and producing IFN-γ when stimulated.13
Peptide binding studies suggest that the HLA-DQ2 and HLA-DQ8 molecules play a key role in disease pathogenesis, in presenting peptides to antigen specific T cells, thus triggering the inflammatory response.12,14 All small intestinal gluten sensitive T cell clones identified so far have been DQ restricted.15
The only true test of toxicity is to confirm that these in vitro changes can be translated into in vivo reactions by in vivo challenge studies.
We investigated the effect of a peptide corresponding to amino acid residues 56–75 of α2-gliadin, the putative immunodominant peptide, on the small intestinal mucosa of patients with coeliac disease who were on a gluten free diet. This peptide was chosen as it incorporates both Anderson et al’s proposed toxic peptide (residues 57–73 of A-gliadin, with serine at position 73) and residues 62–75 of α2-gliadin, and residues 57–68 of α9-gliadin peptides identified by Arentz-Hansen et al. This combined peptide is referred to as G8 in these experiments. We compared the reaction produced by a positive control (peptic-tryptic digest of gliadin (PTG)) and a negative control peptide to this peptide. The negative control peptide, corresponding to residues 53–72 of β-caseins, comprised 20 amino acids incorporating the same residues as the test peptide (glutamine, leucine, phenylalanine, proline, tyrosine), but in a different order. We refer to this peptide as C1 in these experiments (see table 1 for amino acid sequences).
METHODS
The peptides were synthesised by Fmoc chemistry with a solid phase peptide synthesiser (Applied Biosystems 431 A, Weiterstadt, Germany). The synthesiser was operated according to the manufacturer’s standard protocol on a small scale (1 mmol Fmoc amino acid), using 4-hydroxymethyl-phenoxymethyl-copolystyrene-1%-divinylbenzene as resin. Protection groups of amino acid side chains were as follows: Gln-(NTrt) and Tyr-(OtBu).
The crude peptides were roughly purified by reversed phase liquid chromatography using C18 silica gel Lichroprep (25–40 μm; Merck No 109303, Durmstadt, Germany) packed into a 3×30 cm glass column. The chromatography was performed under the following conditions: column temperature 20°C; elution system A: 0.01 mol/l trimethylammonium acetate, pH 6.0; elution system B: acetonitrile, gradient linear, adapted to each peptide; injection: 200 mg crude peptide dissolved in 10 ml of 30–50% (v/v) methanol, flow rate 3 ml/min; detection by UV absorbance at 235 nm.
The second purification step included reverse phase high pressure liquid chromatography (HPLC) on C18 silica gel Nucleosil 100-5 (Macherey-Nagel No 712130.10, Dueren, Germany). Column size was 4.6×250 mm and temperature was 50°C. Peptide eluate (100–500 μl, approximately 1–3 mg) from the first purification step was directly injected and chromatographed with the elution solvents described above, under isocratic conditions. The proportion of solvent B was adjusted within a range of 14–35% so that each peptide was eluted after 20 minutes. Flow rate was 1.0 ml/min and the detection wavelength was 235 nm. By means of automatic injection and eluate collection, more than 100 runs per peptide were performed.
The eluted peptides were concentrated using a rotary evaporator and freeze dried. The peptides obtained were twice redissolved in distilled water and freeze dried, thus the volatile constituents of the HPLC elution system (acetonitrile, trimethylammonium acetate) were completely removed. Yields of purified peptides corresponding to the raw peptide, and determined by weight, were 61% (G8) and 46% (C1), respectively. The purity of the peptide was checked by analytical reversed phase HPLC on the same HPCL column under the following changed conditions: elution solvents: A: 0.01 mol/l triethylammonium formate, pH 3.0 (TEAF); and B: acetonitrile (40% v/v)/ TEAF (60% v/v), gradient linear, 0 minutes 60% B, 30 minutes 90% B; injection: 5–10 μg peptide dissolved in 50% (v/v) methanol; detection at 210 nm. The identity of peptides was checked by electrospray mass spectrometry (LCQ, Finnigan Mat); approximately 25 μg of peptide were dissolved in 250 μl methanol (40% v/v)/formic acid (0.1% v/v).
The stepwise enzymatic hydrolysis of gliadin isolated from the wheat cultivar “Rektor” was performed with pepsin (Sigma P3286; St Louis, Missouri, USA) and trypsin (Sigma T1763), both attached to agarose, according to Bolte and colleagues.16 Gliadin (1 g) was dissolved in 50 ml of diluted HCl (pH 2.0) and 100 mg ( = 4000 U) of pepsin were added. The mixture was magnetically stirred at 37°C and after two hours centrifuged for 20 minutes at 20°C and 6000 g. The pH of supernatants was adjusted to 7.8 with 0.1 mol/l NaOH, and 1 ml of the trypsin suspension ( = 25 U) was added. After two hours of incubation at 37°C and under magnetic stirring, the pH was adjusted to 7.0 with 0.1 mol/l HCl, and the digest was centrifuged for 20 minutes at 20°C and 6000 g. The supernatant was then freeze dried.
For the challenge studies, peptides were dissolved in 50 ml of 0.5% low endotoxin bovine serum albumin (Sigma) in distilled water. PTG was given at a dose of 1 g; the peptides G8 and C1 were given at a dose of 20, 50, or 100 mg. Both peptides were given in matched doses for each subject.
We studied four unrelated Caucasian patients with known coeliac disease, diagnosed according to the European Society of Paediatric Gastroenterology and Nutrition (ESPGAN) criteria. These patients were chosen from the outpatient clinic, and were selected because of their cooperation and ability to be available for all three parts of the study. The study was approved by the local research ethics committee, and patients gave written informed consent prior to each part of the study. All patients were analysed for HLA type by polymerase chain reaction (PCR) sequence specific primers, as previously described.17 Briefly, DNA was isolated from peripheral blood leucocytes. PCR was performed in 10 μl reactions containing: H2O, 40 mM of each dNTP, HGH, 2.0 mM MgCl2, 1 unit Taq polymerase, 10× buffer, 10× reddy mix, and 50 ng of genomic DNA. Amplification was for 30 cycles of 94°C for 20 seconds, 65°C for 50 seconds, and 72°C for 20 seconds. The amplified products were separated by agarose gel electrophoresis and visualised by ethidium bromide staining and UV fluorescence.
Patients each had three challenges. PTG was given first to confirm a positive reaction to a known disease activating substance, and to prime the small intestinal T cells. This was followed by the peptide G8 and finally the peptide C1 matched to the same dose, with at least two weeks between challenges to allow for recovery of the duodenal mucosa.
The method used was as described previously.10 Briefly, a cannula was attached to a Quinton hydraulic multiple biopsy capsule, with the tip 10 cm proximal to the suction port of the capsule. The patient was sedated using intravenous midazolam, and the capsule positioned in the distal duodenum, proximal to the ligament of Treitz, under fluoroscopic control. On different days, the solutions of PTG or test peptides were infused into the distal duodenum over two hours by syringe driver. Biopsies were taken before infusion, and at two, four, and six hours after the start of infusion.
Two to four biopsies were taken at each time point. Two were fixed in formalin and sent for wax mounting and haematoxylin-eosin staining of 5 μm sections. The other two specimens were covered in optimal cutting compound (BDH Laboratory Supplies, Poole, UK) and then snap frozen in thawing isopentane over liquid nitrogen.
Morphometric analysis was performed on haematoxylin-eosin stained sections from time points before the beginning of the infusion and at four hours after the beginning of the infusion. The four hour time point was chosen as this appears to be the time of maximal changes in morphology in previous experiments.10 Measurements were taken of the height of 10 separate randomly selected villi and the depth of the adjoining crypts using a micrometer scale graticule, and the villus height to crypt depth ratio (VH:CD) calculated. Under ×400 magnification, the heights of 30 separate enterocytes (ECH) were measured using a micrometer scale graticule. Enterocytes were randomly chosen from the middle third of the villi thus avoiding the crypts, tips of the villi, and areas of obviously poor preservation.
Immunohistochemistry for CD3 positive cells
Cryostat sections (5 μm) were fixed in acetone, blocked with 0.6% H2O2, and then incubated with normal rabbit serum (Dako X0901, Ely, Cambridgeshire, UK) at a dilution of 1:25. Sections were then incubated with mouse antihuman primary antibody to CD3 positive cells (Dako M0835). This was followed by incubation with biotinylated rabbit antimouse antibody (Dako E0354) at a dilution of 1:300. Streptavidin-peroxidase (Dako P0397) was added at 1:500 and the colour was developed using DAB as a peroxidase substrate. Sections were counterstained with haematoxylin, and viewed by light microscopy. The number of CD3 positive cells (intraepithelial lymphocytes (IEL)) per 100 enterocytes was calculated.
Statistical analysis
Changes in VH:CD ratio and ECH values before and four hours after the start of infusion were analysed both for each patient individually (using the Mann-Whitney U test with 95% confidence intervals) and in a combined data set (using the Wilcoxon signed rank test). Immunohistochemically stained CD3 positive cell counts before and four hours after the start of infusion were analysed by the Mann-Whitney U test with 95% confidence intervals.
RESULTS
Peptides
We investigated the effect of peptide G8, corresponding to amino acid residues 56–75 of α-2 gliadin (see table 1 for amino acid sequences). Residue 56 (leucine) of α-gliadins was included because firstly, N terminal glutamine (residue 57) would have been partially transformed to pyroglutamic acid, which would have complicated peptide purification. Also, the peptide bond between residue 55 (tyrosine) and 56 (leucine) was shown to be a cleavage site for α-chymotrypsin.18 We compared the effects of peptide G8 with those of a positive control (PTG) and those of a negative control peptide (C1). The peptides G8 and C1 were chromatographically pure (> 99 %) and their masses (G8: 2392.8; C1: 2154.5) corresponded to theoretical values.
Patients
We studied four unrelated Caucasian coeliac patients. The age range of the patients was 68–75 years, and their characteristics are shown in table 2. All were on a gluten free diet for many years. Three of four patients were HLA DR3/DR7 and one was an HLA DR3 homozygote. Thus all patients had the tissue type HLA DQ2, and none was HLA DQ8.
Patient characteristics
Peptide challenge
When analysed as a group, using the Wilcoxon signed rank test, the differences in ECH and VH:CD between time 0 and four hours were statistically significant (p<0.0001). When subjects were analysed individually, using the Mann-Whitney U test, they each developed significant changes in VH:CD ratio (table 3), ECH (table 4), and immunohistochemical stained cell populations (table 5; figs 1–3).
Changes in villus height to crypt depth ratio from time = 0 to time = 4 hours*
Changes in enterocyte surface cell height (µm) from time = 0 to time = 4 hours*
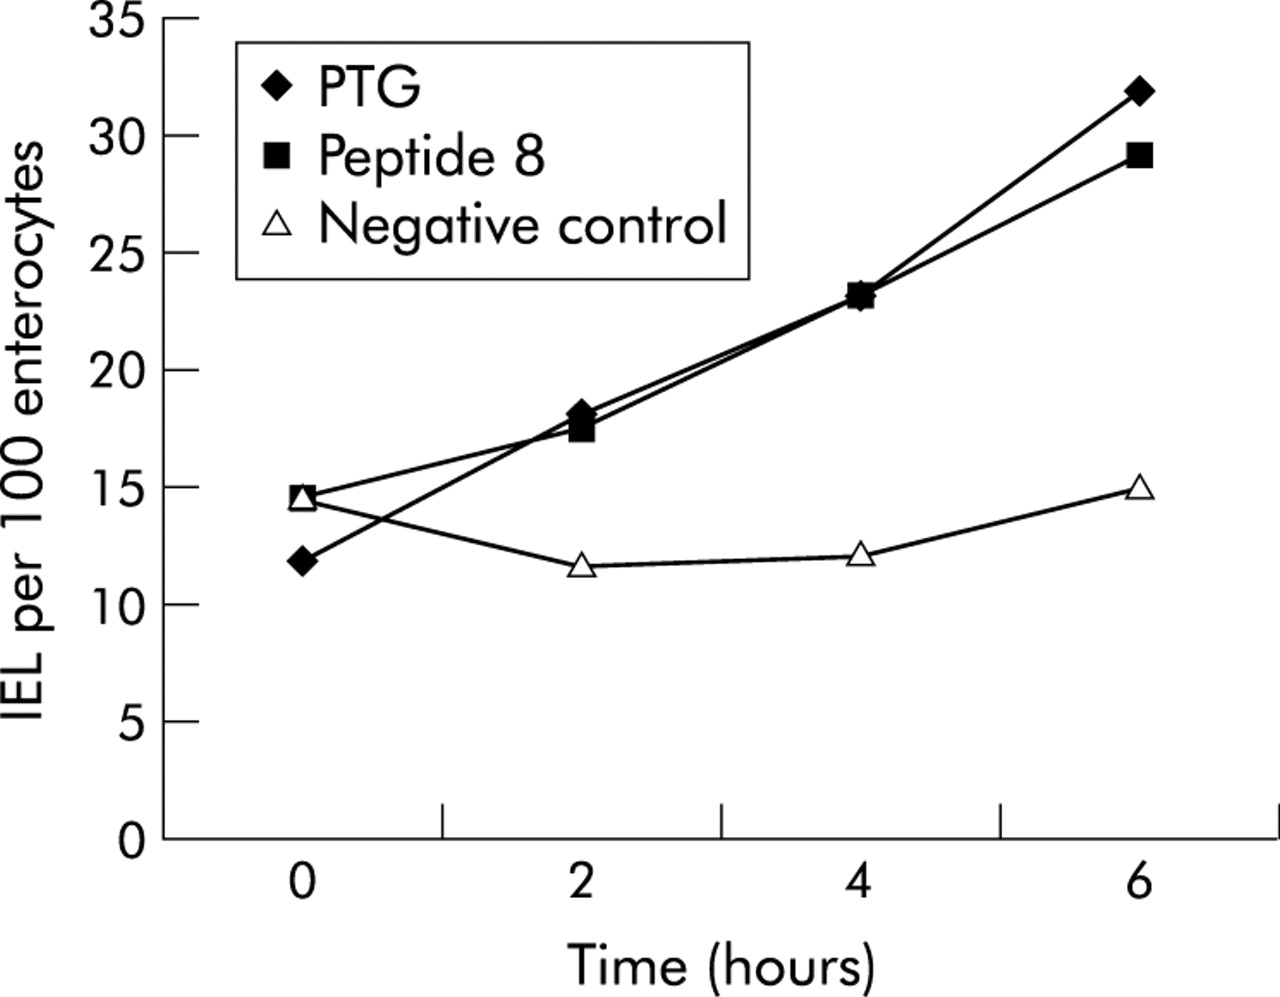
Mean CD3 counts following challenge with peptic-tryptic digest of gliadin (PTG), peptide 8 (G8), and a negative control (C1 peptide)

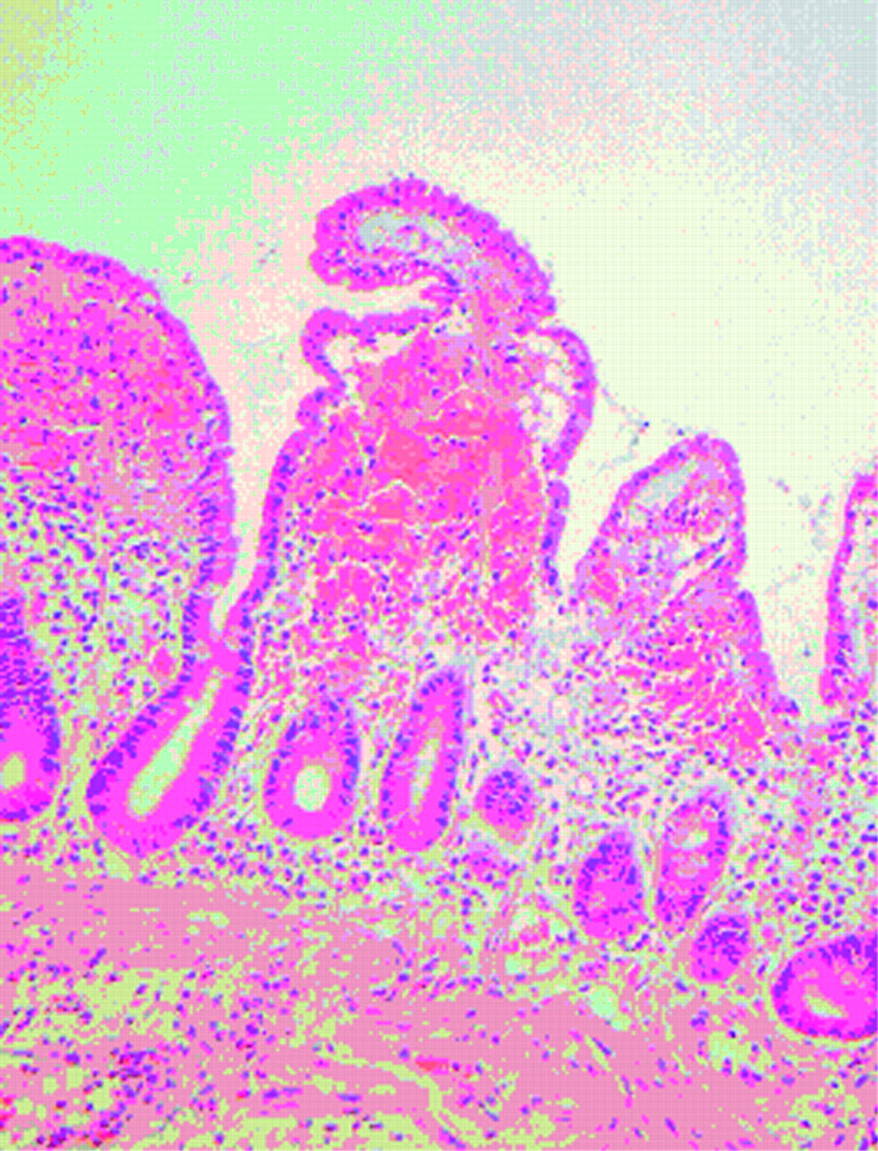
Patient No I. Before challenge with peptic-tryptic digest of gliadin.

Patient No I. After four hours, enterocyte height was reduced and villous blunting occurred.

Mean CD3 counts at four time points following challenge with peptic-tryptic digest of gliadin (PTG), peptide 8 (G8), and a negative control (C1 peptide). IEL, intraepithelial lymphocytes.
We initially gave 100 mg of peptide G8 to the first patient but the patient developed diarrhoea and faecal incontinence on the following day, and thus we reduced the dose to 20–50 mg for subsequent patients. As with PTG, this peptide caused a significant reduction in VH:CD ratio and ECH as well as an increase in IEL count compared with initial biopsy material, both when analysed as a group (Wilcoxon signed rank test, p<0.0001) as well as on an individual basis (Mann-Whitney U test; tables 3, 4).
In contrast, the control peptide C1 did not affect any of these variables significantly. Thus we have demonstrated that peptide G8, corresponding to residues 56–75 of α-gliadins, exacerbates coeliac disease in vivo.
DISCUSSION
We have demonstrated that while the negative control peptide C1 produced no response, the peptide G8 (corresponding to residues 56–75 of α-gliadins) exacerbated coeliac disease in vivo. Our study was limited to four patients as the experiments are invasive and time consuming. However, each patient demonstrated a reaction to peptide G8. All of our subjects were HLA DQ2 positive. None was HLA DQ8 positive and thus we cannot conclude that peptide G8 is toxic to all coeliac patients.
This peptide was chosen to correspond to the amino acid sequences which have recently been shown to cause T cell activation in vitro.11,12 Arentz-Hansen et al demonstrated that two overlapping immunodominant HLA-DQ2 restricted peptides caused an intestinal T cell response in adult coeliac disease patients. To avoid giving two challenges to our patients, we combined the two sequences. Moreover, we have shown that clones from a patient with coeliac disease are stimulated to multiply and produce IFN-γ by both of the individual overlapping peptides and the combined peptide. Thus there is a cross reaction at the T cell clone level between these peptides.13
It has previously been demonstrated that epithelial cells of coeliac patients, when challenged with gliadin in an organ culture experiment, overexpress DR molecules within one hour,19 and in vivo studies have shown that the lamina propria of patients contain significantly increased numbers of cytokine (particularly IFN-γ) mRNA expressing cells four hours after challenge with gliadin.3 These observations confirm that the initial response of the coeliac mucosa to antigen challenge occurs within the time frame of our experiment. We have also demonstrated a rise in the number of CD3 positive IELs in both the PTG and G8 challenges, which did not occur in the negative control experiment.
Both G8 and C1 were produced by the same methods. HPLC uses trimethylammonium acetate and TEAF. Triethylamine is a usual constituent of fish, and traces of it do not present a toxicological problem. If this had been the case, there would have been a response to the peptide C1.
The sequences represent part of the naturally occurring α-gliadins present in wheat. As this peptide is a normal dietary constituent, we felt that there was no indication for the peptide to be tested for toxicity in animals. The peptide in our study was given in its native sequence—that is, not deamidated at position 65—as we felt that this process would be mediated by the tTG enzyme present in the intestinal mucosa.20 We have previously shown10 that an adequate quantity of native gliadin, to induce a small bowel reaction after 4–6 hours, using the test method employed, is 1 g. Based on the average length of A-gliadin, which is 266 amino acid residues,18 we calculated that 100–200 mg of peptide G8, which is 20 residues long, would be required to produce the same effect. Sturgess and colleagues10 used 200 mg of test peptide in a previous evaluation of in vivo coeliac toxicity. As we believe that the peptide G8 corresponding to residues 56–75 is the immunodominant peptide in coeliac disease, we initially gave 100 mg to patient I, but the patient developed diarrhoea and faecal incontinence on the following day and thus we reduced the dose (20–50 mg) for subsequent patients. We found that this peptide caused a significant reduction in VH:CD ratio and ECH, as well as an increase in IEL count compared with initial biopsy material in each patient.
This finding is important for a number of reasons. Firstly, we have demonstrated that the in vitro T cell responses to the putative immunodominant epitope of α-gliadins observed by other groups translate into in vivo toxicity.
Secondly, options are emerging for new therapies for the treatment of coeliac disease. Coeliac disease appears to be a Th1/Th0 T cell mediated disease, with antigenic stimulation producing secretion of the cytokine IFN-γ. The immunodominant peptide could be produced with altered peptide ligands, and these products tested in the future to investigate whether they can be used as partial agonists to induce T cell suppression and downregulation of the pro:anti-inflammatory cytokine ratio. These could be given as an oral preparation.
Another potential use for this information would be in the production of a non-toxic wheat by incorporating gliadin DNA, which not only lacks the toxic fragment of α-gliadins, but could also incorporate blocking peptides. This would allow the production of a plant with baking and nutritional qualities of native wheat, but which did not exacerbate coeliac disease.
In conclusion, we have shown that the putative immunodominant epitope of wheat gliadin exacerbates coeliac disease in vivo.
Acknowledgments
We wish to thank the German Federal Ministry of Education and Research (project No 0312246 D), Coeliac UK and Action Research UK for financial support, and we thank George Elia and Evangelos Kyriakides at Cancer Research UK for help with frozen sections and Ms S Suckart for excellent technical assistance.
REFERENCES
Linked Articles
- Digest