Article Text

Abstract
Background: Different abnormalities of T cell effector function distinguish Crohn’s disease (CD) from ulcerative colitis (UC). Because cell cycling determines effector function, pathogenic events in CD and UC may depend on cell cycle changes unique to each condition.
Methods: Cell cycle kinetics, cycle regulatory molecule expression, apoptosis, caspase and telomerase activity, and cellular expansion were evaluated in CD2 and CD3 activated control, CD, and UC lamina propria T cells.
Results: Compared with normal cells, CD T cells cycle faster, express increased phosphorylated Rb and decreased phosphorylated p53 levels, display less caspase activity but more telomerase activity, die less, and undergo vigorous cellular expansion. In contrast, UC T cells cycle slower, express normal levels of phosphorylated Rb and p53, display more caspase activity but have no telomerase activity, die more, and have a limited capacity to expand.
Conclusions: T cell cycle abnormalities in CD indicate a state of hyperreactivity compatible with loss of tolerance, but a hyporeactive state compatible with anergy in UC. Thus distinct and divergent T cell cycle characteristics underlie the pathogenesis of the two main forms of inflammatory bowel disease.
- CDK, cyclin dependent kinase
- IBD, inflammatory bowel disease
- LPT, lamina propria T cells
- CD, Crohn’s disease
- UC, ulcerative colitis
- Rb, retinoblastoma protein
- BrdU, bromodeoxyuridine
- PI, propidium iodide
- CFDA SE, carboxyfluorescein diacetate succinimidyl ester
- IL, interleukin
- IFN, interferon
- mAb, monoclonal antibody
- PMA, phorbol myristate acetate
- PHA, phytohaemagglutinin
- FITC, fluorescein isothiocyanate
- RPE, R-phycoerythrin
- PBS, phosphate buffered saline
- TRAP, telomeric repeat amplification protocol
- mucosal immunity
- cell cycle
- cyclins
- telomerase
- retinoblastoma protein
- inflammatory bowel disease
- Crohn’s disease
- ulcerative colitis
Statistics from Altmetric.com
- CDK, cyclin dependent kinase
- IBD, inflammatory bowel disease
- LPT, lamina propria T cells
- CD, Crohn’s disease
- UC, ulcerative colitis
- Rb, retinoblastoma protein
- BrdU, bromodeoxyuridine
- PI, propidium iodide
- CFDA SE, carboxyfluorescein diacetate succinimidyl ester
- IL, interleukin
- IFN, interferon
- mAb, monoclonal antibody
- PMA, phorbol myristate acetate
- PHA, phytohaemagglutinin
- FITC, fluorescein isothiocyanate
- RPE, R-phycoerythrin
- PBS, phosphate buffered saline
- TRAP, telomeric repeat amplification protocol
- mucosal immunity
- cell cycle
- cyclins
- telomerase
- retinoblastoma protein
- inflammatory bowel disease
- Crohn’s disease
- ulcerative colitis
Both forms of inflammatory bowel disease (IBD) are characterised by chronic tissue damage mediated by disregulated mucosal T cell function.1 Although Crohn’s disease (CD) and ulcerative colitis (UC) share several clinical features, the mechanisms of tissue injury may differ in each condition,2 implying that T cell effector function is distinct in CD and UC. Mucosal T cells proliferate more, express higher levels of interleukin (IL)-2 receptor α, and are more cytotoxic in CD than UC.3–5 Production of IL-2 and interferon (IFN)-γ is greater by CD than UC T cells,6–9 and IL-12 and IL-18 are elevated in CD but not in UC intestine.10–13 In addition, CD T cells are resistant while UC cells are susceptible to IL-4 mediated suppression.14 In addition, mucosal T cells express higher levels of Fas ligand in UC than in CD15 while CD T cells are more resistant to apoptosis induced by a variety of stimuli and display decreased Bax expression.16–18
These observations indicate that the pathogenic effector function of CD and UC T cells are fundamentally diverse. Effector function results from T cell activation which depends on the capacity to cycle in response to antigenic signals.19,20 Thus a detailed analysis of the cell cycle could reveal how T cell activation is regulated in normal and inflamed mucosa. Progression of T cells through the cell cycle is a complex process coordinated by the action of several molecules, including promoters such as cyclin dependent kinases (CDK) and inhibitors such as p21, p27, and p53.21 Cyclins bind to CDK to form regulatory complexes22 whose activity is modulated by phosphorylation and interaction with inhibitors that prevent unrestrained proliferation.23,24 Once the signal that triggers cycling is eliminated, immune homeostasis is maintained by apoptosis,25–27 which is mediated by caspases.25,28 Finally, to allow adequate clonal expansion, proliferation also requires the activity of telomerase, a specific enzyme that preserves chromosomal length and sustains replication.29,30
The outcome of a T cell response depends on the balance between cell cycling and death, particularly among gut T cells which must maintain immune tolerance while providing protection against an antigen rich microenvironment.31–34 As tolerance seems to be lost in IBD,32,34 the mechanisms controlling cell cycling and apoptosis may be deranged leading to uncontrolled inflammation. To test this hypothesis, we performed a detailed analysis of cell cycle kinetics, evaluated expression of cell cycle regulators, measured caspase and telomerase activity, and evaluated clonal expansion of CD and UC mucosal T cells.
MATERIALS AND METHODS
Reagents and antibodies
For T cell isolation, mucosa was digested in collagenase type 3 and DNase type 1 (Worthington Biochemical Corp., Lakewood, New Jersey, USA). Human IL-2 (Chiron, Emeryville, California, USA), CD3 monoclonal antibody (mAb) (OKT3; Ortho Diagnostic System Inc., Raritan, New Jersey, USA), CD2 mAb (T112/T113; Dr Ellis Reinherz, Boston, Massachusetts, USA), CD28 mAb (ANC28.1/5D10; Ancell Corp., Bayport, Minnesota, USA), phorbol myristate acetate (PMA) (Sigma, St Louis, Missouri, USA), and phytohaemagglutinin (PHA) (Gibco, Grand Island, New York, USA) were used for T cell activation. Fluorescein isothiocyanate (FITC) conjugated anticyclin B1 and FITC conjugated antibromodeoxyuridine (BrdU) were from BD Pharmingen (San Diego, California, USA), rabbit antiphospho-histone H3 antibody from Upstate Biotechnology (Lake Placid, New York, USA), and secondary Alexa 350 conjugated labelled goat antirabbit IgG from Molecular Probes (Eugene, Oregon, USA). The Vybrant carboxyfluorescein diacetate succinimidyl ester (CFDA SE) Cell Tracer Kit was from Molecular Probes and propidium iodide (PI) from Calbiochem (San Diego, California, USA). All protease and phosphatase inhibitors used for western blotting were purchased from Sigma. Antibodies against caspase 3, cyclin D3, retinoblastoma (Rb) protein, cyclin A, p21, p27, and p53 were from BD Pharmingen. The caspase 8 antibody (StressGen Biotechnologies, Victoria, Canada) was provided by Dr Marc Smith (Case Western Reserve University, Cleveland, Ohio, USA) and FLIP and CDK4 antibodies were from Santa Cruz Biotechnology (Santa Cruz, California, USA).
Cell isolation, induction of mucosal T cell cycling, and proliferation assay
Intestinal T cells were isolated from surgical specimens from patients with CD, UC, and malignant and non-malignant conditions that provided histologically normal control tissue. All patients with IBD had active disease, as defined by the Harvey-Bradshaw activity index and the clinical colitis activity index. Specimens were obtained from 10 CD, nine UC, and 10 control patients. Patients with CD (four men and six women, aged 26–65 years) had ileocolic or colonic disease which had been present for 2–30 years. At the time of resection, four patients were receiving corticosteroids only, one corticosteroids and aminosalicylates, three 6-mercaptopurine and aminosalicylates, and two non-specific therapy. No patient was receiving infliximab therapy. Patients with UC (five men and four women, aged 24–49 years) had disease which had been present for 1–26 years. At the time of colectomy, two patients were receiving corticosteroids only, three corticosteroids and aminosalicylates, two aminosalicylates only, and two 6-mercaptopurine and aminosalicylates. Control patients (six men and four women, aged 18–77 years) included six colonic adenocarcinomas, two benign caecal polyps, one familial polyposis, and one diverticular disease. Histologically normal tissue was obtained at least 10 cm from the tumour, polyps, or diverticula. All diagnoses were confirmed by clinical, radiological, endoscopic, and histological criteria. The project was approved by the Institutional Review Board of University Hospitals of Cleveland. All lamina propria T cells (LPT) were isolated from colonic specimens, as previously described,16,35 cultured in RPMI 1640, and stimulated with 1 ng/ml PMA and 0.02% PHA. After two days, cells were washed, and cycling was induced by addition of 20 units of IL-2/ml twice weekly. After 10–14 days, cultures contained >95% CD3+, >80% CD4+, >97% CD45RO+, >70% HLA-DR+, <0.6% CD14+, and <0.9% CD19+ cells, regardless of their IBD or control origin and use of medications.16 To induce cycling, these T cells were activated by cross linked anti-CD3 mAb (10 μg/ml) or soluble anti-CD2 mAb pairs (1:1000) for three days, and to measure proliferation, 0.5 μCi of [3H] thymidine/well (DuPont NEN, Boston, Massachusetts, USA) was added 18 hours before the end of culture.
Flow cytometric analyses
Cell surface staining
Cell phenotype was routinely analysed using CD3-R-phycoerythrin (RPE) conjugated mAb (Dako, Carpinteria, California, USA), and background fluorescence determined by RPE conjugated mouse IgG.
Cell cycle phase distribution
Staining for DNA content, cyclin B1, and mitotic cells was performed as previously described.36 Briefly, cells were washed in phosphate buffered saline (PBS), fixed in 90% methanol at −20°C, and incubated with antiphospho-histone H3, followed by Alexa 35 conjugated goat-anti rabbit IgG. Cells were washed, incubated with FITC conjugated anticyclin B1, suspended in PBS and 5 μl of RNase (0.6 μg/ml, 30–60 Kunitz units; Sigma), incubated at 37°C for 15 minutes, and then chilled on ice, and PI (200 μg/ml) was added prior to flow cytometry.
Cell cycle kinetics and potential doubling time
Cell kinetics were performed using two colour flow cytometry on cells grown for three days with or without stimulus and incubated for 60 minutes with 20 μM BrdU chased with thymidine. BrdU labelled nuclei were then stained with FITC conjugated anti-BrdU and PI. Denaturation of DNA allowing antibody binding to incorporated BrdU was achieved by acid treatment. Mathematical analysis was performed according to Begg et al and White and colleagues,37,38 and movement of BrdU labelled cells across S phase relative to the position of G1 and G2+M (relative movement, RM) was calculated by the formula
RM(t) = (FS(t)−FG1(t))/FG2+M(t)−FG1(t))
where FG1 = unlabelled G1 mean red fluorescence; FG2+M = unlabelled G2+M mean red fluorescence, and FS = mean red fluorescence of the BrdU labelled cells at time (t). S phase duration (TS) was calculated as the time for one unit relative movement (RM). The potential doubling time was computed by the formula
Tpot = ln(2)TS/v
with v defined as ln[1+flu(t)/1−fld(t)/2]
where flu(t) = fraction of labelled undivided cells at time (t) and fld(t) = fraction of labelled divided cells at time (t).
Analysis of cell division
Analysis of cell division was performed by dye dilution using the Vybrant CFDA SE Cell Tracer Kit according to the manufacturer’s instruction. Stained cells were cultured alone or with anti-CD2 mAb pairs or crosslinked anti-CD3 mAb, each with CD28 (5 μg/ml) and IL-2 (20 U/ml). After four days, cells were washed in PBS, fixed with 1% paraformaldehyde, and analysed.
Apoptotic index
The percentage of apoptotic events (apoptotic index) was determined in PI stained cells by gating the sub-G1 events content in the respective histograms.
Western blotting, assessment of caspase activity, and measurement of telomerase activity
Western blotting and assessment of caspase activity were performed as previously reported.39,40 Telomerase activity was measured using a photometric enzyme immunoassay (Telo TAGG Telomerase PCR ELISA; Roche-Diagnostics GmbH, Mannheim, Germany) based on the telomeric repeat amplification protocol (TRAP) of Kim and Wu.41 The TRAP was performed according to the manufacturer’s instructions.41 The human kidney cell line 293 was used as a positive and heat inactivation of telomerase as a negative control.
Statistical analysis
Statistical analysis was performed using ANOVA, Student’s t, or Mann-Whitney test. Results are expressed as mean (SEM) and significance was inferred with p values <0.05.
RESULTS
Distinct T cell cycle phase distribution in CD and UC
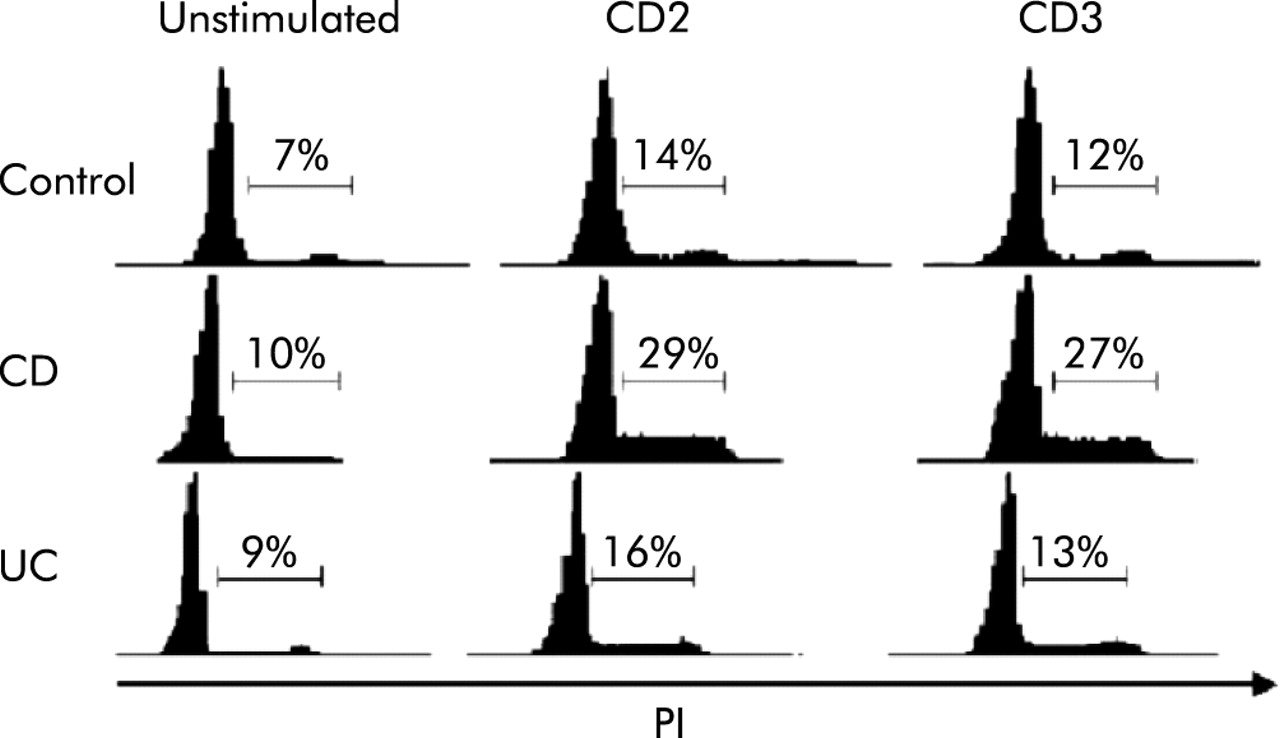
Compared with peripheral blood T cells, LPT display unique cell cycle kinetics40 and we initially investigated whether such kinetics were altered in CD or UC. Compared with control LPT, CD cells displayed significantly increased (p<0.005) and UC cells significantly decreased (p<0.05) 3[H]-thymidine incorporation (fig 1). To learn what fraction of cells go through the resting (G0/G1), mitotic (G2/M), and division (M) phases, we performed a cytometric LPT cycle analysis in response to anti-CD2 and anti-CD3 activation. After three days with CD2 mAb, 14 (2.2)% of control T cells had progressed into the S or G2/M phases (fig 2). A significantly greater (29 (3.1)%; p<0.05) fraction of CD LPT entered the S and G2/M phases whereas UC cells entered in a number (16 (2.4)%) comparable to control cells. When anti-CD3 was used, the same differential progression into the S and G2/M phases was observed, CD LPT having twice as many cells in S and G2/M phases (27 (2.9)%; p<0.05) than control (12 (1.7)%) and UC LPT (13 (2.9)%) (fig 2).

Distinct thymidine incorporation rate of control and inflammatory bowel disease mucosal T cells in response to receptor activation. Proliferation of Crohn’s disease (CD) lamina propria T cells (LPT) was significantly greater, and that of ulcerative colitis (UC) LPT significantly lower, than that of control LPT. Cells were cultured in the absence and presence of CD2 (T112/T113) antibody or crosslinked anti-CD3 monoclonal antibody for 72 hours, and pulsed with 3H thymidine for the last 18 hours prior to harvesting and counting in a β-scintillation counter. Data are expressed as mean (SEM) of six separate experiments. CPM, counts per minute. *p<0.05, **p<0.005 for UC and CD versus control LPT, respectively.

Distinct cell cycle phase progression of control and inflammatory bowel disease mucosal T cells in response to receptor activation. The number of Crohn’s disease (CD) lamina propria T cells (LPT) in S and G2/M phase was significantly greater than that of control or ulcerative colitis (UC) LPT (p<0.05), regardless of the stimulus used. Cells were cultured in the absence and presence of CD2 (T112/T113) antibody or crosslinked anti-CD3 monoclonal antibody for 72 hours, and cell cycle phases were assessed by measuring DNA content by propidium iodide staining followed by flow cytometry. The graphs are representative of 7–9 different experiments.
Divergent kinetics of CD and UC T cells
To gain a more dynamic view of how quickly cells cycle, we performed stathmokinetic analysis to determine the time taken to traverse each cycle phase, reach mitosis, and divide.37,38,42,43 The S phase traverse time of anti CD2 or CD3 activated CD LPT was half of that of control LPT while the S phase time of UC LPT was longer than that of control LPT (table 1). When potential doubling time (Tpot) was calculated based on BrdU incorporation, it took two days for anti-CD2 or CD3 stimulated control LPT to double. In contrast, CD LPT took one day to double (p<0.05) while UC LPT needed longer than two days (table 1).
Differential effect of CD2 and CD3 activation on lamina propria T cell (LPT) cell cycle kinetics
Differential expression of cell cycle promoters and inhibitors in CD and UC
Cell cycle progression is controlled by a large number of promoter and inhibitor molecules.20–24 Western blot analysis showed that CDK4 and cyclin D3, which transit T cells through G1, were comparably expressed in control, CD, and UC LPT (fig 3). However, phosphorylation of Rb, essential for G1/S transition,44 increased remarkably more in CD than control and UC LPT. CD LPT also showed strong upregulation of cyclin A, responsible for S phase transition, whereas levels were similar in control and UC LPT (fig 3). The strong promoter expression in CD LPT persisted when cyclin B1 was examined together with DNA staining to localise its expression within the cycle. In response to anti-CD2, cyclin B1 in the G2/M phase of CD LPT was four times as high as control LPT (p<0.05) while that of UC LPT was only half (p<0.05) (fig 4). Similar differences in cyclin B1 expression were noted among control, CD, and UC activated through the CD3 pathway. Finally, expression of mitosis marker phosphorylated histone H345 was significantly higher in CD than control LPT while modestly lower in UC (table 1).
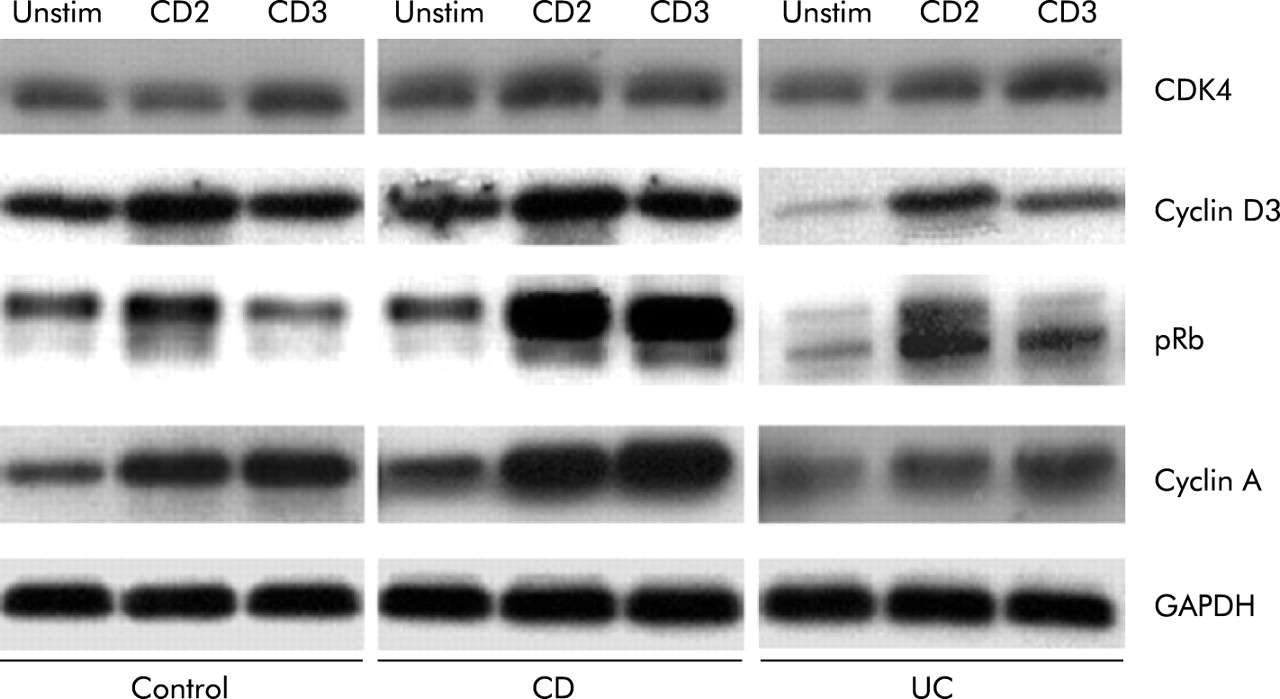
Differential expression of cell cycle promoters in control and inflammatory bowel disease mucosal T cells. Immunoblot analysis showed that upregulation of cyclin D3 and CDK4 was comparable in anti-CD2 or anti-CD3 activated control, Crohn’s disease (CD), and ulcerative colitis (UC) lamina propria T cells (LPT). Phosphorylation of retinoblastoma protein (Rb) and expression of cyclin A were greater in CD than in control and UC LPT. Cells were cultured in the absence and presence of anti-CD2 or anti-CD3 for three days, after which expression of cell cycle promoters was assessed by western blotting. Each panel is representative of 5–8 different experiments.

Differential expression of cyclin B1 in control and inflammatory bowel disease mucosal T cells. Compared with control cells, flow cytometric analysis showed increased cyclin B1 expression in the G2/M phase of activated Crohn’s disease (CD) but lower levels in activated ulcerative colitis (UC) lamina propria T cells (LPT). Cells were cultured in the absence and presence of anti-CD2 or anti-CD3 for three days, after which cyclin B1 expression and DNA content were examined by flow cytometry. The figure is representative of eight different experiments. PI, propidium iodide.
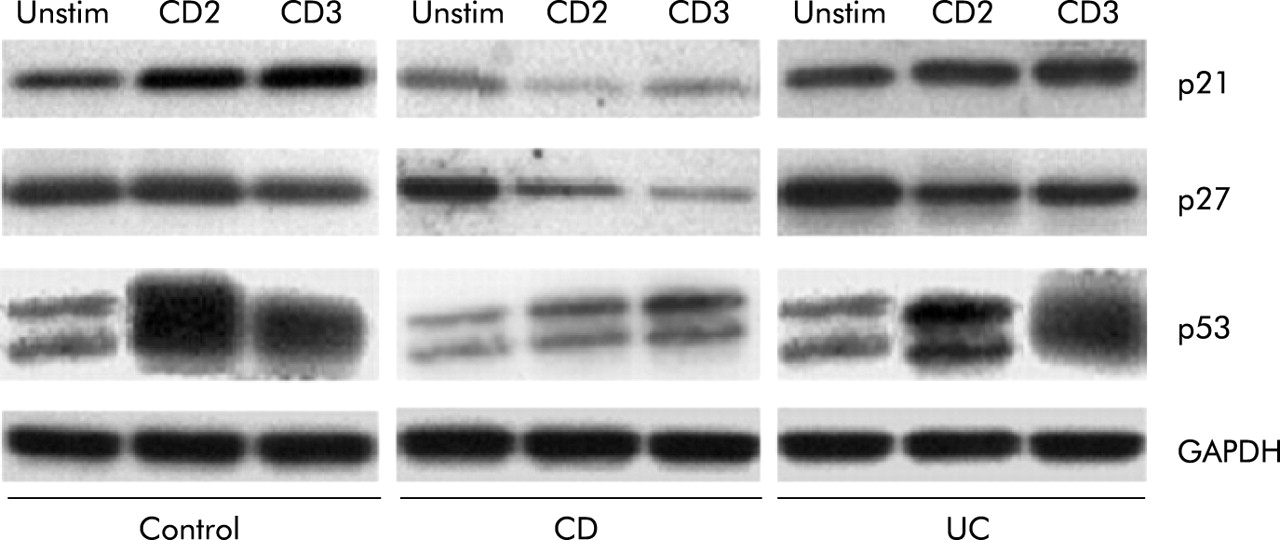
We next determined expression levels of the key cell cycle inhibitors. In CD LPT, p21 and p27 levels were lower than those of control and UC LPT in response to anti-CD2 and anti-CD3, respectively (fig 5). Levels of p53, a key negative regulator of mucosal T cell replication,40 were remarkably lower in CD LPT, particularly when activated through CD2, compared with control and UC LPT (fig 5).

Differential expression of cell cycle inhibitors in control and inflammatory bowel disease mucosal T cells. In Crohn’s disease (CD) lamina propria T cells (LPT), levels of p21 and p27 were lower than those of equally stimulated control and ulcerative colitis (UC) LPT. Levels of p53 were markedly lower in CD LPT, particularly when activated through the CD2 pathway, compared with control and UC LPT. Cells were cultured in the absence and presence of anti-CD2 or anti-CD3 for three days, after which expression of cell cycle inhibitors was assessed by western blotting. Each panel is representative of 5–8 different experiments.
Distinct regulatory mechanisms of T cell apoptosis in CD and UC
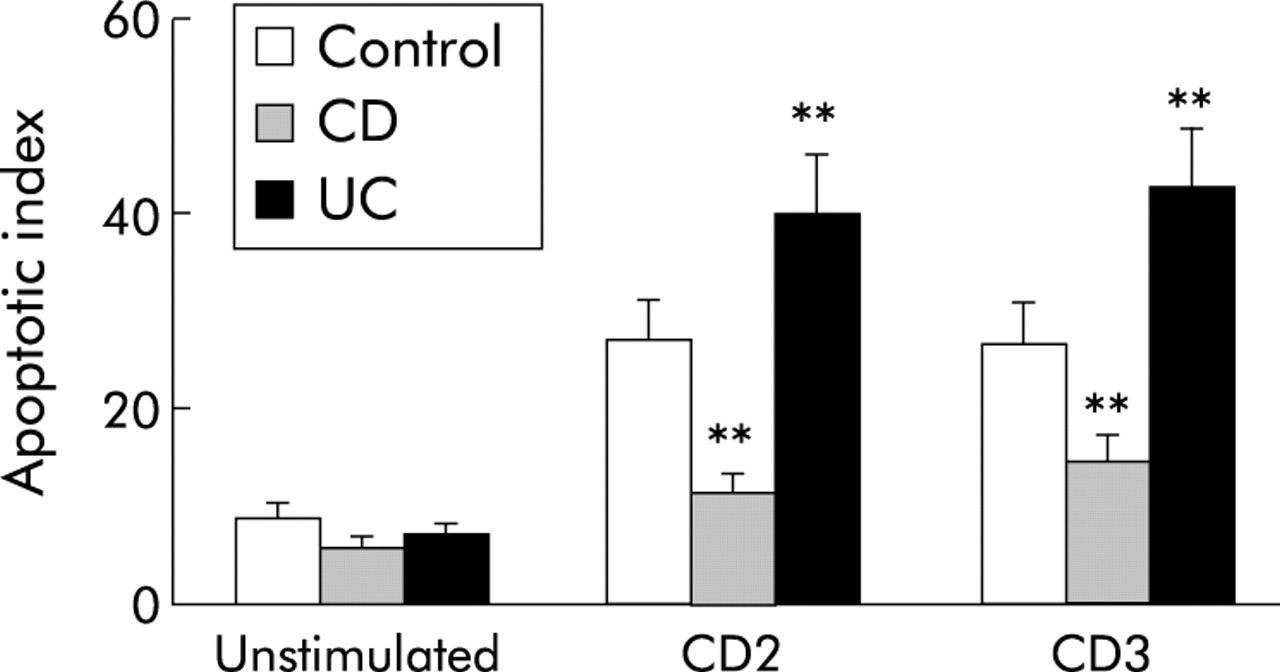
Because CD and UC mucosal T cells display distinct apoptosis patterns,16–18,46 and cycling and apoptosis are intimately linked,47–49 we studied key apoptosis regulators during T cell cycling. When control, CD, or UC T cells were stimulated through the CD2 or CD3 pathways, apoptosis increased in all groups, but significantly less in CD than in control LPT (p<0.01), and UC LPT displayed greater apoptosis than both control and CD LPT (p<0.05) (fig 6).

Distinct degrees of apoptosis in control and inflammatory bowel disease mucosal T cells. Crohn’s disease (CD) lamina propria T cells (LPT) displayed a decreased degree of activation induced cell death in comparison with control cells while the apoptotic index was significantly higher in ulcerative colitis (UC) than in both CD and control LPT. Cells were cultured in the absence and presence of anti-CD2 or anti-CD3 for three days after which apoptosis was assessed by measuring subdiploid DNA content by flow cytometry with propidium iodide staining. Each bar represents mean (SEM) of 6–9 experiments. **p<0.01 for CD and UC versus control LPT.
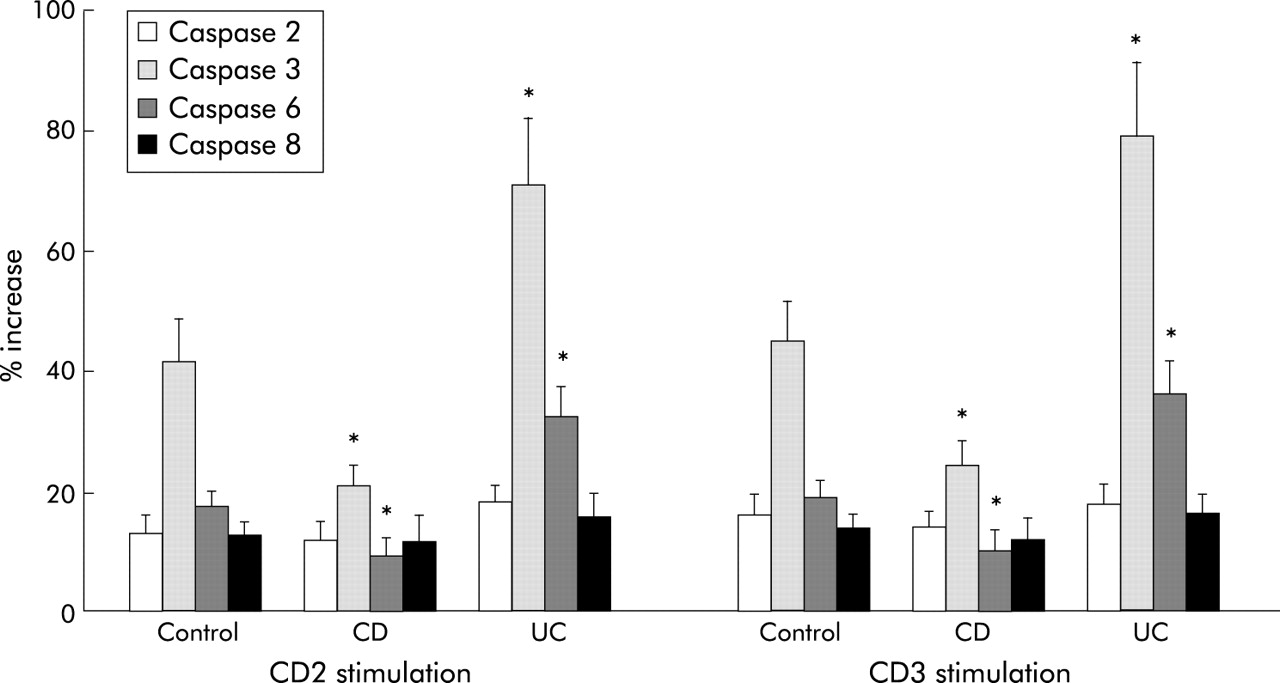
Caspase 3 and 6, but not caspase 2 and 8, were significantly lower in CD2 or CD3 activated CD than in control LPT (p<0.05) (fig 7). On the contrary, in UC LPT, the activity of caspase 3 and 6 was significantly higher than in control and CD LPT (p<0.05) (fig 7). Caspase 1, 4, 5, and 9 activity remained unchanged in all three groups (not shown). We also measured levels of FLIP which, through its long and short forms, prevents apoptosis.50,51 While FLIP long (55 kDa) expression showed little variation among control, CD, and UC cells, FLIP short (28 kDa) was clearly stronger in CD compared with control and UC LPT (fig 8).

Different caspase activity in control and inflammatory bowel disease mucosal T cells. Compared with control, Crohn’s disease (CD) lamina propria T cells (LPT) displayed significantly decreased caspase 3 and 6 activity. In contrast, caspase 3 and 6 activity was significantly higher in ulcerative colitis (UC) than in both control and CD LPT. Cells were cultured in the absence and presence of anti-CD2 or anti-CD3 for three days after which caspase activity was measured by a fluorogenic substrate assay. Each bar represents mean (SEM) of 6–9 experiments. *p<0.05 for CD and UC versus control LPT.

FLIP levels in control and inflammatory bowel disease mucosal T cells. FLIP long (55 kDa) expression levels were essentially the same as those of the control, Crohn’s disease (CD), and ulcerative colitis (UC) cells while levels of FLIP short (28 kDa) were clearly higher in CD compared with control and UC lamina propria T cells. Cells were cultured in the absence and presence of anti-CD2 or anti-CD3 for three days, after which expression of FLIP long and short was assessed by western blotting. Each panel is representative of 4–6 different experiments.
An additional apoptosis regulatory mechanism is preservation of telomere length by telomerase, which controls the replicative potential and lifespan of T cells.29,30 Control LPT upregulated telomerase activity comparably in response to anti-CD2 or anti-CD3 activation (p<0.05) (fig 9). In close agreement with their increased and decreased proliferation, respectively, telomerase activity was significantly higher in CD LPT after both anti-CD2 and anti-CD3 stimulation (p<0.005 and p<0.05, respectively) while, strikingly, UC LPT cells totally failed to activate telomerase (fig 9).
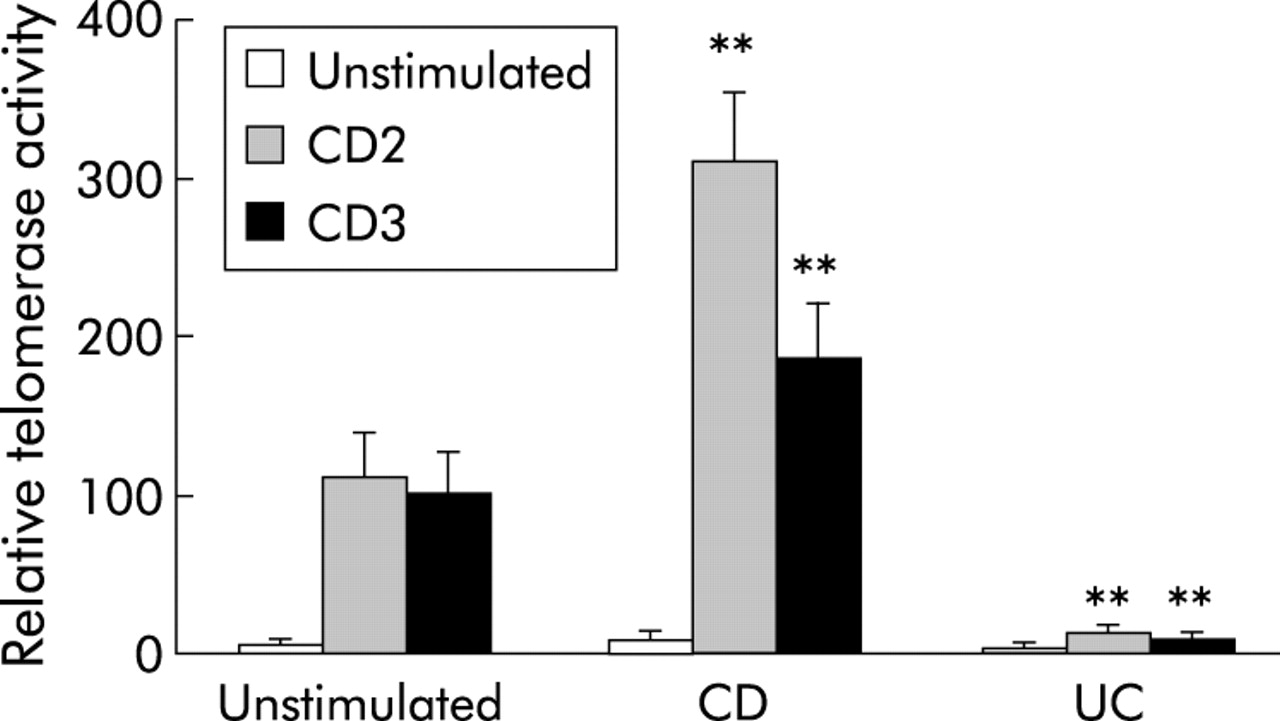
Distinct telomerase activity of control and inflammatory bowel disease mucosal T cells. Telomerase activity was significantly higher in Crohn’s disease (CD) than control lamina propria T cells (LPT), while absent in equally stimulated ulcerative colitis (UC) LPT. Cells were cultured in the absence and presence of anti-CD2 or anti-CD3 for three days after which cells were lysed, their DNA amplified, and analysed using the telomeric repeat amplification protocol (TRAP) protocol. Each bar represents mean (SEM) of 5–8 experiments. **p<0.005 for CD and UC versus control LPT.
Different expansion patterns of CD and UC T cells
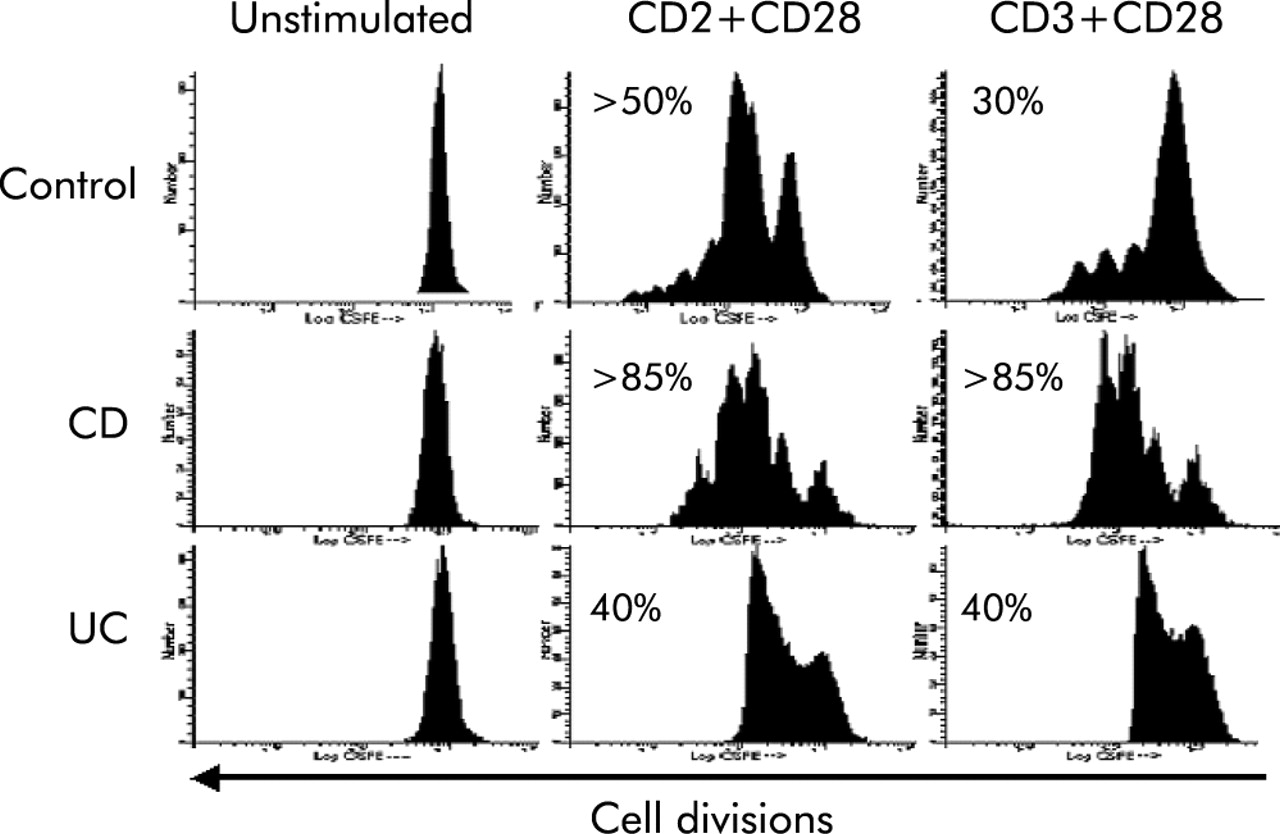
Finally, to assess the intrinsic capacity of T cells to divide and expand in response to activation, we determined the number of cell divisions in CFDA labelled LPT by measuring its dilution in successive daughter populations. After CD2+CD28 stimulation, three cell divisions comprising 50% of the original population were seen in control LPT (fig 10). In contrast, >85% of CD LPT expanded and generated four daughter cell populations. In UC LPT, 40% of cells expanded but generating only one daughter cell population (fig 10). When CD3+CD28 antibodies were used, control LPT generated three small daughter cell populations comprising 30% of the cells. When IBD cells were examined, CD and UC LPT responded with a pattern essentially identical to that of anti-CD2+CD28 stimulation (fig 10).

Distinct cellular expansion capacity of control and inflammatory bowel disease mucosal T cells. The number of cells expanding in response to anti-CD2+anti-CD28 or anti-CD3+anti-CD28 activation was greater in Crohn’s disease (CD) than control lamina propria T cells (LPT) while ulcerative colitis (UC) LPT divided only once. Cells were incubated with 5µM carboxyfluorescein diacetate and cultured in the absence and presence of interleukin 2 with anti-CD2+anti-CD28 or anti-CD3+anti-CD28 for four days, and the number of cell divisions determined by flow cytometry. The first peak to the right represents the undivided cell population. The numbers indicate the percentage of divided cells distributed in the subsequent peaks. The figure is representative of seven different experiments.
Cell cycle characteristics and clinical parameters
No significant correlations were found between any of the cell cycle abnormalities detected in CD or UC LPT and the type of therapy (immunosuppressants or non-specific therapy) that IBD patients were receiving at the time of resection. Likewise, age, sex, clinical activity, and diagnosis of control patients (malignant v benign disease) showed no correlation with any of the cell cycle measurements.
DISCUSSION
To maintain intestinal immune homeostasis, the function of mucosal T cells is tightly regulated, and cell cycling is essential to generate effector T cells and induce tolerance.52 Therefore, when tolerance is lost as in IBD, inflammation may result from dysregulation of the cell cycle.20
When the distribution of LPT within the cell cycle was analysed, fewer UC and control cells progressed into the S and G2/M phases while a larger fraction of CD did so, probably explaining the high proliferation of mucosal T cells in this condition.3 Although the CD2 activation pathway is dominant in mucosal T cells,53 the fact that more CD T cells entered the cell cycle even after CD3 receptor indicates that increased proliferation is receptor independent and perhaps intrinsic to this form of IBD.
Knowing the time spent in each cycle phase translates how quickly a cell reaches mitosis and divides,54 and even minimal changes may result in dramatic differences when iterated over many cell divisions.55,56 CD T cells spent 12 and 17 hours less in S phase than control and UC cells, respectively, and required only half of the time of control T cells to complete a cycle. These differences could be intrinsic to CD, and explain why the mucosa of CD patients contains an excess of T cells even during clinical remission.57 Cell cycle progression also regulates T cell cytokine repertoires.19,58,59 Shorter cell cycles generate more IFN-γ,60 and this may be a reason why T cell IFN-γ production is increased in CD but not in UC.8,9
Congruent with similar G1 traverse times, expression of cyclin D3 and CDK4 was comparable in control, CD, and UC LPT, indicating that G0/G1 phase regulation is not altered in IBD. In contrast, phosphorylation of Rb, needed to pass the restriction point and bring cells into the S phase,44 was remarkably strong in anti-CD2 and anti-CD3 stimulated CD LPT. This indicates a vigorous G1/S phase transition, as do upregulation of cyclin A and B. In UC, upregulation of these promoters was not observed, as expected by the slower traverse and longer doubling times. Anergic T cells are arrested in G1, fail to progress to the S phase, express low promoter levels, and lack Rb phosphorylation.61 The exact opposite occurs in CD T cells which quickly traverse the S phase and hyperphosphorylate Rb, translating an unrestrained proliferation and a hyperreactive state.
Levels of p53 phosphorylation were remarkably low in CD T cells, regardless of how activated. P53 mediates cell cycle arrest,25,27 and is a pivotal negative regulator of intestinal immunity by delaying mucosal T cell cycling.40 Thus low p53 and p21 levels in CD could remove a break that prevents excessive proliferation27 and contribute to mucosal T cell hyperreactivity. Increased cycling can break tolerance and cause autoimmunity,20 and the combination of weak inhibitor and strong promoter levels coupled to rapid cycling define a profile compatible with loss of tolerance in CD. In UC, levels of promoters and inhibitors were essentially normal but, in the face of active inflammation, normal levels may be inappropriate and reflect a state of anergy in this condition.
Resting T cells are resistant to apoptosis62 and must enter the S phase to become susceptible to cell death.47 CD2 and CD3 activated CD cells displayed a decreased and UC cells an increased apoptotic index compared with controls, and the activity of caspase 3 and 6 was low in CD but high in UC, matching with the respective levels of apoptosis in each form of IBD. Moreover, FLIP short, a specific inhibitor of caspase 8 and activation induced apoptosis,51,63 was higher in CD than in control and UC LPT. While the decreased caspase activity and increased short FLIP could explain the diminished apoptosis of CD T cells,16–18 their faster cell cycle contrasts with the observation that cells become more susceptible to cell death when actively cycling.25,47,62 This discrepancy suggests that the balance between cell cycling and death is lost in CD, resulting in unrestrained proliferation due, at least in part, to defective apoptosis.
Lifespan is controlled by multiple factors, among which telomerase, a unique RNA dependent DNA polymerase, plays a central role by elongating telomeres and preserving lymphocyte ability to replicate and survive.64 Telomerase activity was significantly higher in CD LPT, possibly resulting in an excessive number of daughter cell populations that contribute to enhanced proliferation and survival. Compatible with their decreased lifespan, telomerase activity was conspicuously absent in UC LPT. This dichotomy is surprising because T cells from chronically inflamed sites, like IBD mucosa, should contain high telomerase levels.65 Nevertheless, UC T cells lack telomerase activity, like in HIV-1 infection and aging, conditions characterised by premature and physiological immune senescence, respectively.66 Both conditions are typically associated with anergy, reinforcing the concept that mucosal T cells may be anergic in UC. A possible explanation includes a systemic defect, backed by genomic instability and high frequency of telomeric associations in circulating lymphocytes of UC patients.67
Additional striking differences were detected when LPT division was analysed by CFDA staining. Regardless of CD2 or CD3 activation, CD LPT vigorously expanded while T cell division was drastically restricted in UC, with less than half of the cells dividing. These results are in full agreement with differences in cell cycling, cell cycle regulators, apoptosis, and telomerase activity, and a pattern of tyrosine hyper- and hypophosphorylation in CD and UC, respectively (B Rivera-Reyes, work in progress). Together, these result strongly corroborate the concept of T cell hyper- and hyporeactivity in CD and UC, respectively. In fact, cells that divide and progress through the cell cycle mediate an effective immune response and prevent anergy, while those that fail to divide on receptor engagement lead to anergy.19,52,58,59 Hyporesponsiveness in UC cannot be simply attributed to chronic stimulation and an altered redox state, as proposed for rheumatoid synovial T cells,68 because T cells in CD are also exposed to comparably high levels of reactive oxygen species.69,70
In conclusion, compared with normal mucosal T cells, CD and UC cells display unique cell cycle profiles controlled by distinct regulatory mechanisms. The lack of correlation with any clinical parameter suggest that the cell cycle abnormalities detected in CD and UC may be intrinsic to each form of IBD. Because the cell cycle controls T cell function in immunity, tolerance, and autoimmunity,20 the distinct abnormalities of CD and UC indicate opposite T cell dependent pathogenic capacities. Intervening on specific molecular defects of T cell function, such as resistance to apoptosis in CD, has been shown to be therapeutically effective.71 Accordingly, identification of cell cycle regulatory abnormalities unique to CD or UC may also lead to novel therapeutic strategies specific for each form of IBD.
Acknowledgments
We thank Michael Sramkoski, Megan Gottlieb, and Xia Xi for technical assistance. We also thank the Departments of Surgery and Pathology, University Hospitals of Cleveland, and the Colorectal Surgery Department of the Cleveland Clinic Foundation, Cleveland, Ohio. Some tissue samples were provided by the Cooperative Human Tissue Procurement Facility of University Hospitals of Cleveland.
This work was supported by grants from the National Institutes of Health (DK30399 and DK50984 to CF), the Deutsche Forschungsgemeinschaft and the Charité Berlin, Germany (STU247/2-1 and 247/3-1 to AS), the National Cancer Institute (CA73413 and CA43703 to JWJ), and the Juvenile Diabetes Research Foundation International (2-2000-390 to SM).