Article Text

Abstract
Objectives: We performed a prospective study to determine whether weight gain predicts future ultrasonographically detected fatty liver (USFL) in a lean adult population.
Methods: Among 15 347 Korean male workers, aged 30–59 years, who participated in a health check-up programme in 2002, a USFL-free cohort of 4246 non-diabetic men was followed until September 2007. Alcohol consumption was assessed by a questionnaire. Weight change for each subject was calculated as the difference between baseline and subsequent measurements. Biochemical tests for liver and metabolic function were done. The primary outcome was ultrasound-diagnosed fatty liver. A standard Cox proportional hazards model and time-dependent Cox model were performed.
Results: During 16 829.7 person-years of follow-up, 622 participants developed USFL. After adjusting for age, the period from visit 1 to visit 2, BMI, HDL-C, triglyceride, uric acid, alanine aminotransferase, and HOMA-IR, the risk for USFL increased with increasing quartiles of weight change (p for trend <0.001). This association remained significant when weight change and covariates, except age and the period from visit 1 to visit 2, were modelled as time-dependent variables. Subjects in the fourth quartile (weight gain ⩾2.3 kg) were at significantly elevated risk for USFL (adjusted hazard ratio (aHR), 1.26; 95% CI, 1.01 to 1.58). These associations did not change, even in normal weight men with a baseline BMI between 18.5 and 22.9 kg/m2 (n = 2186).
Conclusion: Weight gain per se appears to increase the risk for developing USFL. Thus, avoiding weight gain, even among lean adult individuals, can be helpful in preventing this disease.
Statistics from Altmetric.com
Non-alcoholic fatty liver disease (NAFLD) refers to a spectrum of hepatic pathologies that resemble alcoholic liver disease, but without excessive alcohol consumption, and range from simple steatosis to steatohepatitis and cirrhosis.1 Currently, the importance of NAFLD as a cardiovascular risk factor is being increasingly recognised.2 3 4 NAFLD is closely associated with obesity, diabetes, dyslipidaemia, hypertension and insulin resistance (IR), all of which are cardinal features of metabolic syndrome (MetS).4 5 6 Recently, NAFLD has been reported to be associated with atherosclerosis independent of classical risk factors7 8 and to predict the risk of future cardiovascular events.9
Excessive fat deposits in non-adipose tissues, such as the liver, could be a sign of failure of the system that normally acts “by confining the lipid overload to cells specifically designed to store large quantities of surplus calories, the white adipocyte”.10 With the increasing prevalence of obesity, NAFLD has become a growing problem.2 Although NAFLD is more common in obese subjects, NAFLD does occur in non-obese individuals.11 12 Furthermore, even in the normal-weight population, NAFLD is closely associated with several features of IR.12 13 Epidemiological approaches to identify possible risk factors for NAFLD are necessary to develop preventive strategies for this disease. However, at present, prospective data on risk factors for NAFLD in the non-obese population are limited.
Studies have suggested that weight gain during adult life increases the likelihood of adverse outcomes,14 15 16 17 18 and these relationships exist even while a person remains within the healthy weight range of the body mass index (BMI) status.15 16 17 19 To our knowledge, no prospective studies have evaluated an independent association between weight gain and the development of NAFLD, irrespective of BMI status. For a diagnosis of NAFLD, histological proof is required; but in a population-based epidemiological study like ours, it is inappropriate to perform invasive tests such as biopsies. Thus, we chose ultrasonographically detected fatty liver (USFL) as an endpoint in this study, as ultrasonography (US) is considered a practical and reliable method for detecting fatty liver. We performed a prospective study to determine whether weight gain predicts future USFL irrespective of baseline BMI, and whether weight gain, when considering updated values of BMI and other covariates during each follow-up, is a risk factor for USFL.
Materials and methods
Subjects
The study population comprised Korean male workers from one of the largest semiconductor manufacturing companies in Korea and its 13 affiliates.20 21 In Korea, employees are required to participate in annual or biennial health examinations by the Industrial Safety and Health Law. In 2002, 15 347 workers, 30–59 years of age, participated in comprehensive health examinations at a university hospital in Seoul, Korea. A total of 8960 subjects were excluded based on the following, all of which could influence IR or US findings of the liver: 27 subjects had a history of malignancy; 16 subjects had a history of cardiovascular disease; 125 subjects reported current use of anti-hyperlipidaemic drugs; 279 subjects had a fasting blood glucose (FBG) ⩾126 mg/dl or currently used blood glucose-lowering agents; 2498 subjects had an alcohol intake of ⩾20 g/day,22 11 subjects were taking medication for hepatitis; 841 subjects had positive serological markers for hepatitis B or C virus, a reported history of known liver disease (including viral, genetic, autoimmune and drug-induced liver disease), or abnormal liver US findings of chronic liver disease, liver cirrhosis, intrahepatic or extrahepatic cholelithiasis, or abnormal dilatation of the biliary tree; 431 subjects had taken medication within the past year which could affect the development of NAFLD, such as steroids, immune suppressants, anticonvulsants and tetracycline; 5053 subjects had USFL at baseline; 5013 subjects had elevated alanine aminotransferase (ALT) levels (⩾35 U/l) at baseline; and 337 subjects had missing data on their medical histories. Because some individuals met more than one criterion for exclusion, the total number of eligible subjects for the study was 6387 at baseline, of whom 5721 were re-examined at the same hospital annually or biennially, over a period of 4.5 years, until September 2007. Finally, 4246 who had two or more weight measurements recorded prior to USFL assessment were included in the analysis, with a mean (SD) follow-up of 3.96 (0.82) years (fig 1). No specific informed consent was obtained. The informed consent requirement for this study was exempted by the Institutional Review Board at the time the study was in the planning phase because researchers only accessed the database for analysis purposes, which was free of identifying personal information.

Flow diagram. ALT, alanine aminotransferase; USFL, ultrasonographically detected fatty liver.
Measurements
Baseline health examinations performed in 2002 included physical measurements, serum biochemical measurements, medical history, medication use, and a questionnaire that addressed health-related behaviours.20 Questions pertaining to alcohol intake included frequency of alcohol consumption on a weekly basis and the usual amount consumed on a daily basis. Current smokers were identified based on self-report. Weekly frequency of moderate- or vigorous-intensity physical activity was asked. These variables were assessed at each visit.20
Blood specimens were sampled from the antecubital vein after more than 12 h of fasting. Serum levels of FBG, total cholesterol (TC), triglycerides (TG), low-density lipoprotein-cholesterol (LDL-C), high-density lipoprotein-cholesterol (HDL-C), γ-glutamyltransferase, ALT, aspartate aminotransferase, and alkaline phosphatase levels were measured using the Bayer Reagent Packs on an automated chemistry analyser (Advia 1650™ Autoanalyzer; Bayer Diagnostics, Leverkusen, Germany). Measurement techniques included the hexokinase method for glucose, an enzymatic colorimetric assay for LDL-C, HDL-C, TC and TG, and an immunoradiometric assay (Biosource, Nivelles, Belgium) for insulin. IR was assessed with the homeostasis model assessment of insulin resistance (HOMA-IR), calculated as (fasting glucose × fasting insulin)/22.5. High sensitivity-C reactive protein (hsCRP) was analysed by particle-enhanced immunonephelometry with the BNII™ System (Dade Behring, Marburg, Germany) using a lower detection limit of 0.175 mg/l. The clinical laboratory participates annually in inspections and surveys by the Korean Association of Quality Assurance for Clinical Laboratories and has been accredited for quality control and performance of various measurements.
Trained nurses measured sitting blood pressures with a standard mercury sphygmomanometer. Body weight was measured with light clothing and without shoes to the nearest 0.1 kg using a digital weight scale. Height was measured to the nearest 0.1 cm. BMI was calculated as the weight in kg divided by the height, in metres squared.
The diagnosis of fatty liver (FL) was based on the results of abdominal US with a 3.5 MHz transducer (Logic Q700 MR; GE, Milwaukee, Wisconsin, USA).21 US studies were carried out by three experienced radiologists who were unaware of the aims of the study and blinded to the laboratory values; images were captured in a standard fashion with the patient in the supine position with the right arm raised above the head.21 Of the four known US criteria (hepatorenal echo contrast, liver brightness, deep attenuation, and vascular blurring),23 participants were required to have hepatorenal contrast and liver brightness for the diagnosis of FL.21 24 Based on computer-generated random samples among the stored images, there was good agreement on FL diagnosis between the radiologists (agreement 99%, κ = 0.98).21
The ATP III proposed the following five abnormalities to define MetS:25 (1) abdominal obesity; (2) FBG ⩾6.1 mmol/l; (3) TG ⩾1.69 mmol/l; (4) HDL-C <1.04 mmol/l; and (5) blood pressure ⩾130/85 mm Hg. Because waist circumference measurements were not available for all subjects, we substituted overall adiposity (ie, a BMI of ⩾25 kg/m2), which has been proposed as a cut-off for the diagnosis of obesity in Asians,26 for abdominal obesity. Subjects with three or more of the above five abnormalities were considered to have MetS.
Statistical analysis
The χ2-test and one-way ANOVA were used to analyse the statistical differences between the characteristics of the study participants and the degree of weight change. The distribution of continuous variables was evaluated and appropriate transformations were done in the analysis, as needed.
For incident USFL cases, the time of USFL onset was assumed to be the midpoint between the assessment at which USFL was diagnosed and the previous assessment. For the linear trends of risk, the number of quartiles was used as a continuous variable and tested on each model. We confirmed that the proportional hazards assumption was not violated for other covariates as well as weight change categories and risk for USFL by using a graph of estimated Ln(−Ln) survival, stratified by category.27
The association between weight change and the risk of USFL was assessed using Cox proportional hazards modelling with weight change as a time-dependent categorical variable.
Weight changes were calculated for each subject as the differences in weight from visit 2 to baseline (visit 1), from visit 3 to visit 2, from visit 4 to visit 3, from visit 5 to visit 4, and from visit 6 to visit 5. Similarly, changes in other covariates were calculated for each subject as the difference in each covariate.
Weight change was categorised into the following quartiles: <−0.9, −0.9 to 0.5, 0.6 to 2.2, and ⩾2.3 kg. We used weight change as a time-dependent categorical variable to compare the risk for USFL across the quartiles of weight change over time since the baseline of the study. Exposure categories are represented in the model by dummy variables. Person-years were calculated as the sum of the follow-up duration from visit 2 until the assumed time of USFL development or until the final examination of each individual. We first estimated hazard ratios with 95% CI for the association of weight change from visit 1 to visit 2 with the risk of USFL by using standard Cox proportional hazards models, adjusted for baseline potential covariates, such as age, BMI, TG, HDL-C, HOMA-IR, uric acid, ALT and smoking, and then developed the second model adjusting for age, period of weight change assessment, and changes in the above covariates from visit 1 to visit 2. To incorporate repeated measurements, we recalculated all hazard ratios using extended Cox proportional hazards models simultaneously adjusting for the above covariates as time-dependent variables.
In a sensitivity analysis, we also examined the association of weight change with incident hyper-transaminasaemia as a surrogate marker of NAFLD (supplementary tables 2 and 3). We defined hyper-transaminasaemia as a serum ALT level ⩾35 U/l, which is the value in the highest quartile of our study population.20 Because the presence of elevated liver enzymes in patients with NAFLD can generally be considered to be advanced disease,28 we performed additional analyses using USFL plus elevated ALT as an outcome variable. Thus, separate analyses were performed on three sets as endpoints: (1) USFL only, (2) elevated ALT only, and (3) USFL plus elevated ALT.
Statistical data analysis was performed with SAS, version 9.1. All the reported p values are two-tailed, and statistical significance was set at <0.05.
Results
At baseline, the mean age and BMI of the 4246 participants were 36.7 (SD 4.8) years and 22.6 (SD 2.4) kg/m2, respectively. Of the 6387 eligible participants at baseline (fig 1), 2141 who were not included in the analytic cohort, were on average 0.3 year older and more likely to be current smokers than those in the analytic cohort. All other variables in those subjects not included in the analytic cohort were not significantly different from those subjects in the analytic cohort (data not shown). The prevalence of missing data in our cohort during follow-up was very low, and therefore, unlikely to introduce substantial bias, regardless of the basis for the missing data.
The baseline characteristics of the study participants in relation to the weight change category are illustrated in table 1. The weight loss category group (weight change <−0.9 kg) had higher average values of BMI, SBP, diastolic blood pressure, fasting blood glucose, TC, LDL-C, TG, insulin, HOMA-IR, uric acid and hepatic enzymes than the reference category group (weight change of −0.9 to 0.5 kg). The proportions of MetS and obesity were inversely associated with weight change.
Baseline characteristics of study participants by weight (kg) over the 1.7 years from visit 1 to visit 2
Table 2 shows the risk of developing USFL according to the baseline BMI categories. During 16 829.7 person-years of follow-up, 622 participants developed USFL. We first analysed the relationships between baseline BMI and incident USFL adjusting for age only; then we adjusted for age, plus HDL-C, TG, uric acid, ALT, HOMA-IR and smoking. In both age-adjusted and multivariate-adjusted analyses, higher baseline BMI categories predicted the incidence of USFL in a graded and dose–response manner (p for trend <0.001). Furthermore, as shown in the model using time-dependent variables, these associations remained significant when BMI was modelled as a time-dependent categorical variable with additional adjustments for all of the above confounding factors as time-dependent variables, with the exception of age. When analysed in the model using time-dependent variables, the adjusted hazard ratio (aHR) of BMI categories increased, compared to the previous multivariate-adjusted model, which could suggest that more recent BMI levels are more strongly associated with incident USFL than baseline values, after taking into account of all other factors.
Association between baseline body mass index and the development of fatty liver
We also examined the associations between BMI categories and the development of USFL plus elevated ALT. During 17 459.5 person-years at risk, 159 participants developed FL. These analyses did not qualitatively change any of the observed associations.
Table 3 shows the association between incident USFL and weight change from visit 1 to visit 2. The time of weight change assessment between visit 1 and visit 2 differed among study subjects; and the average period between visit 1 and visit 2 was 1.7 (SD 0.6) years with a total of 9601.1 person-years at risk. In both age-adjusted and multivariate-adjusted analyses, the risk for USFL increased with increasing quartiles of weight change (p for trend <0.001). This association remained significant when weight change was modelled as a time-dependent categorical variable with additional adjustments for all of the confounding factors, except age and the period from visit 1 to visit 2, as time-dependent variables. Subjects in the fourth quartile (weight gain ⩾2.3 kg) were at a significantly elevated risk for USFL (aHR, 1.26; 95% CI, 1.01 to 1.58). In the age-adjusted and multivariate-adjusted models, the aHR of the weight change categories did not change much. On the other hand, the estimates in the model using time-dependent variables decreased compared to model 1 and model 2.
Association between the development of fatty liver and weight change (kg) over 1.7 years, between visit 1 and visit 2
We also examined the association between weight change and the development of USFL plus elevated ALT. The risk for FL did not increase significantly with increasing quartiles of weight change (p for trend = 0.070), unlike the analyses using USFL only as an outcome variable. Interestingly, subjects with weight loss (weight change <−0.6 kg) had a significantly decreased risk for USFL plus elevated ALT (aHR, 0.59; 95% CI, 0.36 to 0.99).
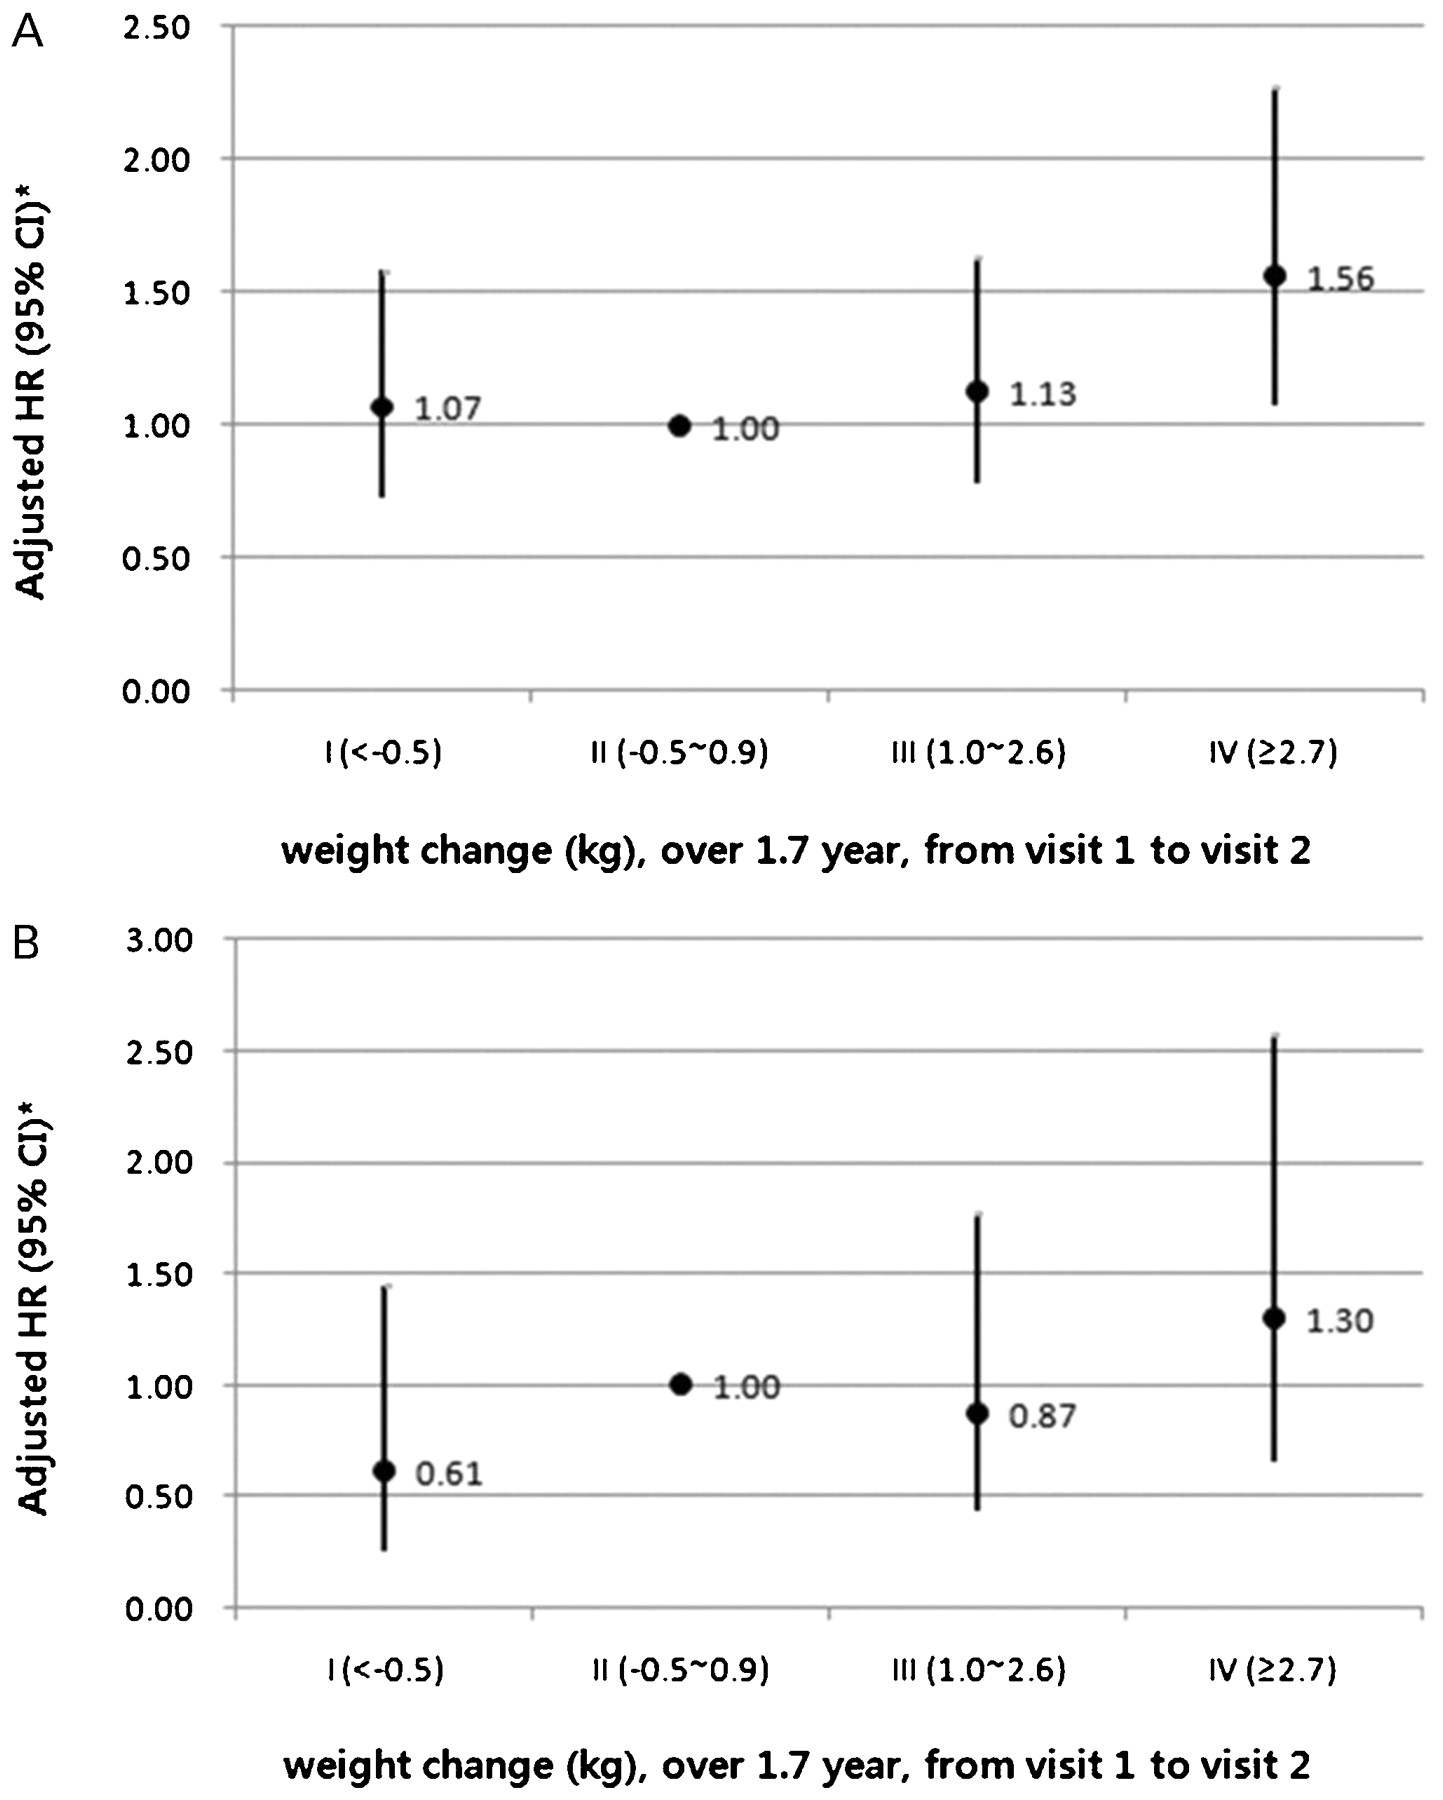
In normal weight men with a baseline BMI between 18.5 and 22.9 kg/m2; weight loss (weight change <−0.5 kg) was not associated with a significantly decreased risk of FL (n = 2186; fig 2). However, in this lean group, the relationship between weight gain and incident USFL remained significant even after further adjustments for hsCRP, γ-glutamyltransferase or incident diabetes. In addition, results were effectively unchanged, even after analyses were restricted to participants without any MetS components at baseline or to those who reported ethanol intake of <20 g per day at follow-up. During follow-up, three new cases with hepatitis B virus (HBV) infection occurred; no cases with hepatitis C virus infection occurred. These three new cases of HBV infection did not develop NAFLD during follow-up. In a sensitivity analysis, we also examined the association of weight change with incident hyper-transaminasaemia as a surrogate marker of NAFLD. These analyses did not qualitatively change any of the observed associations (supplementary figs 1 and 2, and tables 1–3).

(A) Association between the development of ultrasonographically detected fatty liver (USFL) and weight change from visit 1 to visit 2 among normal weight men with a baseline BMI between 18.5 and 22.9 kg/m2 (n = 2186). (B) Association between the development of USFL with elevated ALT and weight change from visit 1 to visit 2 among men of normal weight with a baseline BMI between 18.5 and 22.9 kg/m2 (n = 2186). *Estimated from extended Cox proportional hazard models with weight change as a time-dependent categorical variable adjusted for age, the period from visit 1 to visit 2, and other covariates (BMI, HDL-C, triglycerides, ALT, uric acid, and HOMA-IR) over time as time-dependent variables. ALT, alanine aminotransferase; BMI, body mass index; HDL-C, high-density lipoprotein-cholesterol; HOMA-IR, homeostasis model assessment of insulin resistance.
Discussion
In the present prospective study of non-diabetic Korean men, weight gain was significantly associated with the development of USFL, as previous studies have reported.24 29 In our study, weight gain was an independent predictor of USFL in a dose-dependent manner, even in normal weight participants. The relationship between weight gain and an increased risk of USFL was irrespective of the baseline BMI and various potential confounders, including smoking, alcohol consumption, hsCRP, HOMA-IR and metabolic components (FBG, lipids, and blood pressure). Furthermore, even after considering updated values of BMI and other covariates at each follow-up over time, weight gain consistently predicted future USFL. These findings suggest that, besides BMI, weight gain per se may be one of the risk factors for USFL and can negatively influence health.
The mechanisms by which weight gain increases the risk of USFL are yet to be elucidated. However, there might be several explanations underlying the effects of weight gain on USFL. Previous studies have shown that weight gain in adulthood increases the risk of chronic diseases.14 15 16 17 18 Even minimal-to-moderate weight gain in adulthood increases this risk, influencing cardiovascular and metabolic risks.15 16 17 19 Progressive increases in body fat and decreases in fat-free mass during adulthood have been noted,30 and this change could occur, even in the absence of weight gain. In addition, relatively small changes in weight could have a significant effect on body fat.31 Thus, in susceptible individuals weight gain could represent increased fat followed by excessive fat accumulation in the liver when the capacity for fat storage is reached.
IR may be another mechanism that could be involved in the development of USFL from weight gain. Previous studies of short-term weight changes (3.5 years) among Pima Indians showed that weight gain was associated with an increase in IR.30 Interestingly, a recent study has shown that IR develops during weight gain within the normal range of body weight.32 Since fat accumulation in the liver seems to be a very early event in the course of IR,13 the aforementioned inter-relationships between weight gain, IR and NAFLD could be the possible association between weight gain and the development of USFL.
Analyses using a different set of criteria of USFL plus elevated ALT, showed a non-significant association between weight gain and incident FL. This may reflect the effect of weight change on the pathways to the development of simple steatosis, which may differ from the advanced stage. Although the progression of steatosis to an advanced stage remains poorly understood,25 33 additional factors other than fat gain might be required for the development of a more advanced form of NAFLD. However, the difference in our results can be attributed, in part, to an insufficient follow-up period. Previous studies from simple steatosis to cirrhosis or liver-related mortality have been observed over a median follow-up of approximately 8 years.33 34 Our median follow-up was 4.02 years. In addition, as a standard practice, employees who present with USFL are more likely to be encouraged by the examining physician at each visit to implement dietary changes, exercise interventions, or smoking cessation, compared to those who are healthy. Interestingly, when using the criteria of USFL plus elevated ALT, our study showed that weight loss over time was associated with a decreased risk of developing FL. Previous studies have shown a beneficial effect of weight loss on NAFLD,35 36 but focused on the regression of already existing NAFLD rather than the reduction of incident NAFLD. Our findings are the first to show a possible effect of weight loss on preventing future FL, especially when using the USFL plus elevated ALT criteria. However, because no information on weight loss intention was recorded, we could not differentiate between the effects of intentional and unintentional weight loss. Likewise, adiposity was not directly assessed by more accurate methods, such as dual-energy x ray, and information on data on concomitant patterns of body composition and fat distribution was not available in our study. A further study on the role of weight change on the development of NAFLD with a focus on the change in fat proportion, fat distribution, and the time course of the weight change is required.
There are several limitations in the present study. First, histological proof (ie, biopsy) of NAFLD was not included as it is not appropriate to perform invasive tests in a population-based epidemiological study.37 However, since fat deposition in the liver may be satisfactorily diagnosed non-invasively with US, or other imaging tests, many population-based studies have used the ultrasound examination.38 39 40 Furthermore, when we substituted elevated ALT as a surrogate marker of NAFLD as an outcome variable, these associations between weight change and incident FL did not change qualitatively. Second, the quantity of alcohol intake was self-reported and, thus, was likely underestimated. However, the relationship between weight gain and risk of incident USFL was similar and significant even after exclusion of participants with increased serum GGT of ⩾40 U/l (75th percentile of GGT in our study population),20 a commonly used marker of alcohol consumption, during follow-up (data not shown). Third, we were unable to obtain dietary information, although it could be related to FL.41 Finally, the characteristics of our participants were all middle-aged and healthy Korean men, which may limit the generalisation of the findings to non-Korean populations and/or females.
In conclusion, our findings indicate that, besides BMI, weight gain per se appears to be a risk factor for developing USFL. This study contributes to our understanding of the clinical presentation of NAFLD, particularly in the normal-weight population, and raises the possibility that avoiding weight gain, even among lean adult individuals, can be helpful in preventing this disease.
Acknowledgments
We thank T S Choi of Kangbuk Samsung Hospital (Information System, SDS, Seoul, Korea) for his help with technical support in gathering data, and also Dr L Kim (Edmonton, Alberta, Canada) for her help with the revision.
REFERENCES
Supplementary materials
Web only appendix for 58;10:1419
Files in this Data Supplement:
Footnotes
Competing interests None.
Provenance and Peer review Not commissioned; externally peer reviewed.
Ethics approval This study was approved by the Institutional Review Board of Kangbuk Samsung Hospital in April 2008 (IRB no. C0820).
▸ Supplementary figures and tables are published online only at http://gut.bmj.com/content/vol58/issue10
Linked Articles
- Digest