Article Text

Abstract
Background and aims The incidence of oesophageal adenocarcinoma (OAC) has been increasing rapidly with a dismal survival rate of less than 20%. Understanding the genomic aberrations and biology of this cancer may enhance disease interventions. This study aimed to use genome-wide genomic and expression data to enhance the understanding of OAC pathogenesis and identify groups with differential outcomes.
Methods Array-comparative genomic hybridisation (aCGH) analysis was carried out on 56 fresh frozen OAC resection samples with long-term clinical follow-up data. Samples with aberrations were further analysed with whole-genome single-nucleotide polymorphism arrays to confirm aCGH findings. Matched gene expression microarray data were used to identify genes with high copy number–expression correlations. Nested-multiplex PCR on DNA from microdissected specimens and fluorescence in situ hybridisation assays were used for target validation. Immunohistochemistry on the same cohort and independent samples (n=371) was used for subsequent validation. Kaplan–Meier survival analyses were performed based on aCGH data after unsupervised K-means clustering (K=5, 50 iterations) and immunohistochemistry data.
Results aCGH identified 17 common regions (>5% samples) of gains and 11 common regions of losses, including novel regions in OAC (loci 11p13 and 21q21.2). Integration of aCGH data with matched gene expression microarray data highlighted genes with high copy number–expression correlations: two deletions (p16/CDKN2A, MBNL1) and four gains (EGFR, WT1, NEIL2, MTMR9). Immunohistochemistry demonstrated protein over-expression of targets with gains: EGFR (10%), WT1 (20%), NEIL2 (14%) and MTMR9 (25%). These targets individually (p<0.060) and in combination had prognostic significance (p=0.008). On the genomic level, K-means clustering identified a cluster (32% of cohort) with differential log2 ratios of 16 CGH probes (p<4×10⁻⁷) and a worse prognosis (median survival=1.37 years; p=0.015).
Conclusions Integration of aCGH and gene expression data identified copy number aberrations and novel genes with prognostic potential in OAC.
- Adenocarcinoma
- array-comparative genomic hybridisation
- gene expression microarray profiling
- oesophagastric junction
- prognosis
- oesophageal cancer
Statistics from Altmetric.com
- Adenocarcinoma
- array-comparative genomic hybridisation
- gene expression microarray profiling
- oesophagastric junction
- prognosis
- oesophageal cancer
Significance of this study
What is already known about this subject?
Array-comparative genomic hybridisation and gene expression microarray profiling have been used separately to identify molecular aberrations in small cohorts of oesophageal adenocarcinoma patients.
Losses and deletions of CDKN2A/p16 are well established in oesophageal adenocarcinoma.
Amplification and over-expression of EGFR is known to link to a poorer prognosis in a subgroup of oesophageal adenocarcinoma patients, and represents a potential targeted therapeutic agent. ERBB2 is a known therapeutic agent in advanced gastric or gastro-oesophageal junction cancer.
What are the new findings?
Using unsupervised clustering of array-comparative genomic hybridisation (aCGH) data, we discovered 16 CGH probes including six novel genes that conferred a poorer prognosis to a subgroup of oesophageal adenocarcinoma patients.
We integrated genome-wide datasets from aCGH and gene expression microarray profiling in this study, and identified three novel molecular targets not previously associated with oesophageal adenocarcinoma: WT1, NEIL2 and MTMR9. This is the largest cohort of individuals with OAC to be investigated using aCGH to date, which has combined genome-wide aCGH and gene expression microarray data.
Extensive validation showing amplifications and subsequent over-expression of our targets (EGFR, WT1, NEIL2, MTMR9) in 10–25% of our patient cohort and an independent cohort demonstrated the ability of these targets to stratify patients into different prognosis groups.
How might it impact on clinical practice in the foreseeable future?
Novel molecular targets identified from our study could be further validated as prognostic biomarkers to enhance clinical management of patients with oesophageal adenocarcinoma, by stratifying patients into different survival groups. In addition, like EGFR in lung cancer, some of these targets such as WT1 and NEIL2 have the potential to be exploited therapeutically in the future.
Introduction
Oesophageal adenocarcinoma (OAC), including tumours of the gastro-oesophageal junction, has increased 6-fold in the West over the last 30 years.1 The rapid rise in incidence is compounded by the poor prognosis, with a 5-year survival of <10%.2 This poor outcome reflects the late presentation and current limitations in clinical management of these patients. An understanding of the molecular changes underlying this cancer is anticipated to lead to improved clinical management and outcomes.
Chromosomal aberration is one of several mechanisms that can lead to gene dysregulation and has long been known to play a critical role in the pathogenesis of human cancers.3 The identification of regions of genomic gains and losses has resulted in the discovery of novel oncogenes4 and tumour suppressor genes (TSGs), respectively.5 Similar to other cancers, common high level-amplifications (≥25% of cases) have been frequently reported in OAC. The common regions of amplification on 8q (37% of cases)6 and 17q (39% of cases)7 map to the oncogenes v-myc myelocytomatosis viral oncogene homologue (C-MYC) and v-erb-b2 erythroblastic leukaemia viral oncogene homologue 2 (ERBB2). While the exact role of MYC in the pathogenesis of OAC is not defined, ERBB2 amplifications have been shown as a promising target for personalised treatment in the ToGA trial.8 One of the best characterised chromosomal aberrations in OAC is the loss of heterozygosity (LOH) of the TSG TP53 (>50% of cases), which is a powerful predictor of disease progression.9 Finally, two genes frequently reported to have homozygous deletions (HDs) in OAC are the well-known TSG p16/CDKN2A (20% of cases, with co-deletion of MTAP)10–11 and fragile histidine triad (FHIT) (20–50% of cases).12–14 In addition to being early indicators of OAC development, targeting HDs may lead to improved treatment regimes for OAC patients with these deletions, as tested in clinical trials for MTAP-deficient tumours.15
In the past decade, DNA copy number gains/amplifications on chromosomes 1q, 3q, 7p, 7q, 8q, 17q and 20q along with copy number losses (including LOH and HDs) on 3p, 4q, 5q, 9p, 14q, 16q, 17p and 18q have been reported in OAC using genome-wide approaches (summarised in table S.1, in the online appendix). Array-comparative genomic hybridisation (aCGH) has proven to be an extremely useful tool in identifying novel molecular targets. Following our hypothesis that alterations in copy number that affect gene expression levels will be likely to modify protein expression, the integration of expression data with copy number changes allows the changes most likely to be causally implicated in tumour evolution to be identified. Therefore, data from an aCGH platform were integrated with corresponding gene expression microarray profiles of 56 fresh frozen OAC resection samples in this study. Following integrated analysis of aGH and expression data, only targets with significant expression changes following copy number aberrations were further validated on the DNA and protein level, and tested for prognostic relevance. Finally, samples were segregated into groups with similar copy number profiles and a cluster with a significantly worse prognosis was identified.
Materials and methods
Sample collection
Between June 1992 and June 2000, 56 snap frozen samples from oesophago-gastric cancer patients undergoing resection with curative intent were collected by Professor Derek Alderson (Bristol Royal Infirmary, UK). Clinical information of these patients were summarised in table S.2 (in the online appendix). All clinical diagnoses were confirmed by two expert pathologists according to recommended guidelines.
Patients
The clinical data for the 56 OAC patients are shown in table S.2. The average age at diagnosis was 69 years (range: 45–89) and the minimum follow-up was 5 years for surviving patients. There was a range of disease stages and differentiation grades (few patients with stage IV disease since oesophagectomy was performed with curative intent). In keeping with the historical nature of the cohort, the majority (53/56) of the patients did not have prior chemotherapy treatment giving an unbiased assessment of genomic aberrations.
aCGH analysis
All samples prepared for aCGH had >70% tumour cellularity. DNA was extracted from ten 30 μm sections of each tumour using standard protocols (supplement S.3 in the online appendix). Labelling was performed using BioPrime DNA labelling kit reagents (Invitrogen, Carlsbad, California, USA) according to protocols described previously.16 Labelled OAC DNA samples were hybridised, along with a common reference sample obtained from a pool of 20 leucocyte DNA samples of the same sex, to customised 60-mer oligonucleotide microarrays containing 28830 unique map positions (Human May 2004 assembly (hg17)).17 Combined colour switch experiments were performed, whereby labels for DNA from human male and female were reversed, to generate precise ratios for these experiments: mean log2 ratio=0.03 and SD=0.29. Data from aCGH experiments were processed using BlueFuse (v3.4 Build 5836; BlueGnome, Cambridge, UK) and analysed using the snapCGH Bioconductor package within the R statistical framework (version 2.3.1). Normalised data for the 56 tumours described in this study are available from the Gene Expression Omnibus (GEO) database (GSE20154). Data from aCGH were normalised after background substraction using the region detection algorithm swatCGH (http://www.bio.cam.ac.uk/∼ir210/swatCGH/), which was then used to detect common regions (≥5% samples) of aberrations covering ≥5 oligonucleotides. This threshold was used to allow a comprehensive analysis of genomic aberrations present while eliminating those only affecting one or two cases.
Gene expression microarray profiling
Gene expression microarray analysis of the RNA from these tumours was performed previously (GEO accession number GSE19417).18 In brief, RNA was extracted from ten 30 μm sections of each tumour using Trizol according to the manufacturer's instructions (Invitrogen). Extracted RNA was then amplified using a modified MMLV-RT-mediated reverse-transcription protocol or a 2× UniAmp protocol using a modification of Ambion's MessageAmp II kit (Ambion, Applied Biosystems, Foster City, California, USA). Resulting RNA was labelled with cyanine dyes and hybridised to a custom made Agilent 44K 60-mer oligo-microarray (Agilent Technologies, Santa Clara, California, USA). Data from expression arrays were then normalised using external spike-in controls.18
Single-nucleotide polymorphism array
In view of advances in available technology, Illumina HumanCytoSNP-12 Beadarray v2.0 (Illumina, Inc) was used for validation purposes of nine selected cases post-aCGH analysis (following the manufacturer's protocol). Briefly, 500 ng of genomic DNA extracted from frozen tumour tissues were denatured and amplified at 37°C overnight. The amplified DNA was fragmented and precipitated at 4°C, resuspended in hybridisation buffer, and hybridised to HumanCytoSNP-12 chips at 48°C overnight. Non-hybridised DNA and non-specific hybridisation were washed away, and captured DNA was used as template for one-base extension of the locus-specific oligos on BeadChips. All single-nucleotide polymorphism (SNP) data were analysed and exported by BeadStudio v2.0 (Illumina). SNP data of this study are publicly available (GEO accession number GSE 25201).
Integrated analysis of aCGH and gene expression profiling data
All genes within identified common regions of aberrations from aCGH data were matched to their respective expression levels based on expression microarray profiles. Genes whose expression levels were >1.5-fold up/downregulated in tumours with aberrations were plotted against their respective aCGH log2 ratios to select genes with the best copy number–expression correlations. Genes displaying a high correlation between expression and DNA copy number (log2 ratio >0.32, ie, mean log2 ratio + SD; and fold-change >6.5, ie, greater than 4×1.5-fold change) were further classified to justify their importance in OAC using Santarius et al's approach,19 which classifies the relevance of genomic and expression changes in genes. Identified targets were validated using immunohistochemistry (IHC) assays.
Laser microbeam microdissection and nested-multiplex PCR
Laser microbeam microdissection (LMM) on 7 μm cryostat sections of frozen OAC sample stained with cresyl violet (Fisher Scientific, Pittsburgh, Pennsylvania, USA) was carried out using the Zeiss P.A.L.M. Laser MicroBeam system (Microlaser Technologies GmbH, Bernried, Germany) following the procedure described previously.20 Selected areas with tumour cells were specifically removed from the sections and transferred to a 0.5 ml microfuge tube cap for subsequent DNA extractions. Microdissected cells were incubated in proteinase K buffer (10 mM Tris pH 7.4, 10 mM EDTA, 150 mM NaCl and 0.4% SDS) and 40 μg/ml proteinase K (Invitrogen) at 65°C (1 h) and then at 37°C (overnight). DNA extraction was carried out using standard phenol/chloroform extraction method. Multiplex PCR was carried out with standard PCR conditions, using 1 mM of primers of the genes of interest, alongside a control primer pair (AQP3). Nested-multiplex PCR uses two rounds of PCR for greater genomic DNA amplification. The second round PCR was carried out using products from the first round PCR diluted 1:20 using nuclease-free water. Detailed protocols are available in supplement S.3. Products from nested-multiplex PCR were sequenced to confirm results (figure S.4 in the online appendix).
FISH on tumour touch-imprints
Touch-imprints were produced by touching frozen tumour samples onto the surface of poly-l-lysine coated slides (Polysciences, Inc. Baden-Württemberg, Germany), air-drying (10 min), fixing in 3:1 methanol:acetic acid (15 min), dehydrating in ethanol series (70%, 90%, 100%; 3 min each) and incubating in dark at 37°C (overnight). Bacterial artificial chromosomes (BACs; CHORI BACPAC Resources, Oakland, California, USA) and DNA from plasmids probing for centromeres (Resources for Molecular Cytogenetics, University of Bari, Italy) were labelled indirectly by the nick-translation method using digoxigenin-/biotin-labelled dUTPs (Roche, Lewes, UK). Detection was carried out using sheep fluorescein isothiocyanate (FITC)-conjugated anti-digoxigenin (Roche)/Cy5-conjugated streptavidin (GE Healthcare, Amersham, UK) and goat-biotinylated anti-streptavidin (Vector Labs, Peterborough, UK) antibodies. 100 nuclei per slide were counted for analysis of HDs. Metaphase preparation of lymphocyte cell line DRM/M62 was used as positive controls for all fluorescence in situ hybridisation (FISH) assays (data not shown), whereby two paired centromere-target gene FISH signals were detected in all nuclei and metaphase chromosomes. See supplement S.5 (in the online appendix) for probe and imaging details.
Immunohistochemistry on tissue microarrays
The tissue microarrays (TMAs) available represent 2 mm×2 mm areas in triplicates typical for the tumour as identified by expert gastro-intestinal pathologists. TMAs of samples from external datasets (n=371) were available resulting from collaboration with the Oesophageal Cancer Clinical and Molecular Stratification (OCCAMS) study group.18 IHC was performed on a Bond System (Leica Microsystems (UK) Ltd, Milton Keynes, UK) according to manufacturer's recommendations after confirming antibody specificities by western blotting (data not shown), followed by optimisation on positive control cell blocks and oesophageal tissue sections. For antibody sources and detailed scoring of IHC assays see supplement S.6 (in the online appendix).
External validation of the aCGH signature
Copy number information was obtained from the dataset by Nancarrow et al14 (GEO accession number GSE 10506). This is the only aCGH dataset currently publicly available with patient survival information. Following the thresholds obtained by Nancarrow et al for genomic gains (logR >0.2) and losses (logR <−0.35), each CGH clone was scored (table S.7 in the online appendix) and subsequently analysed to determine their prognostic significance.
Statistics
Unsupervised hierarchical clustering (50 iterations) using K-means clustering method was performed using average linkage, euclidean distance measure, K=5 (reproducibility >50%; Gene Cluster 3.0, C Clustering Library version 1.47). Fisher's exact test was used to compare clinical variables of the clusters generated and a modified t-test (with adjusted Bonferroni correction) was employed to identify CGH probes with significantly different log2 ratios. Survival differences were assessed using log-rank test. Statistical significance was set at p<0.050.
Results
aCGH identifies novel genomic regions of aberrations
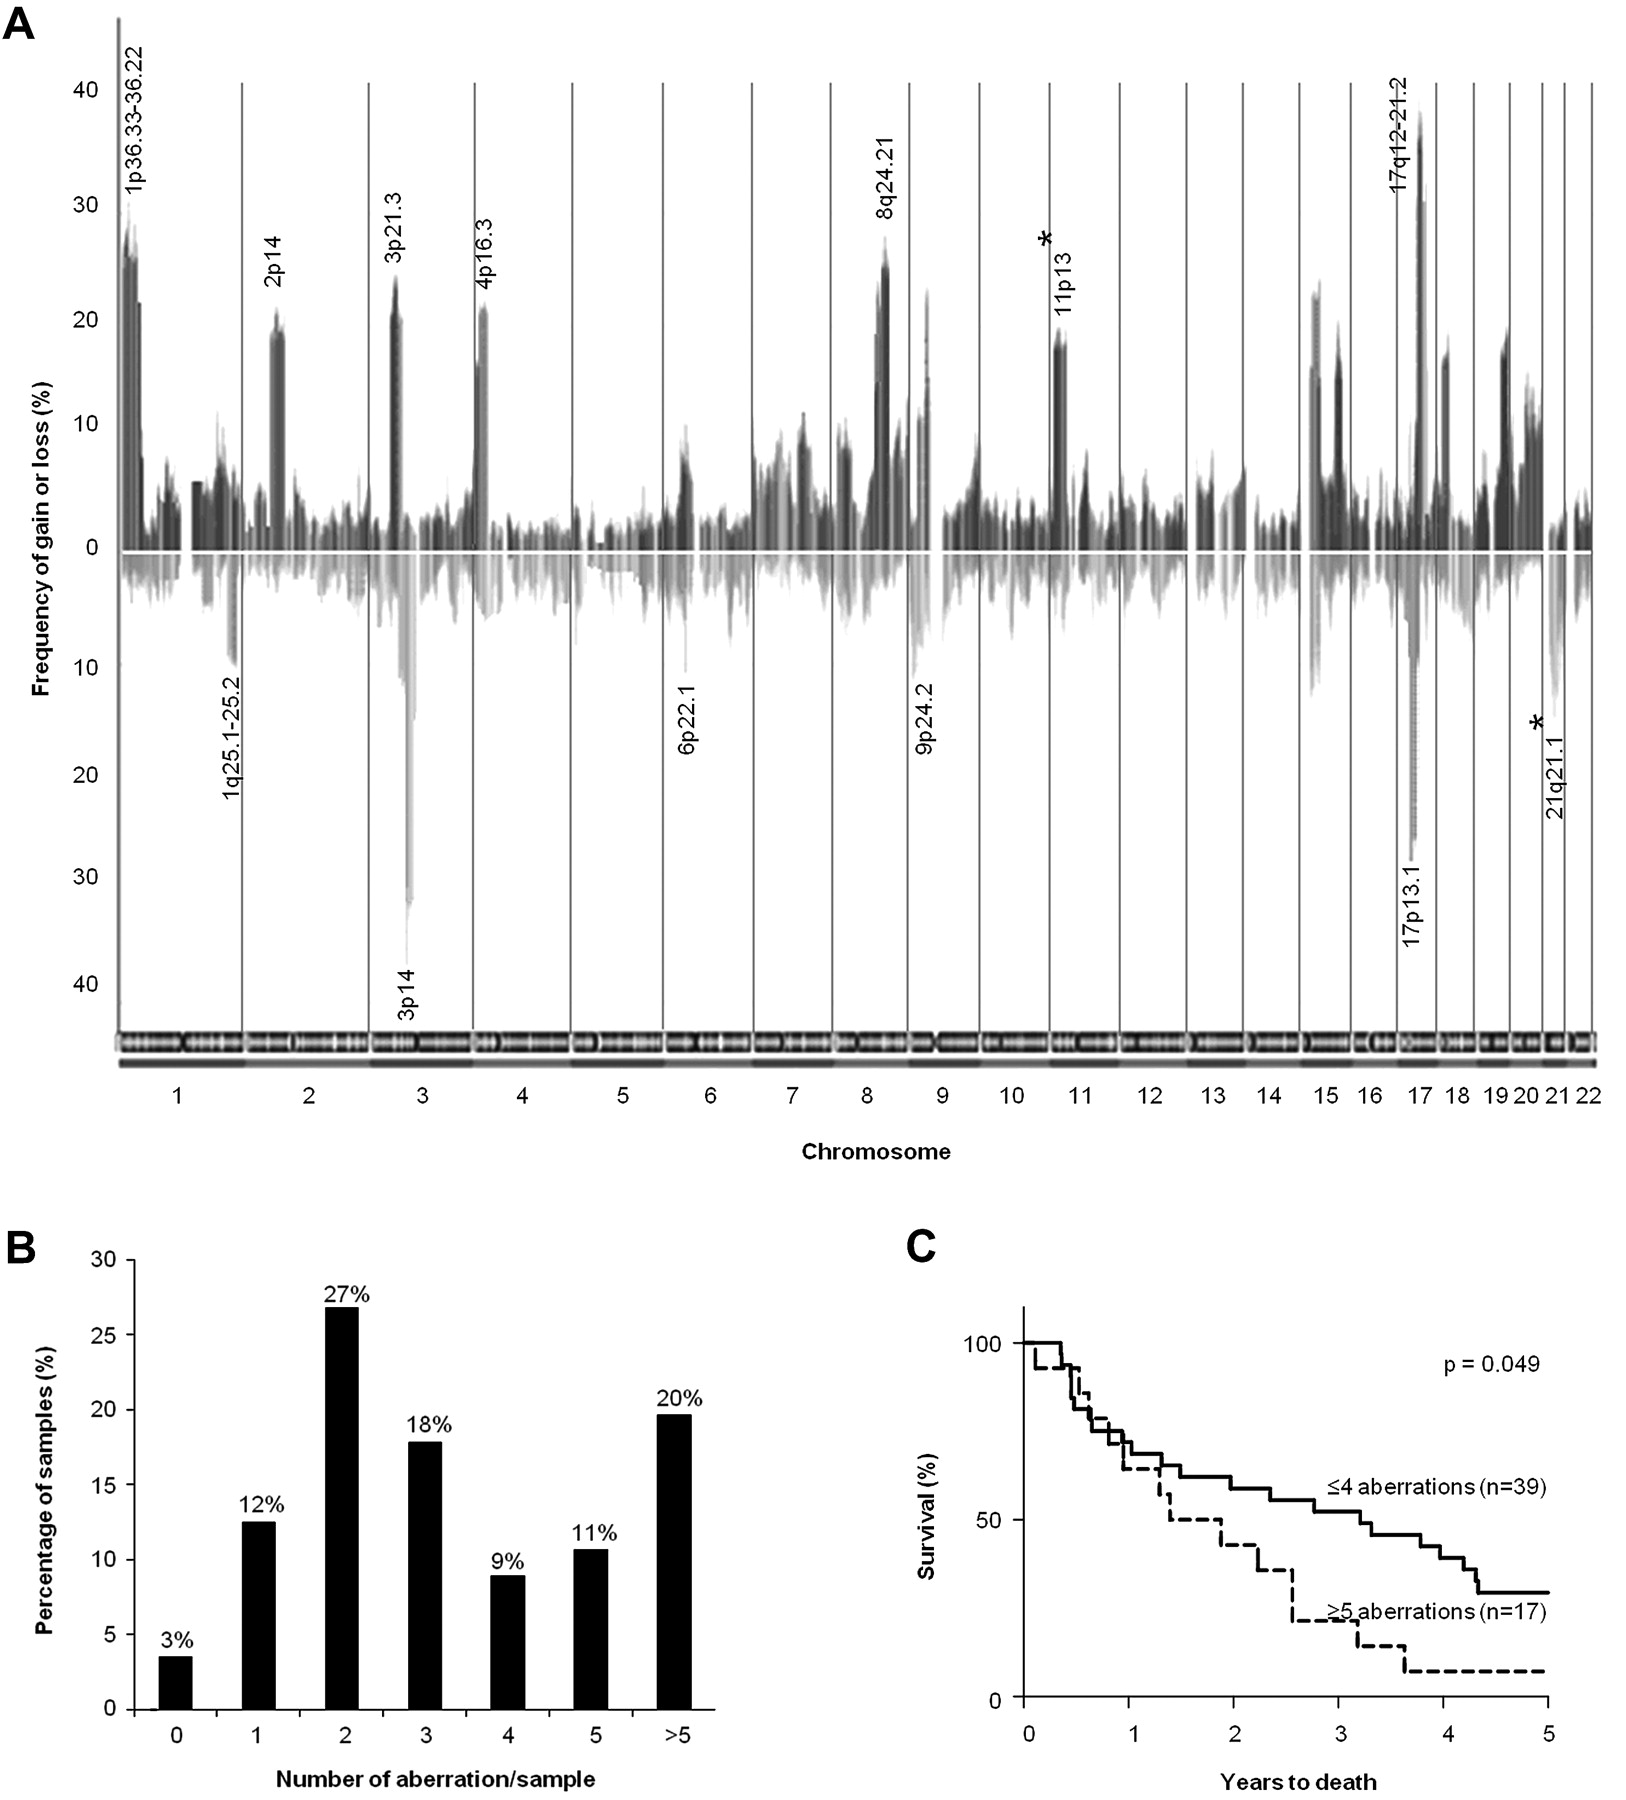
Genomic gains and losses were detected on all chromosomes. The mean frequency of gains across the whole genome was 11% (SE of mean, SEM=0.4%, 95% CI: 9.9 to 12.1%) and the mean frequency of losses was 8.2% (SEM=0.5%, 95% CI: 7.1 to 9.3%; figure 1A). Analysing these data revealed 28 common regions of aberrations (regions and genes with >1.5-fold expression changes are listed in tables 1 and 2). Based on the 28 common regions of aberrations identified, 69% of samples had <5 copy number alterations (figure 1B). The group with ≥5 alterations (31% of samples) had a significantly poorer clinical prognosis (p=0.049; figure 1C).

(A) Frequency of all significant gains and losses (>5% of samples). Bars above the x-axis denote copy number gains and bars below the x-axis indicate copy number losses. Chromosomal boundaries are denoted by vertical lines and chromosomes are represented along the x-axis. The loci most frequently gained (>20% of samples) and lost (>10% of samples), as well as novel loci (asterisked), are annotated. Sex chromosomes were excluded in our analysis and hence not shown. (B) Correlation between recurrent aberrations and survival: Breakdown of samples having different numbers of aberrations based on 28 common regions identified. (C) Kaplan–Meier plot of patients with oesophageal adenocarcinoma (OAC) grouped according to the number of common regions of aberrations involved per sample.
Common regions (≥5% samples) of genomic gains
Common regions (≥5% samples) of genomic losses
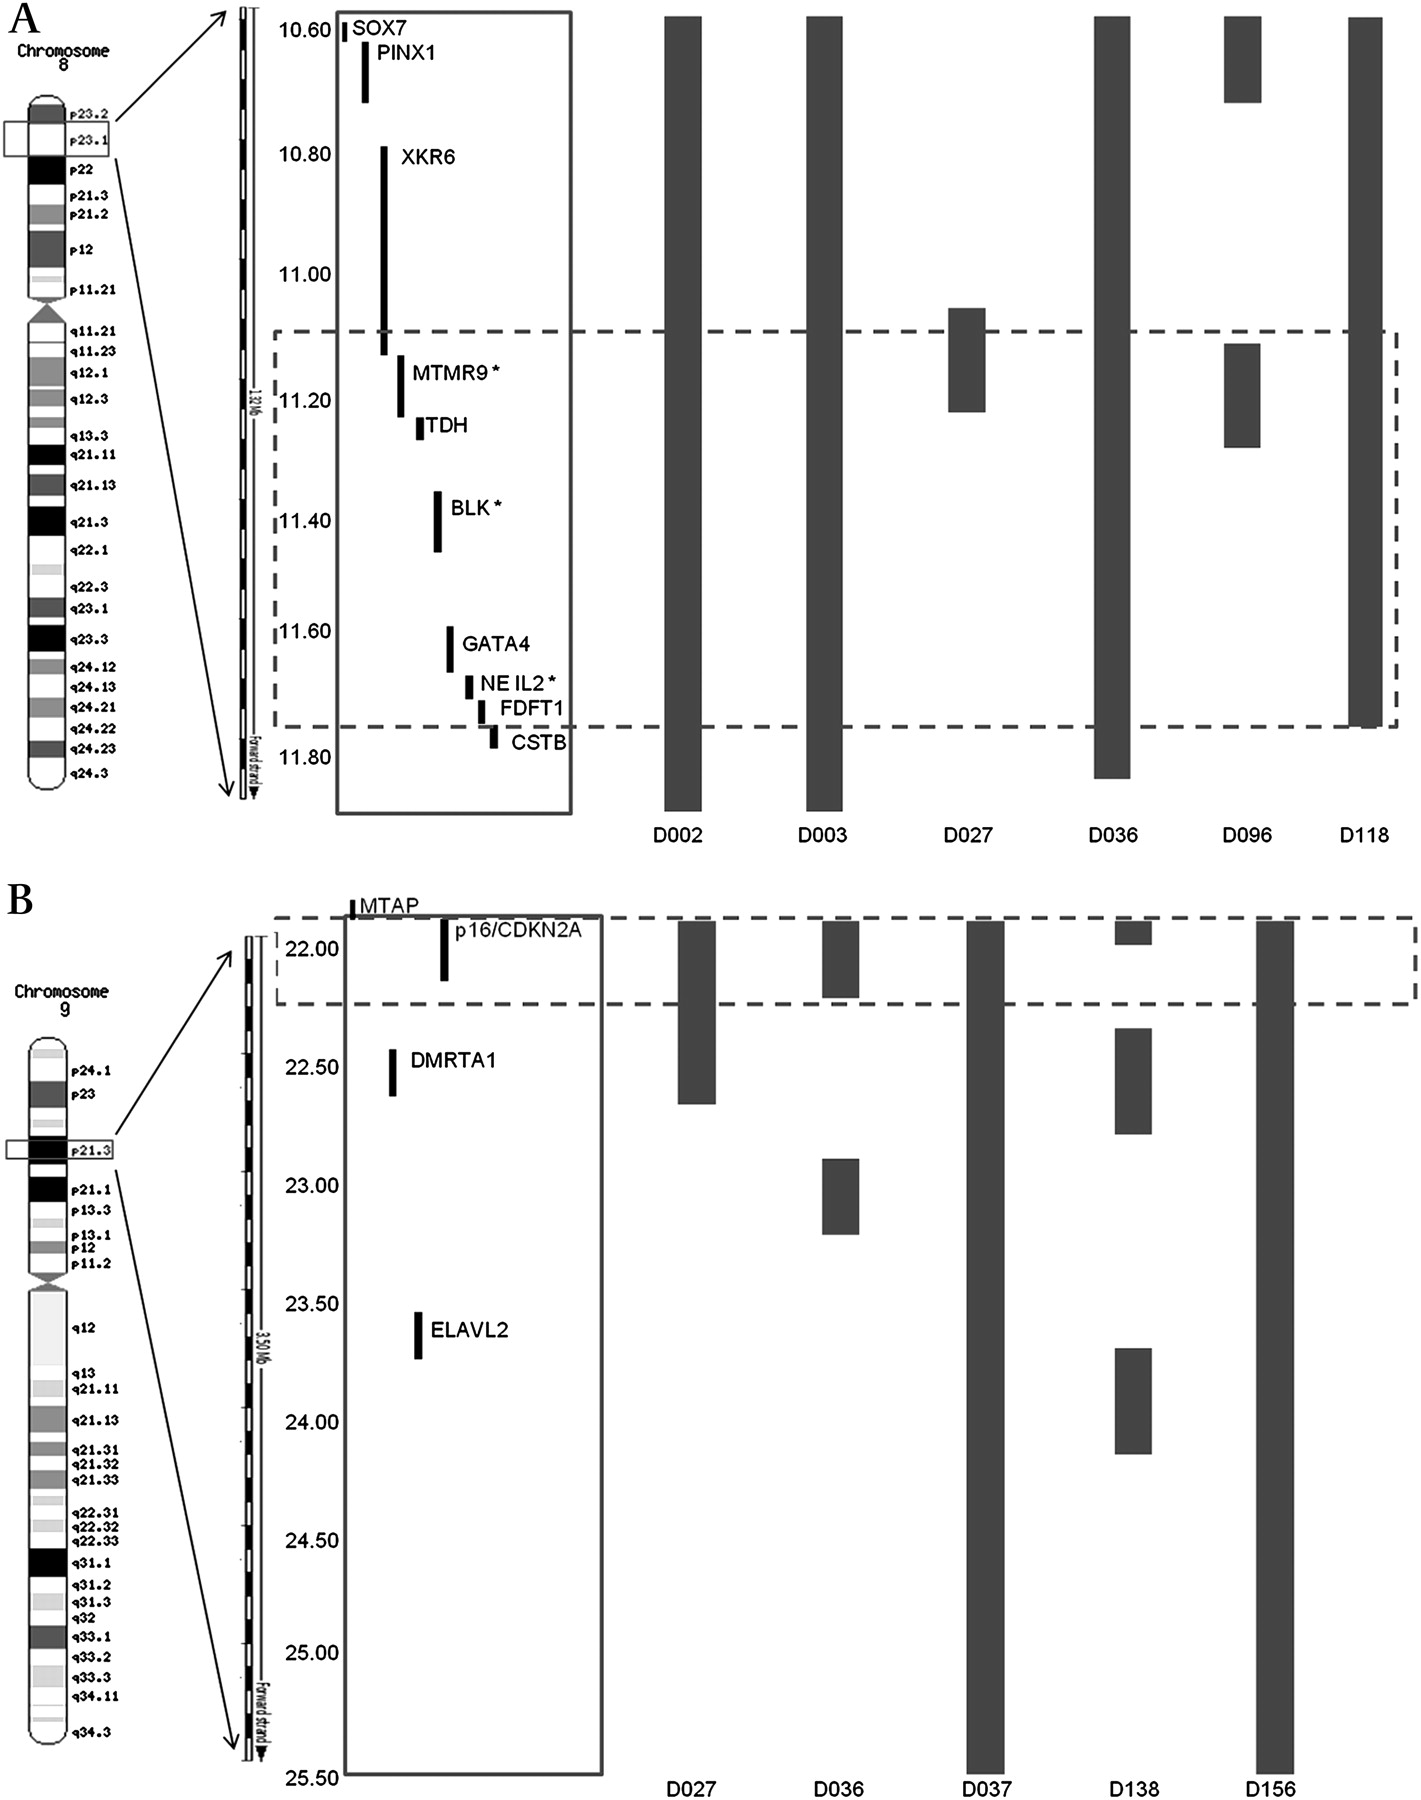
The chromosomal regions most frequently gained were loci 1p36.33-36.22 (34%), 3p21.31 (25%), 8q24.21 (28.6%) and 17q12-21.2 (46%), while those frequently lost were 3p14 (39%) and 17p13.1 (34%). These loci contain genes previously known to be associated with OAC: C-MYC, ERBB2, FHIT and TP53. aCGH findings, including the frequency of aberrations, were subsequently confirmed by a high-density SNP array analysis on nine tumour samples, previously identified from aCGH analysis to harbour gains on locus 8p23.1 and losses on locus 9p21.3 (figure 2).

Detailed region mapping analysis using data from the SNP array (Human May 2004 assembly (hg17)). (A) Six samples known from aCGH to have genomic gains at locus 8p23.1 (10.58–11.78 Mb) encompassing two validated genes based on integrated analysis of aCGH and gene expression profiling data: MTMR9 and NEIL2. Bars denote 2–4 copies of genes. (B) Five samples known from aCGH to have genomic losses at locus 9p21.3 (22.00–22.50 Mb). Bars denote 0–1 copies of genes. Dashed box highlights the region involving the most overlap between samples. aCGH, array-comparative genomic hybridisaion; SNP, single-nucleotide polymorphism.
In addition to the regions previously reported in genome-wide studies of OAC (table S.1), novel loci for OAC at 11p13 which contained genomic gains (11% of samples) and at 21q21.2 (11% of samples) which contained genomic losses were identified. Within locus 11p13, genes such as Wilms' tumour 1 (WT1), catalase (CAT) and CD44 have previously been implicated in breast and lung cancers.21–23 Locus 21q21.1 contains genes that have been implicated in tumourigenesis such as the ubiquitin specific peptidase 25 (USP25), downregulated in lung cancers24 and coxsackie virus and adenovirus receptor (CXADR), a putative TSG lost during gastric cancer progression.25
Integrative analysis of copy number and gene expression data
To explore the significance of genomic aberrations identified, criteria proposed by Santarius et al19 that categorise the importance of genes according to their copy number and expression levels were followed to identify genes with differential expression levels following genomic aberrations. Data from aCGH (log2 ratios) were matched to the gene expression microarray profile (median expression fold-change of genes within regions with gains). Using a cut-off of >1.5 fold-change in expression level, 64 genes were shortlisted (figure 3A, and table S.8 in the online appendix). Most of the genes within locus 8p23.1 common region of amplifications (MSRA, FDFT1, SOX7 and XKR6) have elevated expression levels accompanying genomic gains. By applying cut-offs of log2 ratio>0.32 (threshold for gain) and expression fold-change >6.5 (a more stringent threshold for over-expression), genes with the most significantly increased expression levels following genomic gains were WT1 at the novel locus 11p13 (10-fold), epidermal growth factor receptor (EGFR; 11-fold), and two novel genes within locus 8p23.1: nei-like 2 (NEIL2) and myotubularin related protein 9 (MTMR9) (>6.5-fold; figure 3B). According to Santarius et al19 EGFR is a class III gene as it is amplified, over-expressed and has clinical implications. The other three are class IV genes, which are genes within regions of genomic gains that are over-expressed, which may have potential roles in cancer development. The regions identified with potential HDs were loci 3q23-25 and 9p21.3. Locus 3q23-25 (7% of samples) contains a potential HD involving muscleblind-like 1 (MBNL1) while locus 9p21.3 (9% of samples) harbours important genes including p16/CDKN2A, MTAP and a novel gene ELAVL2, whose function is unknown.
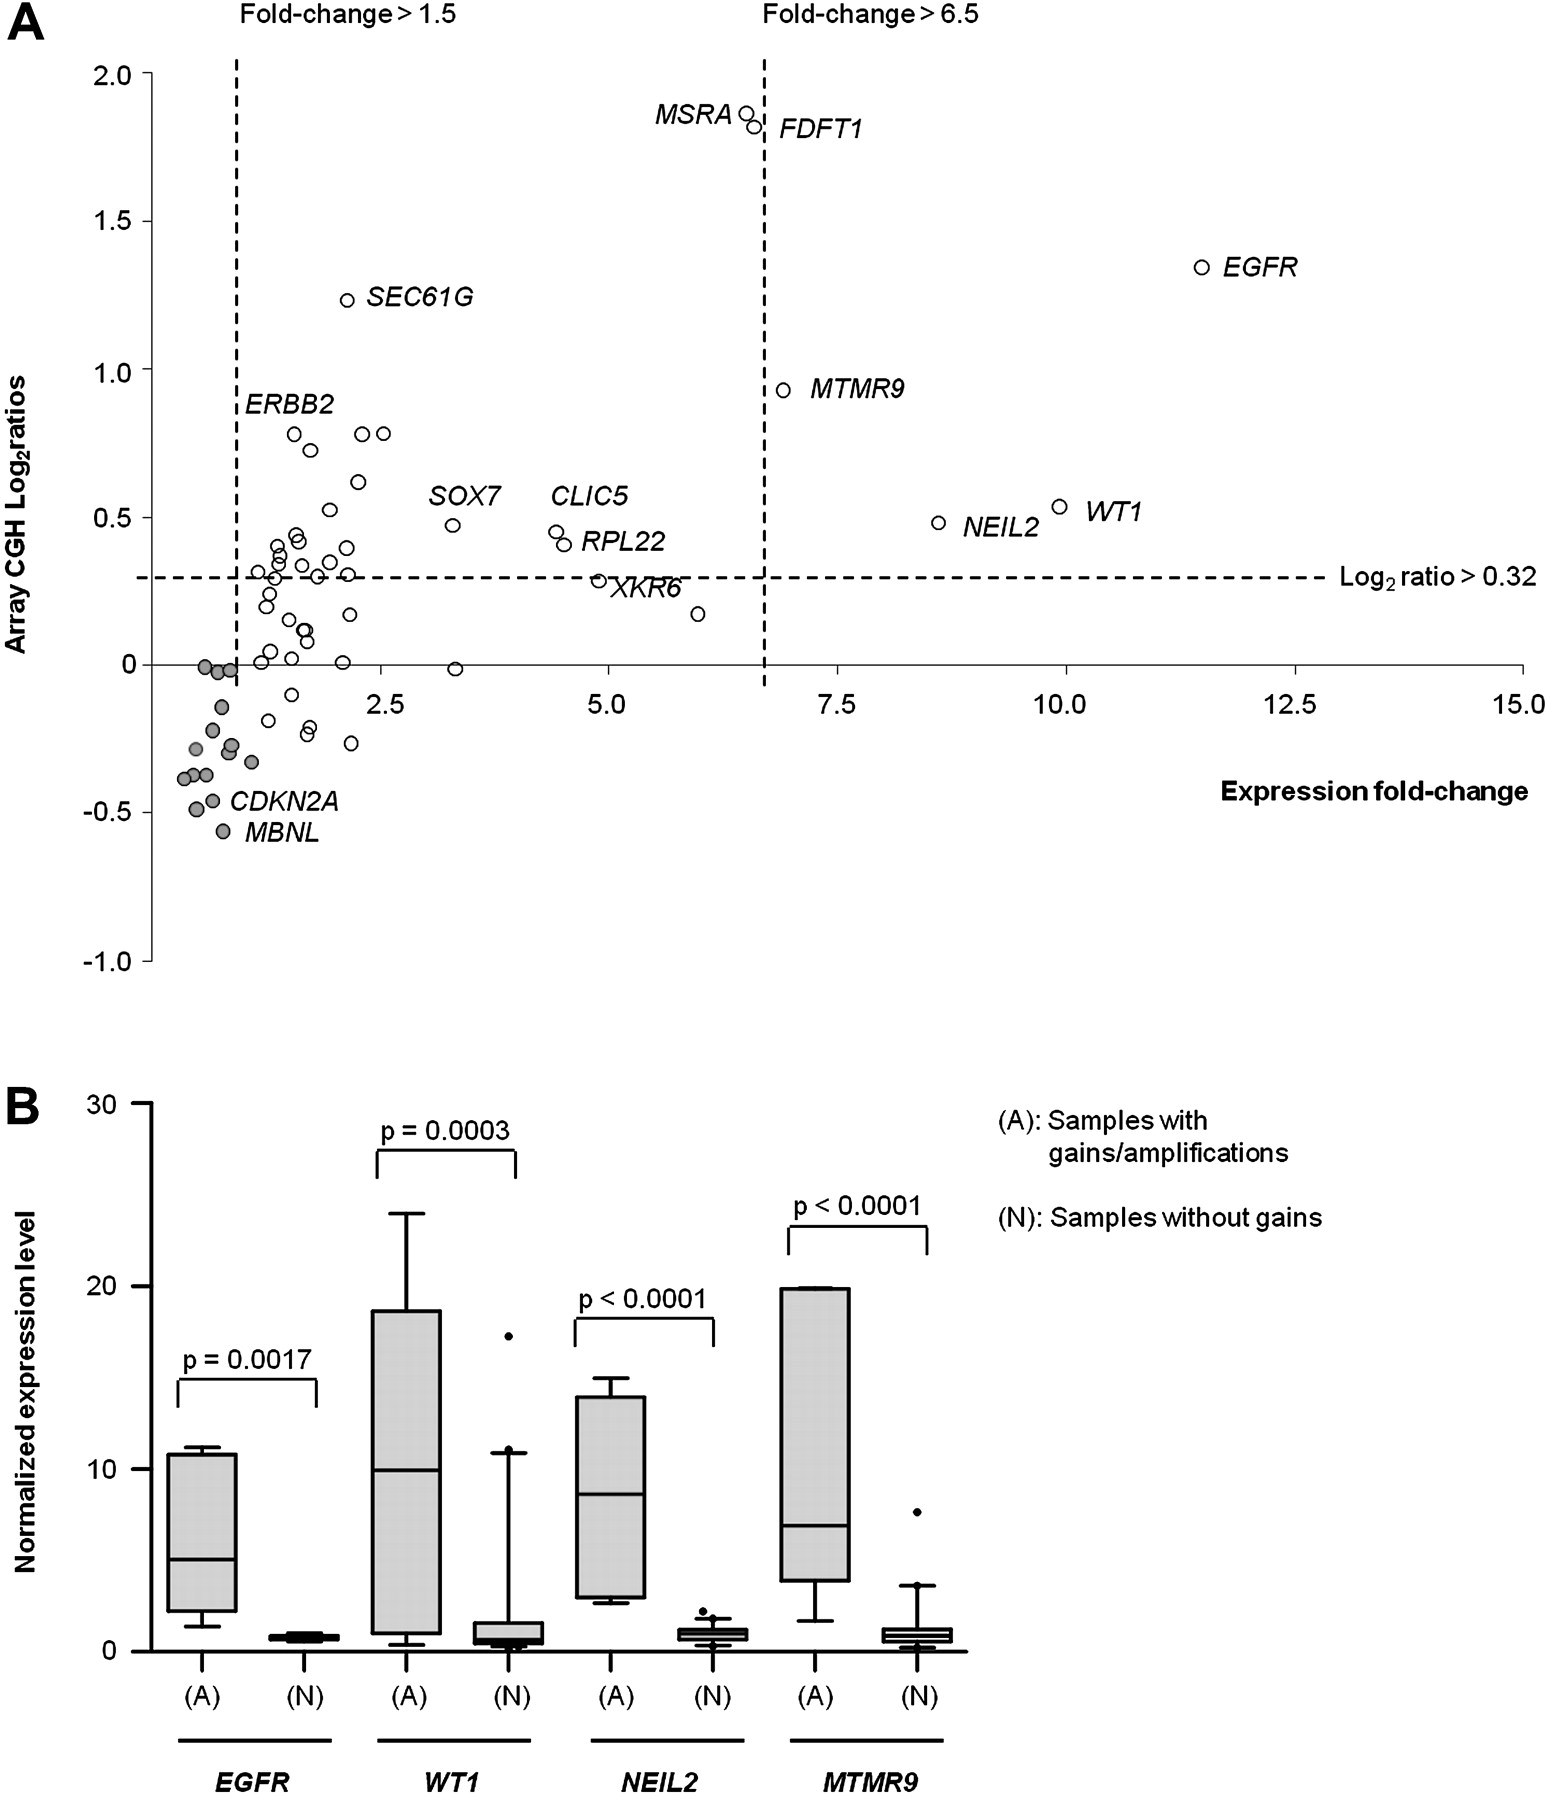
(A) Scatter plot shows correlation between DNA copy number changes and gene expression levels of individual genes within regions with genomic gains/losses (listed in tables 1, 2). Open circles represent genes within common regions of gains and filled circles represent genes within common regions of losses. Four genes that fulfilled the most stringent criteria (log2 ratios >0.32 and expression fold-change >6.5): EGFR, WT1, NEIL2 and MTMR9, were brought forward for validation. (B) Box plots showing patterns of gene expression levels of each selected gene (EGFR, WT1, NEIL2 and MTMR) in all OAC samples, showing statistically significant differences between samples having genomic gains/amplifications and those without (t-test p<0.005). OAC, oesophageal adenocarcinoma.
Validation of targets from integrative analysis
For HDs, locus 9p21.3 was further validated (figure 4A). First, microdissection was carried out to remove most stromal cells from the tumour section. Nested-multiplex PCR on p16/CDKN2A and three adjacent genes showed that p16/CDKN2A was the only gene completely deleted (figure 4B) and the products were sequenced to confirm identity of p16/CDKN2A (figure S.4). FISH on interphase nuclei demonstrated that >80% of nuclei had lost both copies of the p16/CDKN2A gene, in agreement with the tumour cellularity and heterogeneity of sample (figure 4C, D). Although p16/CDKN2A loss is well established in OAC this was a useful validation of the aCGH data.

Validation of 9p21.3 HD on a representative OAC sample. (A) Schematic illustration of the 9p21.3 region depicts relative genomic positions of genes within the potential HD region (boxed) and flanking genes. (B) A representative gel image illustrating nested-multiplex PCR analysis on microdissected DNA showing deletion of p16/CDKN2A. The STS marker for AQP3 was used as a control alongside the markers for genes of interest (GOI: IFNA, p16/CDKN2A, DMRTA1 and TUSC1). (C) A representative image (magnification, ×100) of FISH on tumour touch-imprints to confirm HD of p16/CDKN2A. Categories of nuclei included: two paired yellow and magenta signals (2Y2M); one yellow and two magenta signals (1Y2M); paired magenta signals (0Y2M); one magenta signal (0Y1M); others. (D). Graph illustrates quantitative analysis of FISH assays based on 100 nuclei counted per sample. The proportions of nuclei are quoted in percentage and the types of nuclei are marked along the x-axis. The lack of yellow signals indicates loss of p16/CDKN2A. Note: Genes of interest (GOI); Aquaporin 3 (AQP3) control gene. FISH, fluorescence in situ hybridisation; HD, homozygous deletion; STS, sequence-tagged site.
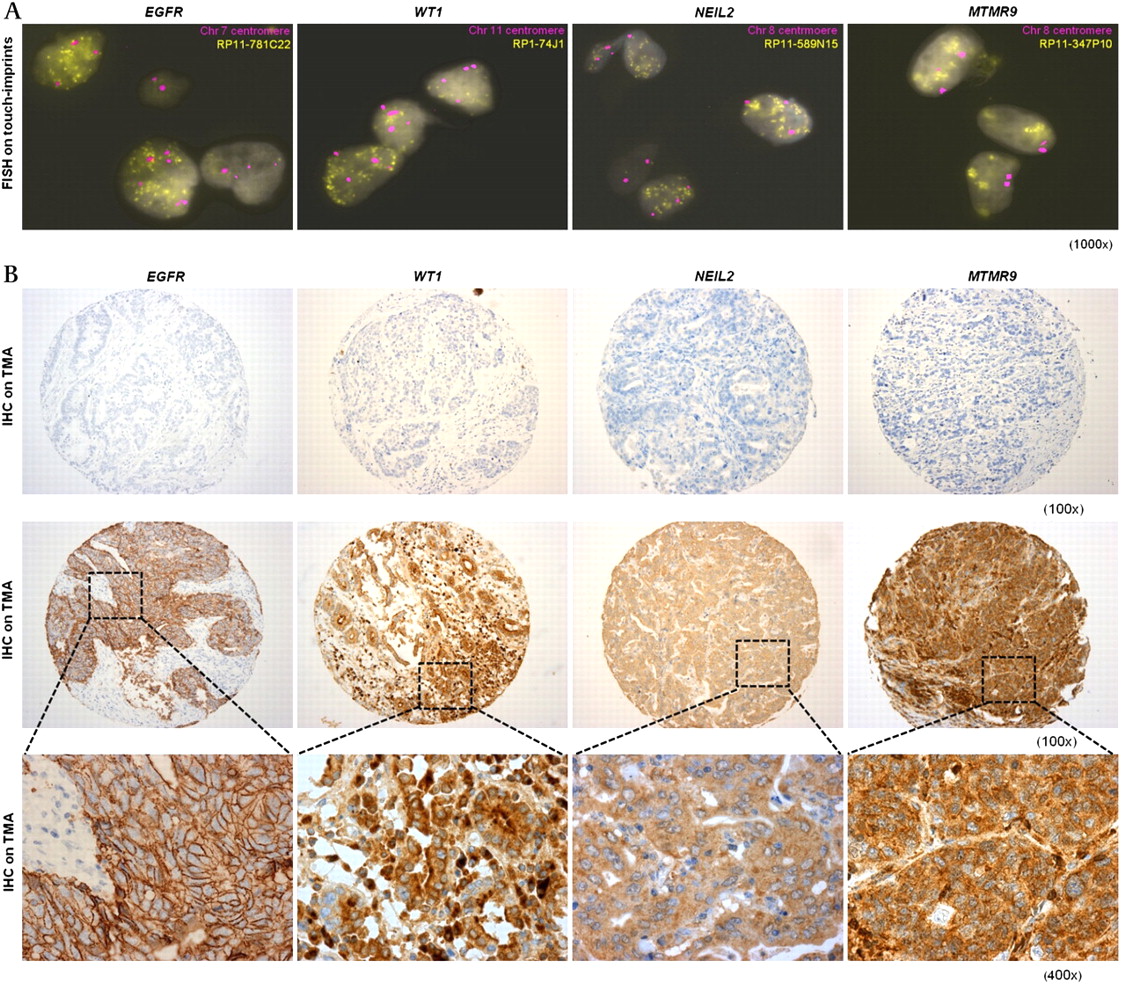
For regions of gains, genes with the highest copy number–gene expression fold-changes (EGFR, WT1, NEIL2 and MTMR9) were validated. These criteria excluded genes such as ERBB2, SEC61G, CLIC5 and RPL22 with relatively high CGH log2 ratios but minimal expression changes. FISH on tumour touch-imprints confirmed amplifications (ratios of >6 copies per centromere, indicating high-level amplifications of target genes) of all four genes in all samples identified by aCGH analysis to harbour these aberrations (figure 5A). Subsequent IHC analyses on the same tumours on TMAs confirmed over-expression of these proteins in the same samples (figure 5B). Finally, IHC analysis on a large validation cohort of independent OAC (n=371) demonstrated that MTMR9 was most commonly over-expressed, affecting 25% of cases, whereas over-expression of other genes was observed in 21% (WT1), 14% (NEIL2) and 10% (EGFR) of OACs.

Validation of genomic gains and protein over-expression involving EGFR, WT1, NEIL2 and MTMR9. (A). FISH images on tumour touch-imprints showing interphase nuclei with gene amplifications: BACs containing genes of interest were shown yellow and centromeric controls were magenta (magnification, ×1000). (B) Representative IHC images from tumours without genomic amplifications (top panel, magnification ×100) and from tumours with genomic amplifications and over-expression (middle and bottom panels: magnifications at ×100 and ×400, respectively). BACs, bacterial artificial chromosomes; FISH, fluorescence in situ hybridisation; IHC, immunohistochemistry.
Prognostic significance of targets
To elucidate the potential clinical significance of our findings, identified candidate genes and an aCGH signature were correlated with prognosis.
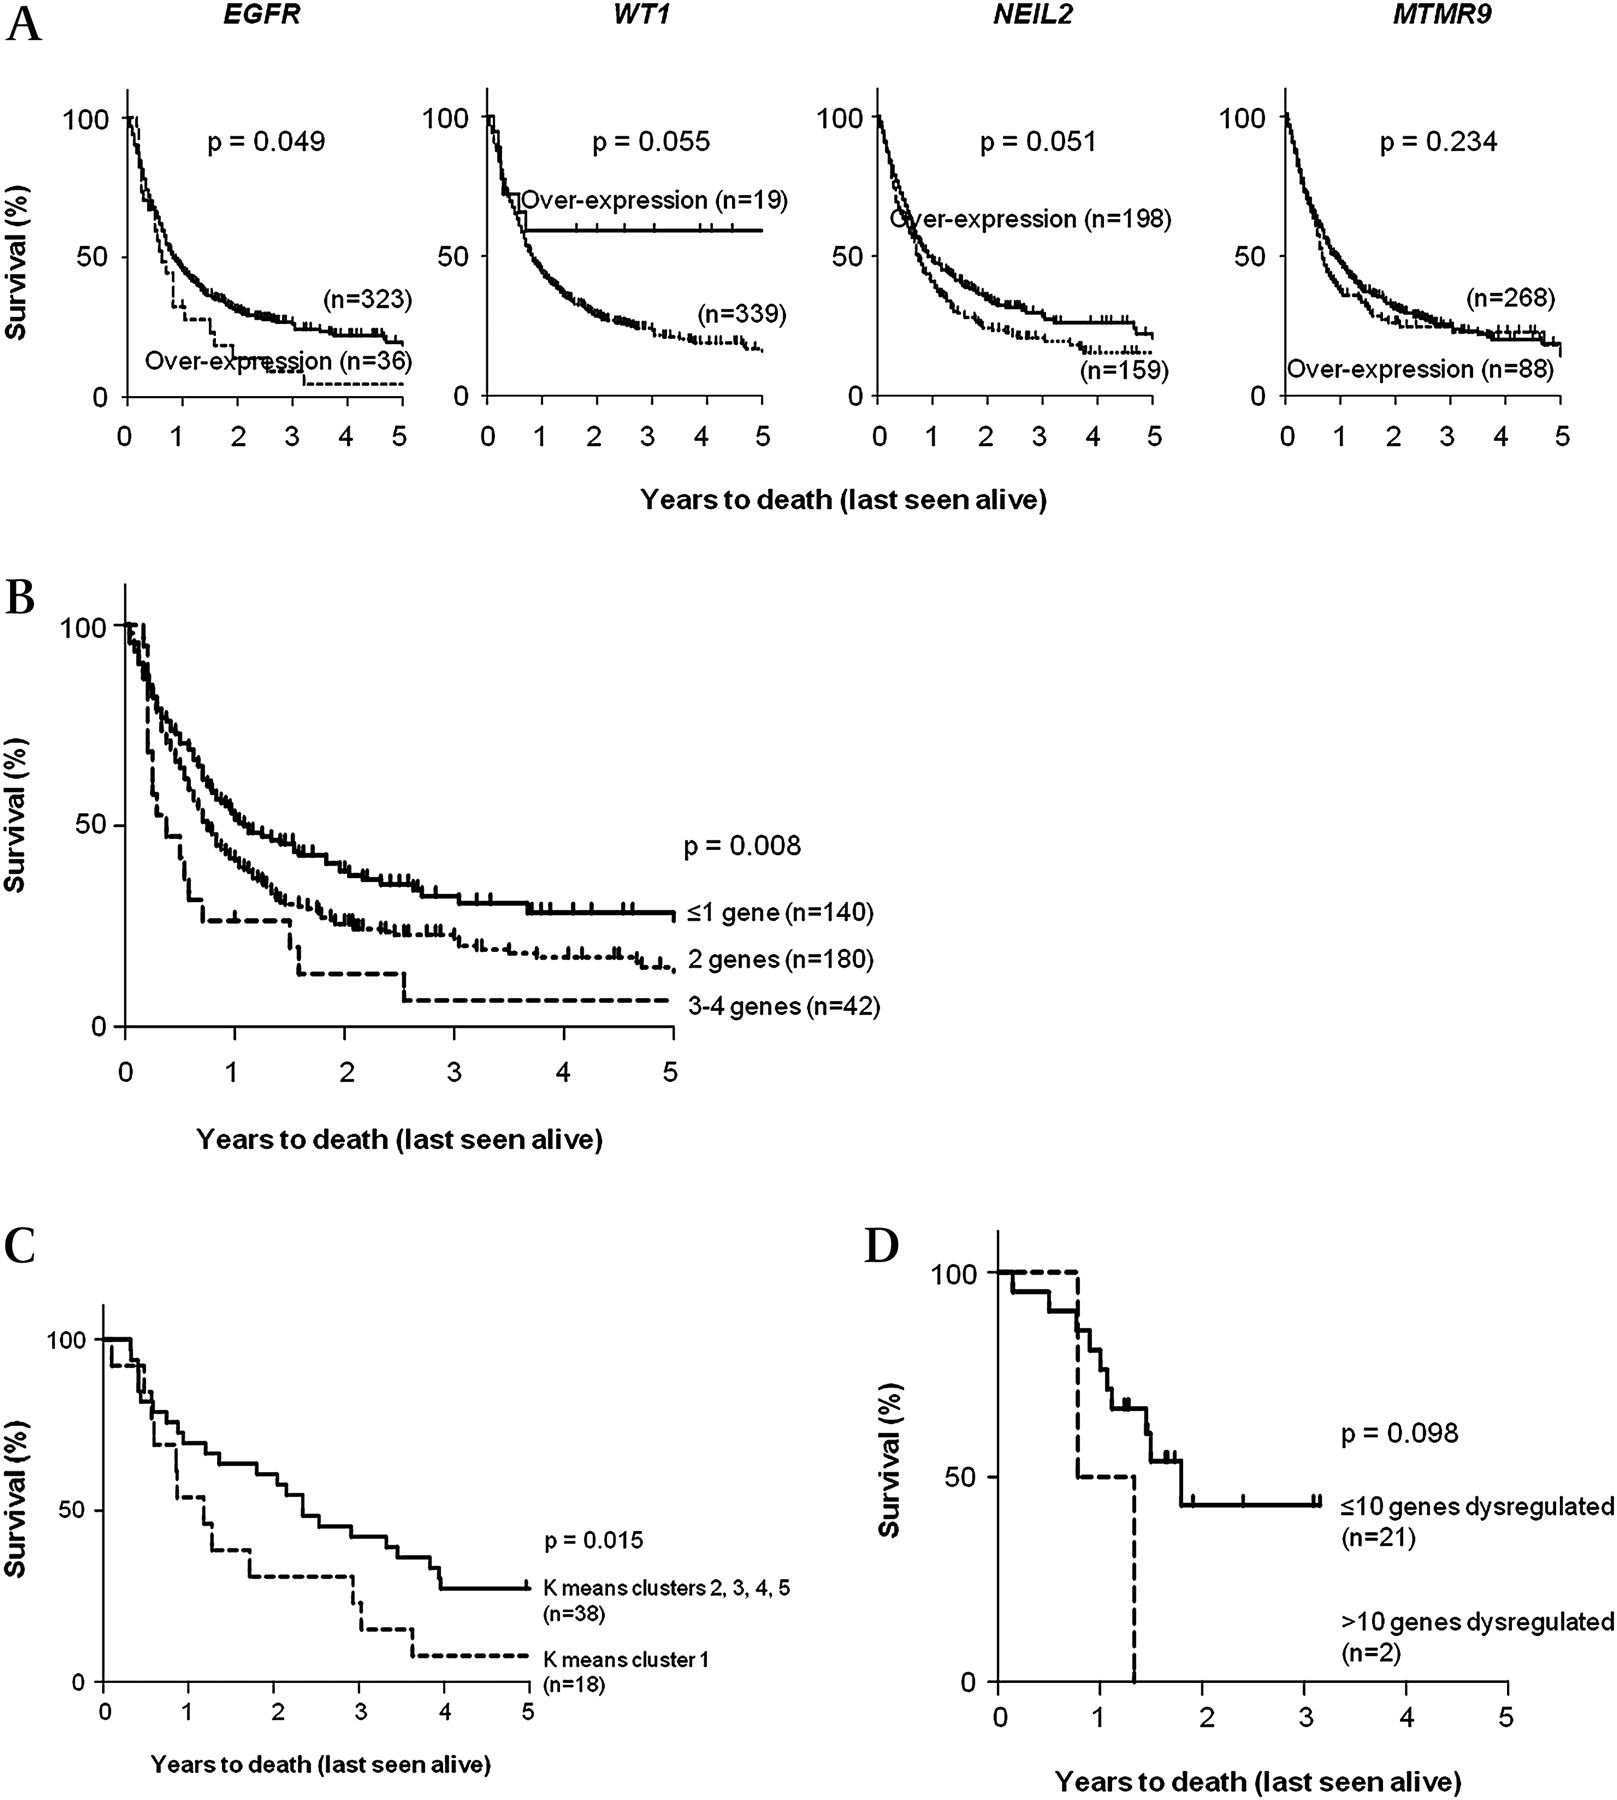
Using IHC, over-expression of EGFR (p=0.049) confers a poorer survival in OAC whereas over-expression of WT1 and NEIL2 contributes to better prognosis in patients (p<0.060; figure 6A). Combined differential expression of all four target proteins (EGFR, WT1, NEIL2 and MTMR9) segregated patients into three groups with very good prognosis, average prognosis and poor prognosis (p=0.008; figure 6B).
(A). Kaplan–Meier plots of patients with OAC on independent datasets (n=371) to show individual prognostic relevance of four validated gene targets. (B) Kaplan–Meier plot of patients with OAC from independent datasets showing stratification of patient survival according to differential expressions of the four genes (EGFR, WT1, NEIL2 and MTMR9), based on IHC scores (p=0.008). (C) Analysis following K-means unsupervised clustering of aCGH data: Kaplan–Meier plot of 56 patients with OAC. Graph shows survival when samples in K-means cluster 1 (n=18) were compared to the remaining samples in clusters 2, 3, 4 and 5 combined. Cluster 1 had a significantly worse prognosis (median survival=1.37 years; p=0.015, HR=1.802, 95% CI=1.141 to 3.397). (D) Independent validation of prognostic significance of 16 aCGH clones: Kaplan–Meier plot of patients with OAC obtained from the Nancarrow et al dataset illustrates the ability of these genes to stratify patients into good and poor survival groups, despite limited by the small sample size (p=0.098). aCGH, array-comparative genomic hybridisation; IHC immunohistochemistry; OAC, oesophageal adenocarcinoma.
Unsupervised K-means clustering based on aCGH data generated five clusters (50 iterations, reproducibility >50%; supplement S.9 in the online appendix). Cluster 1 (n=18, 32.1% of cohort) had a significantly worse prognosis (median survival=1.37 years; HR=1.802 (95% CI: 1.141 to 3.397); p=0.015) when compared to the remaining clusters combined (median survival=2.74 years; figure 6C). Fisher's exact test showed an increased male:female ratio in cluster 1 (p=0.010) and t-test with adjusted Bonferroni correction identified 16 genes with significantly different log2 ratios (p<4×10⁻⁷) that differentiated cluster one from the remaining clusters (table S.10 in the online appendix). Among these were three genes residing within the common regions of gains identified earlier (SCAMP2 on 15q24.1, PCBP1 on 2p14 and TSC22D4 on 7q22.1), six novel genes (CEP192, ZMYND15, SYCP2L, PMP2, LYPD6 and MEXD3) and one hypothetical protein (BC040153). A multivariate Cox-regression model for survival including these 16 genes and other clinical parameters (age, sex, T-stage, N-stage, M-stage and tumour differentiation status) ruled out all other parameters except cluster 1 (p=0.034) and N-stage (p=0.011) as being prognostic. The prognostic significance of these 16 genes were validated on an independent dataset (n=23),14 which is the only public dataset available at present with copy number and survival information (see table S.7 for gene-specific information). Survival analyses illustrated that the group of OAC patients with >10 of these genes dysregulated had a worse prognosis; however, the small sample size limited the statistical power of this analysis (p=0.098; figure 6D). Unfortunately, there are no other independent OAC datasets available for validation. These genes represent a potential prognostic signature for OAC based on genomic aberrations that require further investigation in a larger cohort.
Discussion
The aCGH data presented here confirmed known genomic aberrations in OAC and identified novel common regions of gains and losses. Using an integrated approach to identify genes with differential expressions as a result of genomic aberrations, we confirmed over-expression of a Santarius class III gene EGFR, and three novel Santarius class IV genes, WT1, NEIL2 and MTMR9 at the protein level, suggesting their importance in OAC. We further demonstrated the prognostic importance of these candidate genes and identified 16 aCGH gene probes that contributed to poorer prognosis in 32% of patients.
These findings from aCGH analysis identified most of the main regions of aberrations reported previously (see table S.1). Two novel common regions with copy number changes not previously reported in any genome-wide studies in OAC, loci 11p13 and 21q21.1, were identified. Like gains on locus 17q (46% of samples) involving ERBB2, gains on locus 1p36 are noteworthy due to the large proportion of samples involved (34%). Many genes within the region have been implicated in other cancers, such as SKI,26 PRKCZ,27 MIG-6,28 CTNNBIP129 and PARK7.30 More interestingly, in concordance with previously published data,31 accumulated frequencies of genomic changes in OAC conferred a survival difference in our cohort, suggesting the importance of individual genomic events and that frequent genomic aberrations with the probability of rearrangements could directly influence patient prognosis.
Integrative analysis of copy number–expression data from aCGH and gene expression microarray profiling analyses led to identification of key genes in OAC with genomic amplifications followed by elevated gene expression levels and subsequent protein over-expression. This approach can lead to the discovery of novel critical genes, but it should be noted that certain genomic events do not directly translate into gene expression changes. For example, as was observed in our study, the lack of correlation between amplifications and elevated RNA levels of ERBB2 has been previously reported despite strong correlation between amplifications and protein over-expression.32 Therefore, when integrating such datasets it should be remembered that RNA and subsequent protein expressions are often also subjected complex post-transcriptional regulations including effects of microRNA and non-coding RNAs.
The four genes (EGFR, WT1, NEIL2 and MTMR9) identified by integrating data from aCGH and gene expression microarray profiles were shown to be over-expressed in 10–25% of OAC. EGFR has established roles in the development of many cancers and is a potential predictor of outcome in OAC.33 The proportion of OAC samples with EGFR over-expression in our data was in agreement with the proportion of OACs having EGFR amplifications (11%) in our cohort. Cytoplasmic staining for WT1 has been observed and described previously despite its role as a transcription factor.34 In contrast to the possible oncogenic role of WT1 suggested by its over-expression,35 high WT1 expression is associated with a good prognosis in our cohort, indicating that WT1 could be acting as a TSG as shown in prostate cancer.36 In addition, many downstream targets of WT1 have been identified which may influence tumour biology.37–38 Our finding also confirmed data from a previous study that reported locus 11p13-15 rearrangements,39 hinting at a potential mechanism for WT1 amplifications in OAC. Therefore, our data may highlight a particular subgroup of OAC tumours with unexplored downstream effects in OAC. NEIL2 is a newly discovered enzyme involved in DNA damage repair40 with no known direct link to any cancer. Our finding suggests that the lack of NEIL2 expression in tumours with worse prognosis could be due to an accumulation of cellular DNA damage. MTMR9 belongs to a family of myotubularin related proteins, which are mainly dual-specificity phosphatases. Though not having a phosphatase domain, MTMR9 has been shown to enhance the functions of other MTMR proteins, like MTMR6 and MTMR7.41 42 Identification of these novel genes via our integrated approach in the analysis of genome-wide data and the prognostic significance of these targets suggest that further investigation of the mechanistic roles of these genes in OAC is likely to provide useful insights into the understanding of OAC pathogenesis.
Novel genes were also discovered as genes differentiating cluster 1 based on unsupervised K-means clustering of aCGH data were identified. Some do not appear to have obvious roles in carcinogenesis, but a number could be directly linked to carcinogenesis, like the mitogen-activated protein kinase eight interacting protein (MAPK8IP2)43 and ceroid-lipofuscinosis, neuronal 8 (CLN8).44 Functional validation of these data will be required to determine the pathogenic role of these genes.
The strength of this study was the availability of copy number and expression data from the same patients with the ability to correlate these findings with clinical outcome. This is the largest cohort of individuals with OAC to be investigated using aCGH which has combined both aCGH and gene expression microarray data. The integration of these data identified novel genes which otherwise would not have been selected from analysis of either aCGH or gene expression data alone. This discovery step was followed by stringent validation, which included microdissection prior to PCR analyses to tackle the problem of stromal contamination. The availability of TMAs coupled with outcome data provided robust protein level validation and enabled investigation of the prognostic significance of gene targets. The mechanisms for protein over-expression were not examined, but the proportion of samples with genomic gains matched the proportion of samples with protein over-expression of EGFR, NEIL2 and MTMR9. In the case of WT1, amplification is not the only mechanism responsible for its over-expression in OACs. A limitation of the study is that this aCGH platform has been superseded by higher density arrays including SNP arrays which permit more detailed analysis of copy number changes. In order to overcome this, whole-genome SNP array analysis was carried out on samples of interest identified from aCGH analysis to validate our findings. Lastly, we demonstrated the potential of a prognostic aCGH signature on an independent dataset, but eventually larger sample cohorts would be needed to overcome the limitations of a small sample size and to reduce errors caused by inter-cohort variability.
Overall, these findings provide important insights into OAC pathogenesis with promising data to suggest that they could be exploited as prognostic biomarkers. Future cancer management may be improved if our knowledge of the biology and genetics of cancers can be integrated with clinical applications.
Acknowledgments
We would like to thank Dr Ian Roberts for his assistance in the analysis of aCGH data and Rosetta Inpharmatics, Seattle, Washington (a subsidiary of Merck & Co. Inc.) for the gene expression microarray data. We also thank Dr Emily Clement and Dr Julien Bauer for assistance with SNP array analysis. We thank Will Howat for his technical assistance on operating the PALM system for the LMM procedure; as well as Scott Newman and Dr Paul Edwards for help with the FISH assays and the kind donation of the DRM/M62 lymphocyte cell line. We also thank the study participants, their families and the OCCAMS collaboration group, especially Mr Christopher Peters for his contributions in generating the TMAs used in this study. We also thank the Malaysian Ministry of Higher Education and Universiti Sains Malaysia for funding (XY Goh).
References
Supplementary materials
Supplementary Data
Data files
Files in this Data Supplement:
- Download Supplementary Data (DOCX) - Manuscript file of format docx
Footnotes
Funding This study was funded by the Medical Research Council, Cambridge Experimental Cancer Medicine Centre and the NIHR Cambridge Biomedical Research Centre.
Competing interests None.
Ethics approval Ethics approval was obtained from the Central and South Bristol Research Ethics Committee (LREC 04/Q2006/28). Each patient provided informed consent for the collection of tissue and clinical information.
Provenance and peer review Not commissioned; externally peer reviewed.