Article Text

Abstract
Background and aims Several clinical factors have an impact on prognosis in stage II colorectal cancer (CRC), but as yet they are inadequate for risk assessment. The present study aimed to develop a gene expression classifier for improved risk stratification of patients with stage II CRC.
Methods 315 CRC samples were included in the study. Gene expression measurements from 207 CRC samples (stage I–IV) from two independent Norwegian clinical series were obtained using Affymetrix exon-level microarrays. Differentially expressed genes between stage I and stage IV samples from the test series were identified and used as input for L1 (lasso) penalised Cox proportional hazards analyses of patients with stage II CRC from the same series. A second validation was performed in 108 stage II CRC samples from other populations (USA and Australia).
Results An optimal 13-gene expression classifier (PIGR, CXCL13, MMP3, TUBA1B, SESN1, AZGP1, KLK6, EPHA7, SEMA3A, DSC3, CXCL10, ENPP3, BNIP3) for prediction of relapse among patients with stage II CRC was developed using a consecutive Norwegian test series from patients treated according to current standard protocols (n=44, p<0.001, HR=18.2), and its predictive value was successfully validated for patients with stage II CRC in a second Norwegian CRC series collected two decades previously (n=52, p=0.02, HR=3.6). Further validation of the classifier was obtained in a recent external dataset of patients with stage II CRC from other populations (n=108, p=0.001, HR=6.5). Multivariate Cox regression analyses, including all three sample series and various clinicopathological variables, confirmed the independent prognostic value of the classifier (p≤0.004). The classifier was shown to be specific to stage II CRC and does not provide prognostic stratification of patients with stage III CRC.
Conclusion This study presents the development and validation of a 13-gene expression classifier, ColoGuideEx, for prognosis prediction specific to patients with stage II CRC. The robustness was shown across patient series, populations and different microarray versions.
- ColoGuideEx
- colorectal neoplasms
- gene expression profiling
- prognosis
Statistics from Altmetric.com
Significance of this study
What is already known about this subject?
-
Risk assessment of patients with stage II colorectal cancer (CRC) currently relies on the evaluation of clinicopathological parameters.
-
An individualised prognostic stratification of CRC to guide postoperative patient management is warranted.
-
Several published prognostic gene expression signatures for stage II and III CRC typically contain multiple genes and their performance in validation series remains unknown. However, a couple of promising prognostic stage II and III CRC signatures with a small number of genes have been published.
What are the new findings?
-
A gene expression classifier specific for stage II patients containing a small set of 13 optimally combined genes, each providing independent prognostic information to ensure robustness of the classifier, has been developed by multivariate survival modelling of global gene expression profiles from CRC samples.
-
The statistical model used ensures low covariation among the genes in the classifier.
-
Strong prognostic stratification was achieved in two independent clinical validation series of patients with stage II CRC from different populations and across microarray generations.
How might it impact on clinical practice in the foreseeable future?
-
The 13-gene expression classifier, ColoGuideEx, has the potential to predict the prognosis of patients with stage II CRC and hence provide valuable information for postoperative decision-making.
-
Interpretation of the prognostic test is based on the number of genes with expression values exceeding defined thresholds, and the ColoGuideEx is thus suitable for clinical implementation.
-
Validation of the ColoGuideEx at the individual patient level is necessary in a prospectively designed study, and parallel analyses with other promising tests (Oncotype DX and ColoPrint) are warranted.
Introduction
Colorectal cancer (CRC) is one of the most common cancer types in both men and women worldwide, with about 1.2 million new cases recorded annually.1 The prognosis is highly dependent on the tumour stage at the time of diagnosis. According to the American Joint Committee on Cancer, the 5-year overall survival rate is 93%, 83%, 60% and 8% in stage I, II, III and IV, respectively.2 However, the prognosis for stage IIb patients (pT4, lymph node negative) is significantly lower (72%) than for those with stage IIIa (pT1–2, lymph node positive; 83%).2
Adjuvant chemotherapy significantly improves survival in stage III CRC and is accepted as standard treatment for these patients.3 The majority of patients with stage II CRC are cured by surgery alone, but perforation of the tumour and few examined lymph nodes are associated with reduced survival and adjuvant chemotherapy is usually considered in these patients. A proportion of stage II patients without increased risk of relapse based on current clinical factors still develop relapse. One could consider treating all patients with stage II CRC with adjuvant chemotherapy, but the effect of this has not been conclusive.4–6 This highlights the need for new biomarkers for a more precise prediction of high-risk patients with stage II CRC and consequently improved individualised cancer care.
Molecular markers such as mutations in KRAS and BRAF as well as chromosome and microsatellite instability (MSI) have been systematically analysed for prognostic potential in CRC. So far, only KRAS mutation analysis has been used in clinical practice as a predictive marker for the effect of EGFR antibodies in metastatic disease.7–10 Analysis of other known critical CRC genes is neither recommended for screening nor used as prognostic and/or predictive markers.11 ,12
Several studies have identified gene expression signatures with a prognostic impact in patients with stage II and III CRC.13–19 In early studies, small sample series and lack of validation in independent samples limited the powers of the conclusions drawn. However, recent publications have addressed these limitations and promising gene signatures have been suggested,13 ,14 ,17 ,18 although none of these specifically targeted stage II CRC.
In this study we have improved risk stratification of patients with stage II CRC. By applying high-resolution exon-level microarrays to accurately determine gene expression levels, we have developed a gene classifier for prediction of relapse. The predictive value of this expression signature was validated across two patient series, populations and microarray generations.
Methods
Patients and tumour samples
A total of 315 CRC samples from three independent patient series were analysed for global gene expression, comprising a test series and two validation series (I and II).
The test series consisted of 112 fresh frozen primary CRC samples (stage I–IV) from 112 patients consecutively collected at Oslo University Hospital, Aker, Norway between 2005 and 2008. The mean follow-up time for survivors was 47 months (range 33–61). None of the patients had received preoperative radiotherapy and adjuvant chemotherapy was given in accordance with Norwegian guidelines to patients with stage III colon cancer aged <75 years, or to patients with stage II disease in whom <8 lymph nodes were examined, or to patients with preoperative or intraoperative tumour perforation. Furthermore, adjuvant chemotherapy is generally only given to physically fit patients, but not to patients with rectal cancer. The series included 44 stage II patients and 33 stage III patients. All underwent curative resection and no bowel perforation was reported. Validation series I consisted of 52 stage II CRC samples and 43 stage III CRC samples collected from hospitals in the Oslo region during the period 1987–9. None of the patients had received adjuvant chemotherapy, which was introduced as standard treatment for patients with stage III CRC aged <75 years in Norway in 1997. The mean follow-up time was 71 months (range 4–120). For both series, tumour stage was determined according to guidelines from The International Union Against Cancer/American Joint Committee on Cancer. MSI status has previously been reported for both series.20 ,21 A detailed description of the two in-house sample series is summarised in table 1 in the online supplement.
Raw data have been deposited in the Gene Expression Omnibus (GEO) public repository for microarray data (accession number GSE24550, GSE29638, and GSE30378). Accession numbers for all samples included in the present study are given in table 2 in the online supplement.
External validation series
Validation series II consisted of gene expression data from 108 stage II CRC samples accessed from the GEO (GSE14333 and GSE17538). The clinical samples were from the USA and Australia and, according to the GEO entries, none of the patients had received chemoradiotherapy or radiotherapy preoperatively. Available clinicopathological data are summarised in table 1 in the online supplement. By correlation analyses of the probe cell intensity (CEL) files, we found overlapping samples from the Moffit Cancer Centre in the two datasets. The non-overlapping samples (n=108) were combined to achieve a validation series with a substantial number of stage II tumours.13 ,14 ,18 Samples included in the present study are listed in table 2 in the online supplement.
Sample preparation and gene expression analysis
Tissue was taken from each tumour, rapidly frozen in liquid nitrogen and stored at −80°C until processing. Prior to RNA isolation, a tissue section was taken from each sample and stained with H&E. All samples were visually inspected by a pathologist who confirmed the presence of tumour cells in all samples. RNA was isolated using the DNA/RNA Mini Kit (QIAGEN, Hilden, Germany) as recommended by the manufacturer. Quantity and quality measurements were carried out using UV spectroscopy (NanoDrop ND-100, Thermo Fisher Scientific, Waltham, Massachusetts, USA) and Agilent 2100 Bioanalyzer (Agilent Technologies, Santa Clara, California, USA).
For gene expression measurements, GeneChip Human Exon 1.0 ST Arrays (Affymetrix, Santa Clara, California, USA) with more than 5 million features and approximately 1.4 million probe sets were used. One μg total RNA was used as input to a ribosomal RNA reduction reaction (RiboMinus Human/Mouse Transcriptome Isolation kit, Life Technologies, Carlsbad, California, USA), followed by cDNA synthesis, amplification and DNA sense strand labelling according to the GeneChip Whole Transcript (WT) Sense Target Labelling Assay Manual (Affymetrix). Each sample was hybridised for 16–18 h and washed, stained and scanned as recommended in the manual. For each sample, a CEL file storing intensity measures was generated by the Affymetrix GeneChip Command Console software (V.1.0). These files were further processed through background correction, quantile normalisation and summarisation at the gene level by robust multiarray average using the Affymetrix Expression Console software (HuEx-1_0-st-v2.r2 gene-core library file). The HuEx-1_0-st-v2.na31.hg19.transcript.csv annotation file identified 17 617 annotated genes.
Samples from the GSE14333 and GSE17538 datasets were analysed on Affymetrix HG-U133 Plus2.0 arrays. CEL files from stage II patients were downloaded and analysed by robust multiarray average using the Affymetrix Expression Console software. The HG-U133_Plus_2.cdf and HG-U133_Plus_2.na31.annot.csv files were used as library and annotation files, respectively.
Development of the gene expression signature
Prior to multivariate survival modelling, the gene expression dataset from the test series was filtered to enrich for genes with potential prognostic predictive value. Initially, univariate HRs were calculated from the 44 stage II CRC samples (Cox regression analyses; 5-year relapse-free survival (RFS) where relapses or death from the same cancer were defined as an event). This analysis was performed using the weighted correlation network analysis software package22 ,23 for the R computing environment (http://www.r-project.org/index.htm; R version 2.10.1). Genes with metastasis-associated expression were identified by analyses of the 23 stage I and 12 stage IV CRC samples from the same biobank as the test series (empirical Bayes moderated t-statistics implemented in the Limma software package run with R).24 A false discovery rate was calculated for each gene and only genes with an adjusted p value <0.50 were included in the downstream analyses (n=6760 genes). Only genes showing concordance between the direction of expression regulation from stage I to IV tumours (upregulated or downregulated in stage IV) and associations with patient survival at high or low expression levels in stage II tumours (as indicated by the HR) were retained (n=3336 genes; figure 1). The R commands used for the analyses are listed in table 3 in the online supplement.
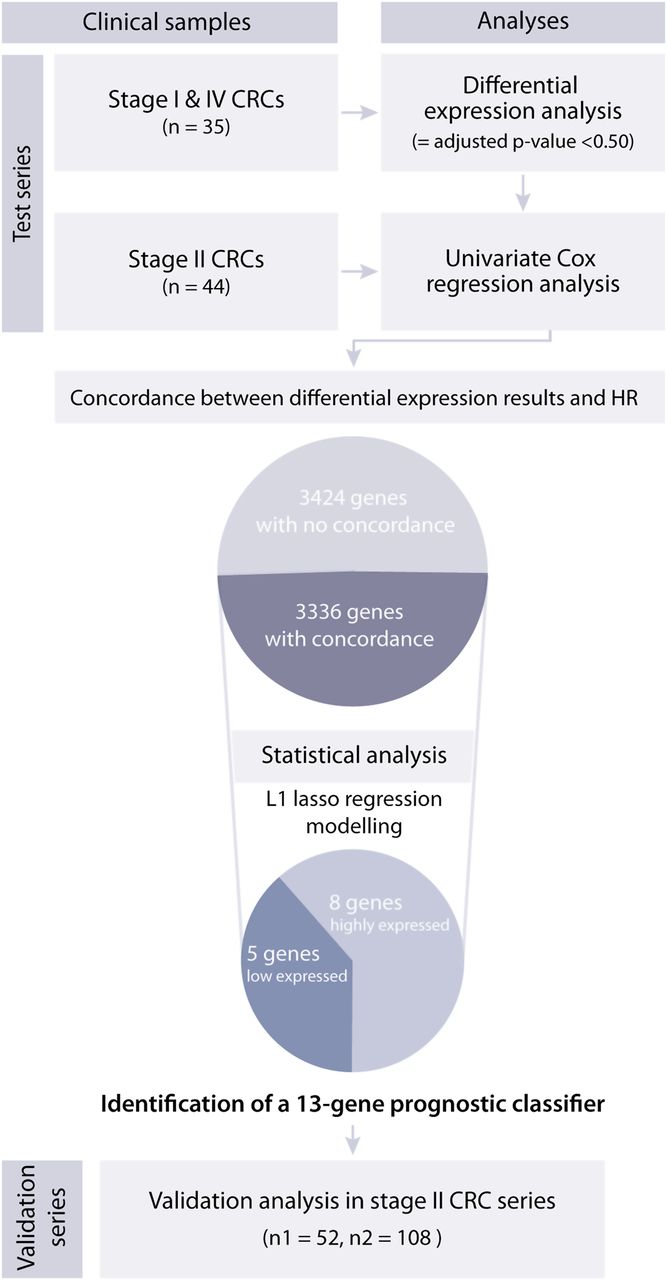
Gene selection criteria leading to identification of the prognostic gene expression classifier in a test series of patients with colorectal cancer (CRC). From the initial list of 17 617 genes, 6760 genes were differentially expressed between stage I and IV tumours with a stage-adjusted p value <0.50, and 3336 genes (49%) were common for the list of genes with differential expression between stage I and IV tumours, and the high and low expressed genes associated with a high risk of relapse among patients with stage II CRC. From these genes a 13-gene expression classifier was identified to indicate high-risk patients with stage II CRC. The prognostic impact of this gene classifier was successfully validated in two independent sample series. HR was obtained from univariate Cox regression analysis.
The expression levels for this filtered set of 3336 genes were used as input for multivariate survival modelling stage II tumours (risk of relapse) of the test series using L1 penalised (lasso) estimation in the Cox proportional hazards model.25 ,26 A likelihood cross-validation method was used to calculate the number of genes with non-zero regression coefficients as a function of the tuning parameter λ (λ1). The optimal λ1 value from cross-validation corresponded to zero genes. We chose to reduce the stringency of the penalisation (λ1) to systematically increase the number of genes with non-zero regression coefficients in a stepwise manner. The first 15 optimal gene sets were identified by this approach. All samples were on a gene-by-gene basis given positive prognostic scores indicative of a high risk of relapse whenever their expression was above the 80th or below the 20th percentile (depending on whether high or low expression was associated with high risk of relapse, respectively). The number of genes associated with a high risk of relapse was summarised for all samples using each possible signature from 1 to 15 genes. We specifically selected signatures with at least 10% of the samples in the group at high risk of relapse. p Values (Wald statistics) were calculated for each signature to identify the one with the strongest association with RFS.
Validation of the gene expression signature
The optimal prognostic signature identified in the test series was further subjected to validation in both validation series. Stage II CRC samples within each series were categorised into a low or high risk of relapse group based on the number of genes exceeding the 80th and 20th percentile levels of each gene in the signature. The expression data in validation series II was derived from Affymetrix HG-U133 Plus2.0 microarrays and, for genes targeted by multiple probe sets, the median expression from the well-annotated probe sets was used further (excluding probe sets with low specificity, annotated with ‘_x_at’).
Statistics
Kaplan–Meier survival analyses with log rank test were used to estimate 5-year RFS where relapse or death from CRC were defined as events, and patients were censored at last follow-up, death from other cancer, non-cancer death or treatment-related death within 5 years. Survival data from validation series II were indicated as disease-free survival and, according to their publication,13 ,18 relapse of disease was defined as an event and hence was in compliance with our definition. In Cox proportional hazard regression models, Wald statistics were used to calculate the p values in both univariate and multivariate Cox regression analyses. In the multivariate analyses all parameters were entered into a forward stepwise method for all clinical and molecular parameters. A p value <0.05 was considered statistically significant. PASW 18.0 (SPSS Inc) was used in Kaplan–Meier and Cox regression analyses. Partek Genomics Suite Version 6.5 (Partek Inc, Michigan, USA) was used to calculate correlation coefficients (Pearson) between samples and gene expression data. Functional enrichment analyses were performed by the Database for Annotation, Visualisation and Integrated Discovery (DAVID),27 where enrichment scores within known pathways, as defined by the Kyoto Encyclopedia of Genes and Genomes (KEGG), were weighted against the total number of analysed genes represented on the microarrays (background). Enriched KEGG pathways with modified Fisher exact p values <0.05 were considered statistically significant.
Results
Stepwise identification of a prognostic gene expression signature for stage II CRC patients
The initial list of 17 617 genes was filtered based on expression data from the test series, enriching for the 3336 genes with metastasis-associated expression changes (stage IV vs stage I) and accordingly associated with prognosis (stage IV-like expression in stage II poor survivors), and thus more likely to identify a robust prognostic classifier (see Methods). Subsequently, by lasso penalised multivariate Cox proportional hazards analyses, prognostic gene expression signatures ranging in size from 1 to 15 genes were identified (at reduced stringency of the penalty). Based on a threshold at the 80th and 20th percentiles of the gene expression measures, the samples were divided into low and high risk of relapse groups for each signature.
The prognostic gene expression signatures were ranked based on predictive performance in the test series (p values) for the actual number of genes associated with poor survival, and a 13-gene expression signature was identified as optimal. The ranking of the combinations of gene expression signatures revealed that at least five genes with a positive prognostic score were needed to separate the patients with a low risk of relapse from those with a high risk of relapse. Poor prognosis was associated with low expression of the genes PIGR, CXCL13, MMP3, TUBA1B and CXCL10 and high expression of SESN1, AZGP1, KLK6, EPHA7, SEMA3A, DSC3, ENPP3 and BNIP3 (table 1). According to the applied lasso penalised algorithm for variable selection, the identified genes were highly associated with survival, as well as showing a high variance and low degree of correlation in the gene expression compared with the 3336 genes included in the analysis (see figure 1 in online supplement).
Identities of the 13 genes in the prognostic expression signature and their univariate association with prognosis
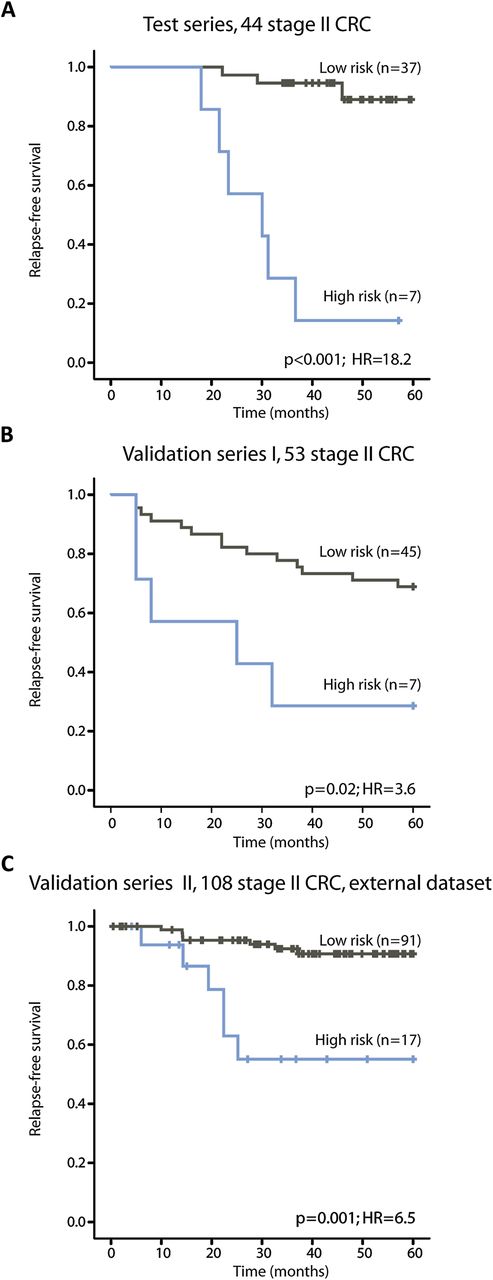
In the test series, 16% of the patients were identified as having a high risk of relapse and their 5-year RFS rate was 14% compared with 89% in patients identified as having a low risk of relapse (figure 2A and table 2, p<0.001, HR=18.2).
Kaplan–Meier survival curves illustrating relapse-free survival among patients with stage II colorectal cancer (CRC). (A) In the test series the low-risk and high-risk groups of relapse are well separated, as expected (p<0.001). (B, C) In both validation series I and II, the prognostic gene expression classifier identifies a low and high risk of relapse groups with statistical significance (p=0.02 and p=0.001, respectively).
Univariate and multivariate Cox regression analysis (5-year relapse-free survival) of the 13-gene prognostic signature and clinical factors in stage II colorectal samples from the test series and validation series I and II
Validation of the gene expression signature in two independent series of stage II CRC samples
In validation series I, 13% of the patients were assigned a high risk of relapse. There was a statistically significant difference between the low-risk and high-risk groups (figure 2B and table 2, 5-year RFS 69% vs 29%, p=0.02, HR=3.6). For these patients, 10-year follow-up time was available. The difference in survival rates between the risk groups remained statistically significant after 10 years (p=0.02, HR=3.1; data not shown).
Stage II CRC samples in validation series II were used as an external and independent validation series for the 13-gene prognostic expression signature. These patients were collected from a different population from the in-house datasets and analysed on a different version of the Affymetrix microarrays. In total, 16% were identified as high-risk patients in this series with a 5-year RFS rate of 55% compared with 91% in the low-risk patients (figure 2C and table 2, p=0.001, HR=6.5).
Associations between the 13-gene prognostic classifier and clinical parameters
To assess whether the prognostic signature was a strong prognostic classifier independent of various clinicopathological features, clinical data were included in both univariate and multivariate Cox regression analyses (table 2). In univariate analyses, the prognostic signature was the strongest variable associated with prognosis in both the test series and validation series. Patients who had received adjuvant therapy in validation series II had a poorer outcome than those who had not received treatment (p=0.02, HR=3.7). In multivariate analyses, the prognostic signature was an independent prognostic classifier in all three sample series (table 2, multivariate p≤0.004, HR ≥5.1). There were no associations between risk stratification according to the 13-gene classifier and the different clinical and molecular parameters in the three series (table 3).
Thirteen-gene prognostic signature and associations with clinical parameters in stage II colorectal cancer samples
Specificity for stage II tumours
To investigate whether the 13-gene prognostic classifier for stage II CRC could also identify stage III patients with a poor prognosis, the prognostic score was recalculated including both stage II and III samples. As expected, the stage II samples in the test series were separated into low and high risk of relapse groups whereas the signature could not separate the stage III samples (see figure 2A in online supplement). Samples in validation series I were collected before adjuvant chemotherapy became standard treatment of stage III CRC in Norway, and therefore patients in this sample series were not influenced by the treatment benefit. Nevertheless, only stage II samples were significantly separated into low- and high-risk groups (see figure 2B in online supplement).
Discussion
The microarray technology has been shown to be highly applicable in gaining an insight into carcinogenesis.28 In the present study we used a high-resolution microarray with probes for each exon of each gene in the genome combined with a stringent statistical approach to identify a high-risk stage II patient group. Two independent sample series were analysed, generating robust gene expression measurements targeting genes along their full lengths. This may have contributed to the robustness of the signature presented here which, in addition to the clinically independent in-house sample series, was validated in a third independent publicly available dataset. The samples in the latter series (validation series II) had been analysed by a different type of expression microarray from the in-house data series, targeting primarily the 3′ end of the genes.13 ,18
There is a high risk of overfitting in survival modelling of high dimensional data, characterised by a reduced significance of the predictor when applied to an independent dataset. To address this problem we applied a Cox proportional hazards model using lasso penalisation for optimal selection of genes, favouring selection of genes with a strong prognostic value, high expression variances and low correlation among each other, with the purpose of preventing overfitting.25 ,29 ,30 The potential of the lasso method has previously been described in a study on breast cancer25 and has so far not been implemented in CRC studies. In this study we have successfully applied this method and identified a 13-gene prognostic classifier of stage II CRCs which we have named ColoGuideEx.
Today, patients with stage II CRC are considered for adjuvant chemotherapeutic treatment if they are at a high risk of relapse based on clinical and pathological evaluation. According to the recommendations of the American Society of Clinical Oncology, adverse factors include advanced T stage, few examined lymph nodes, tumour perforation and low tumour differentiation.5 Information about these risk factors was only available for the test series and, owing to small numbers within each subcategory, no conclusion on their prognostic impact can be drawn from the present study. It should be noted that the high-risk patient group did not include those with pT4 stage or low-grade tumours. This is in compliance with a recent study by Salazar and colleagues which showed a disconcordance in risk stratification between their signature and clinical risk factors,17 underlining the need for additional molecular information to identify more precisely patients with the least favourable outcome. MSI status has also been shown to have associations with patient survival.10 In this study none of the MSI tumours (test series and validation series I) were categorised as high-risk samples according to the gene expression signature, in agreement with the favourable prognosis associated with MSI.
In the process of reducing thousands of genes to an informative set for outcome in stage II patients we initially identified genes with expression levels associated with metastatic capacity (ie, those that distinguished between stage I and stage IV). Functional analysis of the genes supported their biological relevance (see table 4 in online supplement). Jorissen et al used a similar approach, comparing overlapping genes in different datasets to find prognostic subgroups for stage II and stage III CRC.13 They did not apply any further statistical model for the identification of their prognostic signature, and therefore the resulting large number of genes (n=128) may complicate the transfer to a routine clinical test.13 In our study we aimed to identify a non-redundant set of genes to simplify such a transfer. Two assays, ColoPrint and Oncotype DX, have been launched to improve risk prediction in early stage CRC31 ,32 with an 18- and 12-gene prognostic classifier, respectively.17 ,33 ColoPrint was validated in one independent dataset and the robustness of the signature is awaiting evaluation in a prospective trial.34 To our knowledge, the gene expression data from that study have not been made publically available, preventing an evaluation of the present prognostic classifier in those samples. Oncotype DX was not identified by a genome-wide gene expression approach but after analyses of a few hundred genes selected from the literature due to claimed prognostic value,33 ,35 also calling for additional validation.36
The test series in this study consisted of samples from a consecutive collection of patients with CRC. Sixteen per cent of patients with stage II CRC were identified as high-risk patients, comparing well with the survival rate in stage II patients.2 A similarly sized subgroup was identified in both validation series I and II (13% and 16%, respectively). Generally, in other studies seeking prognostic stratification of stage II patients, a higher percentage of the patients has been categorised into poor prognosis groups ranging from 37% to 51%.13 ,14 ,17 ,18 This probably reflects the different statistics used to classify patients. Validation series I was preselected to be enriched for stage II patients with recurrent disease (5-year RFS 37%). The identification of a high-risk profile in only 13% of the samples therefore does not correctly represent the total relapse rate for these patients, but is a result of the use of the same stringent criteria for patient stratification in all three sample series (the 20th and 80th percentiles of expression values). The gene signature presented here convincingly holds prognostic information across three patient series. The ColoGuideEx-stage II was identified by statistical means, ensuring no or very low covariation among the genes that constitute the classifier, an advantage when transferring a short gene list to a clinical test.
When applied to stage III tumours, the 13-gene signature was not able to distinguish samples with high and low relapse rates (see figure 2 in online supplement). The inability to correctly separate patients with stage III CRC could be explained by the use of adjuvant chemotherapy. However, samples from stage III cancers from the expanded part of the validation series I were indeed collected before adjuvant chemotherapy became standard treatment. Also, in this series the signature did not correctly identify high-risk patients with stage III CRC, and we therefore conclude that the prognostic signature is specific for patients with stage II disease.
Evading immune surveillance and subsequent destruction has recently been suggested as a novel hallmark of cancer by Hanahan and Weinberg.37 We have recently shown that the immunity index of CRC is striking and associated with age at disease onset.38 Interestingly, several of the genes in the ColoGuideEx classifier presented here are also related to the immune system, such as the chemokines (CXCL13 and CXCL10), ENPP3, BNIP3, AZGP1 and PIGR. PIGR is a receptor expressed on epithelial cells and is important in regulation of the transcytosis of polymeric immunoglobulins. PIGR expression is reported in normal colonic tissue but is reduced in CRC.39 Several of the genes have been shown to be associated with metastatic processes. The protein encoded by the DSC3 is a type of cadherin and is important in cell adhesion, and EPHA7 encodes an Eph receptor that is important for cell communication. The metalloproteinases (MMPs) are responsible for degradation of extracellular matrix components, and altered expression of MMP3 is reported to be associated with a poor prognosis in CRC.40 SEMA3A is a member of the semaphorin family of genes with various roles including regulation of axon guidance and cell migration,41 and has been shown to have an inhibitory effect on tumour growth and angiogenesis.42 However, little is known about its clinical relevance, and in this classifier a high expression of SEMA3A is associated with a poor prognosis, which is in line with findings in pancreatic cancer.43 Another interesting gene in the signature is KLK6, the homologue to KLK3, encoding the prostate-specific antigen which is widely used as a detection and monitoring biomarker for prostate cancer. KLK6 protein expression has previously been suggested to be associated with a poor prognosis in CRC.44
Refinements in the prognosis of patients with stage II CRC are needed, and implementation of molecular testing in clinical care could improve selection. The ColoGuideEx presented here contains a small set of 13 optimally combined genes for robust risk assessment of stage II patients. It is the first CRC signature successfully validated in independent national and international patient series, as well as across time periods with different treatment regimens and between microarray platform generations. Validation of ColoGuideEx at the single patient level in a prospectively designed study is needed and parallel analyses with promising tests such as Oncotype DX and ColoPrint are warranted.
References
Supplementary materials
Supplementary Data
This web only file has been produced by the BMJ Publishing Group from an electronic file supplied by the author(s) and has not been edited for content.
Files in this Data Supplement:
- Download Supplementary Data (PDF) - Manuscript file of format pdf
Footnotes
THÅ and AS contributed equally to this work.
-
Funding The study has been financed by grants from the Norwegian Cancer Society (PR-2006-0442 (RAL), including a PhD grant to THÅ, and PR-2007-0166 (RIS)) and by a grant from the Research Council at Rikshospitalet-Radiumhospitalet Health Enterprise (RAL), including a PhD grant to AS.
-
Competing interests None.
-
Ethics approval The Regional Committee for Medical and Health Research Ethics, South-Eastern Norway. The research conformed to the Declaration of Helsinki and the research biobanks have been registered according to national legislation (numbers 2781 and 236-2005-16141). This study (amendment number 2010/1805) is part of a project approved by the Regional Committee for Medical and Health Research Ethics (numbers 1.2005.1629 and S-09282c 2009/4958) which requires that informed consent is obtained from patients being enrolled to the study.
-
Provenance and peer review Not commissioned; externally peer reviewed.
-
Data sharing statement Raw data are publicly available in the Gene Expression Omnibus (GEO) database (accession number GSE24550, GSE29638, and GSE30378).