Article Text

Abstract
Background Obesity is associated with accumulation of macrophages in white adipose tissue (WAT), which contribute to the development of insulin resistance. Germ-free (GF) mice have reduced adiposity and are protected against diet-induced obesity,
Objective To investigate whether the gut microbiota and, specifically, gut-derived lipopolysaccharide (LPS) promote WAT inflammation and contribute to impaired glucose metabolism.
Method Macrophage composition and expression of proinflammatory and anti-inflammatory markers were compared in WAT of GF, conventionally raised and Escherichia coli-monocolonised mice. Additionally, glucose and insulin tolerance in these mice was determined.
Results The presence of a gut microbiota resulted in impaired glucose metabolism and increased macrophage accumulation and polarisation towards the proinflammatory M1 phenotype in WAT. Monocolonisation of GF mice for 4 weeks with E.coli W3110 or the isogenic strain MLK1067 (which expresses LPS with reduced immunogenicity) resulted in impaired glucose and insulin tolerance and promoted M1 polarisation of CD11b cells in WAT. However, colonisation with E.coli W3110 but not MLK1067 promoted macrophage accumulation and upregulation of proinflammatory and anti-inflammatory gene expression as well as JNK phosphorylation.
Conclusion Gut microbiota induced LPS-dependent macrophage accumulation in WAT, whereas impairment of systemic glucose metabolism was not dependent on LPS. These results indicate that macrophage accumulation in WAT does not always correlate with impaired glucose metabolism.
- Endotoxin
- gnotobiotic mice
- gut microbiota
- metabolic inflammation, inflammation
- E coli
- endotoxin
- energy metabolism
- obesity
- inflammatory diseases
- macrophages, obesity
- colonic microflora
- intestinal permeability
- prebiotic
- mucosal immunity
- cardiovascular disease
- intestinal epithelium
- intestinal tract
- lipid metabolism
This is an open-access article distributed under the terms of the Creative Commons Attribution Non-commercial License, which permits use, distribution, and reproduction in any medium, provided the original work is properly cited, the use is non commercial and is otherwise in compliance with the license. See: http://creativecommons.org/licenses/by-nc/3.0/ and http://creativecommons.org/licenses/by-nc/3.0/legalcode
Statistics from Altmetric.com
- Endotoxin
- gnotobiotic mice
- gut microbiota
- metabolic inflammation, inflammation
- E coli
- endotoxin
- energy metabolism
- obesity
- inflammatory diseases
- macrophages, obesity
- colonic microflora
- intestinal permeability
- prebiotic
- mucosal immunity
- cardiovascular disease
- intestinal epithelium
- intestinal tract
- lipid metabolism
Significance of this study
What is already known on this subject?
-
The gut microbiota is altered in obese mice and humans.
-
Germ-free mice have reduced adiposity and are resistant to diet-induced obesity.
-
Obesity and insulin resistance are associated with inflamed adipose tissue.
What are the new findings?
-
The gut microbiota promotes adipose inflammation.
-
Macrophage recruitment to adipose tissue requires lipopolysaccharide (LPS).
-
E.coli promotes macrophage polarisation to a proinflammatory (M1)-biased phenotype, which is independent of LPS.
-
E.coli-induced impairment of glucose and insulin tolerance in mice does not require proinflammatory LPS.
How might it impact on clinical practice in the foreseeable future?
-
Understanding the mechanisms by which the gut microbiota induces metabolic diseases may provide new diagnostic and therapeutic targets to treat these life-threatening diseases. It also demonstrates the power of combining bacterial genetics with gnotobiotic animal models to study host metabolism.
Introduction
Obesity is associated with insulin resistance and chronic low-grade inflammation characterised by accumulation of proinflammatory M1 macrophages in white adipose tissue (WAT).1–3 Recent evidence showing that germ-free (GF) mice are protected against diet-induced obesity and exhibit reduced WAT inflammation and insulin resistance4–6 indicates a role for gut microbiota in the link between obesity, inflammation and insulin resistance. Furthermore, obese humans have reduced gut microbial diversity,7 and modulation of the gut microbiota either by antibiotics or prebiotics improves metabolic and inflammatory properties, suggesting a direct role of the gut microbiota in metabolic diseases.8–10
It is not clear which microbial factors promote WAT inflammation but the bacterial endotoxin lipopolysaccharide (LPS) has been suggested as a key factor. Obese mice and humans with type 2 diabetes have increased plasma LPS concentrations11 ,12 and LPS promotes secretion of proinflammatory cytokines by activating Toll-like receptor (TLR) 4.13 Furthermore, chronic subcutaneous infusion with LPS results in increased macrophage accumulation and expression of inflammatory markers in WAT and insulin resistance in the liver.11 LPS therefore constitutes a putative link between microbially induced inflammation, obesity and metabolic diseases. Here we use gnotobiotic mice coupled with bacterial genetics to investigate if LPS originating from E.coli in the gut is sufficient to promote glucose and insulin tolerance and macrophage accumulation in WAT.
Material and methods
Mice and bacterial strains for monocolonisation
GF male Swiss Webster mice, 10–12 weeks old, were maintained in flexible film isolators under a strict 12 h light cycle. GF status was verified regularly by anaerobic culturing in addition to PCR for bacterial 16S rDNA.14 Both GF and conventionally raised (CONV-R) mice were fed autoclaved chow diet (Labdiet) ad libitum.
E.coli strains W3110 and MLK1067 (W3110 waaN) were used for monocolonisation. Both strains express type-1 fimbriae but not P-pili or α-haemolysin.15 W3110 is a well-characterised wild-type strain and the isogenic strain MLK1067 was chosen because it has reduced immunogenicity compared with W3110.15–17 GF mice were inoculated for 4 weeks with E.coli W3110 or MLK106718 (3–4×10⁹ colony-forming units (CFU) per cage; ∼109 per mouse). Final colonisation densities were determined from mouse ceca by serial dilution and plating on Luria-Bertani agar.
Epididymal WAT and plasma were harvested after a 5 h fast.
DEXA, insulin and glucose tolerance tests and measurements of plasma leptin, lipids and insulin levels
DEXA was performed as earlier described.19 Insulin and glucose tolerance tests were performed by injecting insulin (0.75 U/kg body weight) or glucose (2 g/kg body weight), respectively, intraperitoneally after a 5 h fast. Tail blood samples were collected at 0, 30, 60, 90 and 120 min and blood glucose levels were determined using a HemoCue glucose 201+ analyser (HemoCue, Ängelholm, Sweden). Fasting leptin, free fatty acids, triglycerides and insulin were measured with kits from Meso Scale (Gaithersburg, Maryland, USA), Abcam (Cambridge, Massachusetts, USA), Thermo Scientific (Waltham, Massachusetts, USA) and Crystal Chem (Downers Grove, Illinois, USA), respectively, according to the manufacturers' protocols.
Immunohistochemistry of WAT
Paraffin-embedded epididymal WAT sections (5 μm) were deparaffinised and processed for antigen retrieval with a 2100 Retriever using 1× DIVA solution and Hot Rinse (HistoLab Products AB, Gothenburg, Sweden). Endogenous peroxidase activity was quenched by incubating slides in 0.3% H2O2 in phosphate-buffered saline (PBS) for 30 min before blocking in 5% rabbit serum, 1% bovine serum albumin and 0.1% Triton X-100 at room temperature for 30 min. Macrophages were stained with MAC-2/galectin-3 antibody (online supplementary table S1) diluted 1:500 in blocking buffer overnight at 4°C, which was detected with a biotinylated anti-rat (10 μg/ml) antibody. Immune complexes were detected by VECTASTAIN Elite ABC reagent followed by colour development using NovaRed substrate solution (Vector Laboratories, Burlingame, California, USA), according to the manufacturer's instructions, and counterstained with haematoxylin. Crown-like structures were counted in 15–40 mm2 of histological sections per mouse.
Culture and stimulation of RAW 264.7 macrophages
RAW 264.7 macrophages (ATCC, Manassas, Virginia, USA) were maintained in Dulbecco's modified Eagle's medium (PAA Laboratories, Pasching, Austria) containing 100 U/ml penicillin, 100 mg/ml streptomycin, 2 mM L-glutamine, 2 mM sodium pyruvate and 10% fetal calf serum. Cells were seeded at equal densities and upon reaching confluence they were washed and incubated with heat-killed E.coli or control medium. Tumour necrosis factor α was measured in the supernatant by Meso Scale immunoassay after 4 h incubation according to the manufacturer's protocol. In separate experiments, cells were lysed in RTL buffer (Qiagen, Hilden, Germany) and snap frozen in liquid nitrogen.
Isolation of adipose tissue macrophages
Epididymal WAT was minced thoroughly and resuspended in 15 ml digestion solution (7 ml Hanks' solution, 3 ml 7.5% bovine serum albumin (BSA), and 20 mg collagenase type II (Sigma Aldrich, St Louis, Missouri, USA)). Tissue digestion was performed at 37°C using a shaker at 120 rpm for 40 min. Adipocytes were removed and the stroma vascular fraction was centrifuged (1200 rpm, 4°C, 5 min) and subsequently resuspended in 1 ml selection buffer (PBS, 2 mM EDTA, and 0.5% BSA). CD11b cells were selected using CD11b microbeads (Miltenyi Biotec, Auburn, California, USA), according to the manufacturer's instructions.
Flow cytometry analysis
Adipose tissue macrophages were incubated with BD Fc Block (BD Biosciences, Franklin Lakes, New Jersey, USA) for 5 min, followed by incubation with monoclonal antibodies (online supplementary table S1). After washing, cells were analysed using an Accuri C6 flow cytometer with CFlow Plus analysis software (Accuri Cytometers, Ann Arbor, Michigan, USA). Non-specific antibodies conjugated to the corresponding fluorochromes were used as negative controls, and the fluorescence threshold was set so that 2.5% of the total cells were positive for fluorescence. The percentage of positive cells for the antibodies of interest was determined by the percentage of cells exceeding the threshold obtained with non-specific antibodies.
LPS analysis
Blood was collected from the mouse portal vein using a pyrogen-free syringe/needle, and plasma was immediately isolated and frozen in liquid nitrogen. LPS concentration was measured using Endosafe-MCS (Charles River, Lyon, France) based on the limulus amoebocyte lysate (LAL) kinetic chromogenic methodology that measures colour intensity directly related to the endotoxin concentration in a sample. Plasma was diluted 1/10 with endotoxin-free buffer to minimise interferences in the reaction (inhibition or enhancement) and heated for 15 min at 70°C. Each sample was diluted with endotoxin-free LAL reagent water (Charles River) and treated in duplicate and two spikes for each sample were included in the determination.20
To determine the LPS content in the diet, randomly selected pellets were ground in endotoxin-free tubes (Greiner, Frickenhausen, Germany). The ground diet (100 mg) was sonicated in 10 ml endotoxin-free LAL reagent water (Charles River) and filtered (0.22 μm, Millipore). The solution was diluted in endotoxin-free LAL reagent water and LPS concentration was measured using Endosafe-MCS. Each sample was treated in duplicate and two spikes for each sample were included in the determination.
The lower limit of detection was 0.005 endotoxin units (EU)/ml.
Quantitative RT-PCR
RNA was isolated using RNeasy kit with on-column DNase treatment (Qiagen, Hilden, Germany). cDNA templates were synthesised from total RNAs using the high-capacity cDNA reverse transcription kit (Applied Biosystems, Foster City, California, USA) according to the manufacturer's instructions. qRT-PCR assays were performed in 25 μl reactions containing 1× SYBR Green Master Mix buffer (Thermo Scientific, Waltham, Massachusetts, USA), and 900 nM gene-specific primers (300 nM primer concentrations were used to assess L32 transcripts). Gene expression data were normalised to the ribosomal protein L32. Primer sequences are reported in online supplementary table S2.
Immunoblot analysis
Protein extracts (20 μg) were loaded onto 10% NuPAGE Bis-Tris gels (Invitrogen, Carlsbad, California, USA) and blotted to Hybond P PVDF membranes (Invitrogen). After 1 h blocking in PBS Tween-20 (PBST) supplemented with 5% fat-free milk powder the membranes were incubated overnight with primary antibodies diluted 1:1000 in blocking buffer and subsequently washed in PBST, incubated for 1 h with secondary antibodies diluted 1:2000 in blocking buffer, and finally washed in PBST (antibodies are listed in table S1). Proteins were detected with LumiGLO blotting detection kit (Cell Signaling, Danvers, Massachusetts, USA).
Statistical analysis
Data are represented as mean±SEM. Analyses between groups of two were determined by Student t test, whereas comparisons of three or more groups were analysed by one-way analysis of variance with ad hoc Bonferroni post tests using GraphPad Prism 5 software.
Results and discussion
Gut microbiota increases adiposity, impairs glucose and insulin tolerance and increases macrophage accumulation in WAT, even in the absence of a high-fat diet
It has previously been shown that colonisation of C57BL/6 mice results in a significant increase in adiposity and impaired glucose and insulin tolerance even in the absence of a high-fat diet.19 Here we used Swiss Webster mice as they are generally bigger and have increased adiposity compared with C57BL/6 mice. As expected, we showed significant increases in epididymal WAT and body fat in CONV-R compared with GF mice on a chow diet at 12 weeks of age (figure 1A,B). Adiposity in the CONV-R mice was similar to that previously reported for C57BL/6 mice fed a high-fat diet for 8 weeks (33±2 vs 37±5 mg epididymal WAT/g body weight, respectively),4 confirming Swiss Webster mice as a suitable model for mild obesity. Furthermore, by using a chow diet, we avoided confounding factors such as saturated fatty acids present in high-fat diets. Colonisation of 12-week-old GF mice with a normal microbiota for 14 days increased body fat to the level seen in CONV-R mice (figure 1B). As expected, we observed increased plasma leptin and insulin levels as well as impaired glucose and insulin tolerance in 12–14-week-old CONV-R mice compared with age-matched GF mice on a chow diet (figure 1C–F). No differences in plasma levels of free fatty acids or triglycerides were seen (data not shown).

Gut microbiota increases adipose tissue weight and impairs glucose homoeostasis. (A) Epididymal white adipose tissue (WAT) weight in germ-free (GF) and conventionally raised (CONV-R) mice (n=8–9 mice per group). (B) Body fat determined by DEXA in GF and CONV-R mice and in GF mice colonised with a normal microbiota for 14 days (CONV-D) (n=8–10 mice per group). (C) Fasting plasma leptin and (D) insulin levels in GF and CONV-R mice (n=7–8 mice per group). (E) Glucose (n=8–9 mice per group) and (F) insulin tolerance in GF and CONV-R mice (n=5–6 mice per group). Mean values ± SEM are plotted; *p<0.05, ***p<0.001 versus GF.
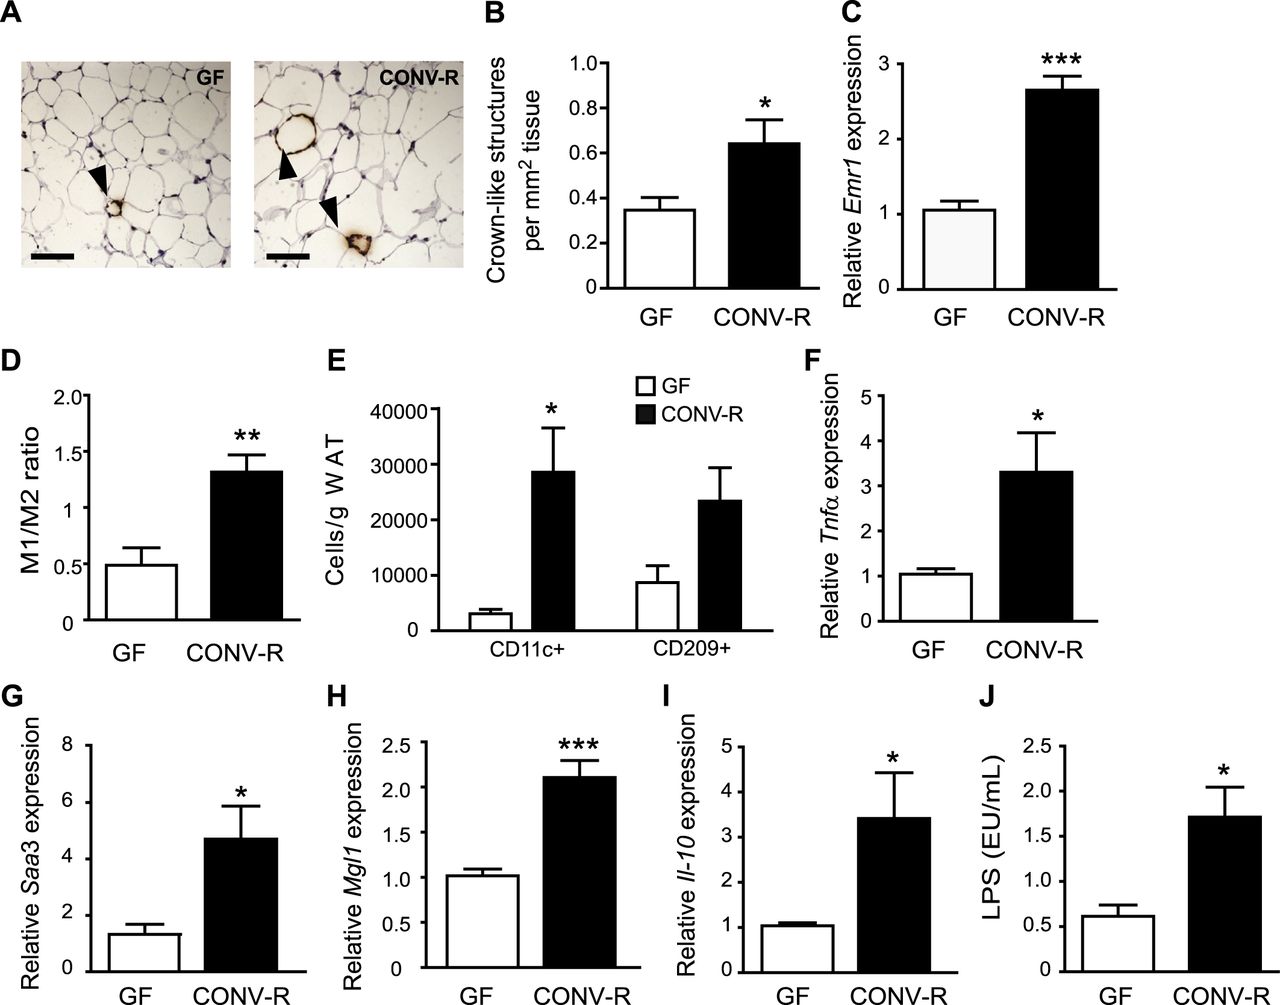
To investigate the effect of gut microbiota on macrophage accumulation in WAT, we stained epididymal WAT for MAC-2 and showed increased formation of crown-like structures (CLS) in CONV-R mice compared with GF mice (figure 2A,B). CLS are histological elements representing accumulation of macrophages around dead adipocytes,21 and abundance of CLS has been shown to correlate with metabolic dysfunction in obese individuals.22 qRT-PCR analysis of WAT showed increased expression of the pan-macrophage marker Emr1 mRNA (which encodes EGF-like module receptor, also known as F4/80) in CONV-R mice compared with GF mice (figure 2C). FACS analysis of CD11b adipose tissue macrophages with antibodies against CD11c (M1) and CD209 (M2) showed an increased M1/M2 ratio in WAT from CONV-R mice compared with GF mice (figure 2D, online supplementary figure S1A,B) and an increased number of CD11c cells/g WAT (figure 2E). There was also a trend towards an increased number of CD209 cells/g WAT (figure 2E, p = 0.06). qRT-PCR analysis showed that both the proinflammatory cytokines Tnfα and Saa3 (figure 2F,G) and the anti-inflammatory markers Mgl1 and Il-10 (figure 2H,I) were increased in WAT from CONV-R mice compared with GF mice. These data suggest that the increased ratio of M1 macrophages is caused primarily by increased infiltration of these cells.

Gut microbiota increases crown-like structure (CLS) formation, M1/M2 ratio and expression of proinflammatory and anti-inflammatory cytokines in white adipose tissue (WAT). (A) Representative MAC-2 immunostaining of WAT from germ-free (GF) and conventionally raised (CONV-R) mice. Arrowheads indicate CLS. Scale bars = 100 μm. (B) Quantification of CLS (n=9 mice per group). (C) qRT-PCR analysis of Emr1 expression in WAT from GF and CONV-R mice (n=8–9 mice per group). (D) Ratio between WAT M1 and M2 macrophages determined by flow cytometry with antibodies against CD11c conjugated with phycoerythrin and CD209 conjugated antigen presenting cells, respectively (n=4 (GF) and 8 (CONV-R)). (E) Number of CD11c (M1) and CD209 (M2) macrophages per gram WAT (n=4). (F–I) qRT-PCR analysis of Tnfα, Saa3, Mgl1 and Il-10 expression in WAT from GF and CONV-R mice (n=8–9 mice per group). (J) Lipopolysaccharide (LPS) levels in blood sampled from the portal vein of GF (n=9) and CONV-R (n=15) mice. Mean values ± SEM are plotted; *p<0.05, **p<0.01, ***p<0.001 versus GF.
Gut microbiota increases plasma levels of LPS
Importantly, as we used a chow diet, the differences in glucose and insulin tolerance as well as macrophage accumulation and inflammation in WAT between CONV-R and GF mice could not be attributed to saturated fatty acids in the diet. We therefore hypothesised that these differences might be caused by components of the microbiota such as LPS. Indeed, we showed raised LPS levels (ie, metabolic endotoxaemia) in the plasma of CONV-R mice compared with GF mice on a chow diet (figure 2J). The diet contained 1.5 EU LPS/mg, which could explain the low levels of LPS present in the plasma of GF mice.
Colonisation with E.coli promotes adiposity and glucose and insulin tolerance independently of LPS
LPS has been associated with obesity and type 2 diabetes in mice and humans9 ,12 and subcutaneous administration of LPS promotes adiposity and a slight impairment of glucose metabolism.11 However, little is known about how LPS from the gut affects metabolism. We therefore investigated the importance of gut-derived LPS in mediating glucose and insulin tolerance and macrophage accumulation and inflammation by colonising GF mice with either E.coli W3110 or the isogenic mutant MLK1067, a strain with reduced immunogenicity owing to its penta-acylated lipid A component,15 for 4 weeks. We first confirmed that the mutant exhibited reduced capacity to induce Tnfα expression and tumour necrosis factor α secretion in murine RAW 264.7 macrophages (online supplementary figure S2A,B), and showed that W3110 and MLK1067 colonised the mouse gut approximately to the same bacterial density (1.1×10¹⁰ and 1.5×10¹⁰ CFU/ml for W3110 and MLK1067, respectively).
As expected, colonisation with E.coli W3110 but not MLK1067 increased plasma LPS levels compared with GF mice (figure 3A). However, colonisation with either E.coli strain increased epididymal WAT weight compared with GF mice (figure 3B). Plasma levels of leptin and insulin were higher in mice colonised with either strain compared with GF mice, with the highest levels found in mice colonised with MLK1067 (figure 3C,D). No differences in plasma levels of free fatty acids or triglycerides were observed with colonisation (data not shown) and no difference in food intake was seen (data not shown). Colonisation with either strain resulted in impaired glucose and insulin tolerance (figure 3E,F).
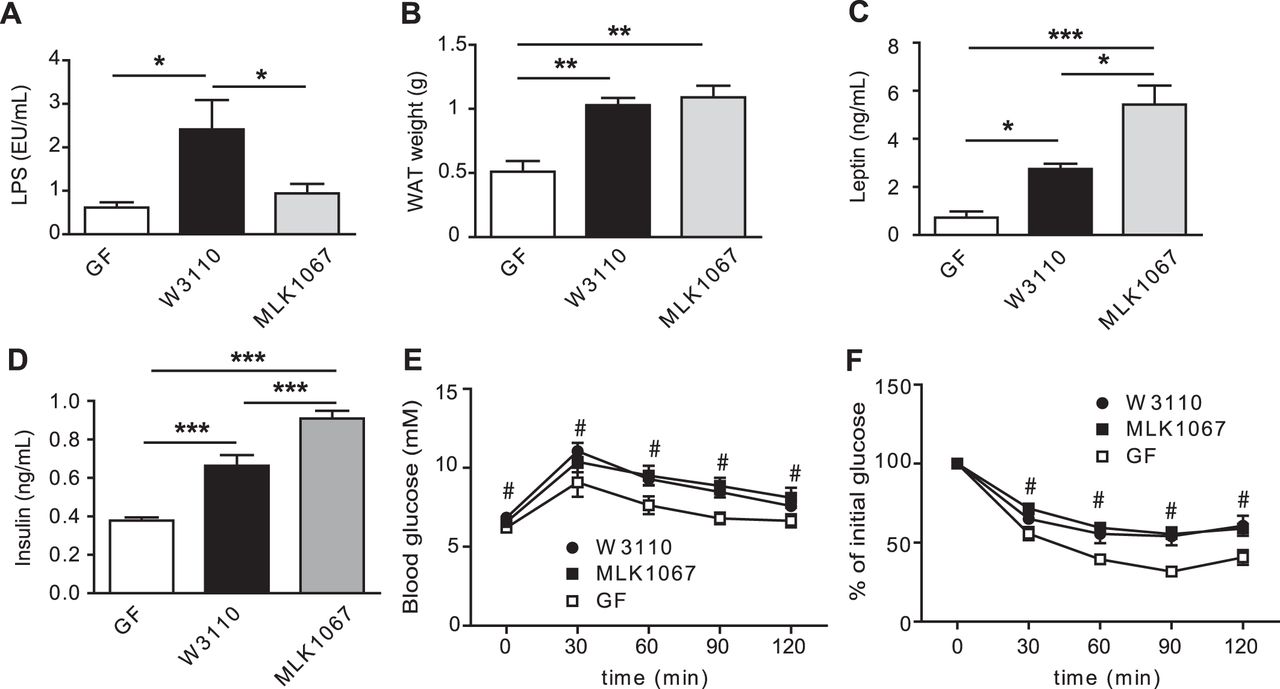
E.coli colonisation of germ-free (GF) mice increases white adipose tissue (WAT) weight and impairs glucose and insulin tolerance. (A) Lipopolysaccharide (LPS) levels in blood sampled from the portal vein of GF mice and mice colonised for 4 weeks with W3110 or MLK1067 (n=5-6 mice per group). (B) Epididymal WAT weight (n=9–10 mice per group). (C) Fasting plasma leptin and (D) insulin levels in GF and conventionally raised (CONV-R) mice (n=9–10 mice per group). (E) Glucose tolerance test (n=9–10 mice per group). (F) Insulin tolerance test (n=5–6 mice per group). Mean values ± SEM are plotted; *p<0.05; **p< 0.01; ***p< 0.001 versus GF in A–D; #p<0.05 vs GF for both W3110 and MLK1067 in panels E and F.
These findings show that monocolonisation with E.coli, even in the absence of wild-type LPS, is sufficient to increase adiposity and impair insulin and glucose tolerance. Other microbial components, such as peptidoglycan, may be important factors in modulating host glucose metabolism and adiposity. For example, mice deficient in the peptidoglycan receptors Nod1 and Nod2 are protected from high-fat diet-induced inflammation and insulin intolerance, and activation of NOD1 causes insulin resistance.23
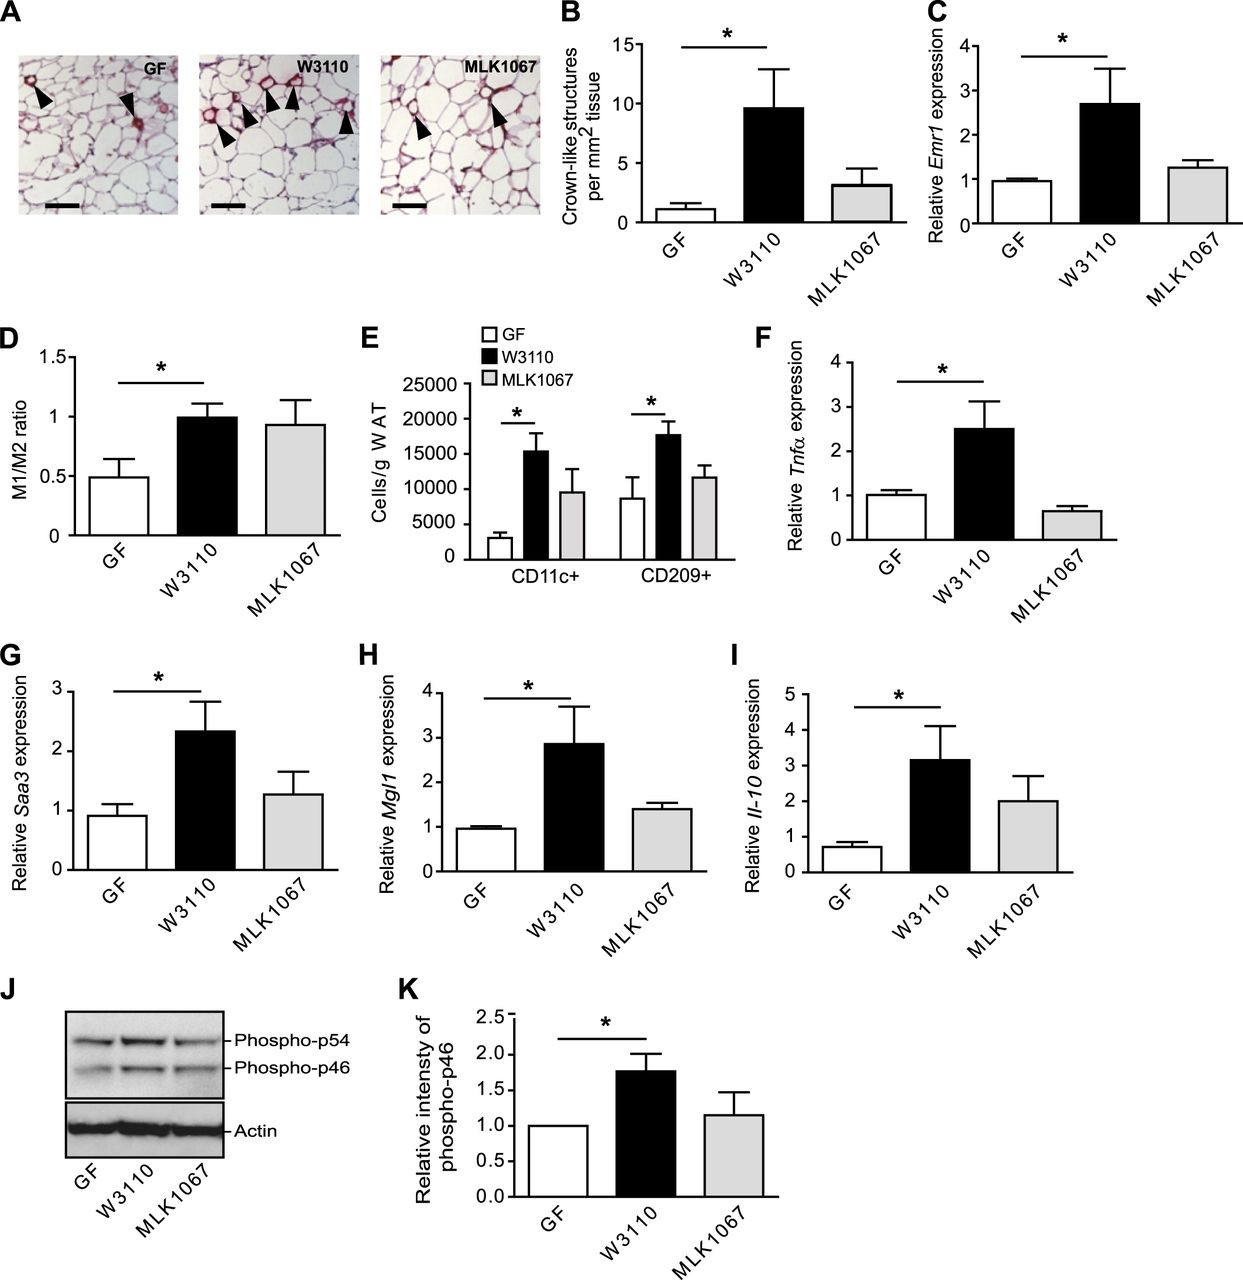
Gut-derived LPS increases macrophage accumulation and proinflammatory and anti-inflammatory markers in WAT
Colonisation with E.coli W3110, but not MLK1067, resulted in increased CLS formation (figure 4A,B) and increased expression of Emr1 (F4/80) (figure 4C). The observation that LPS is required for macrophage accumulation but not for adiposity is in agreement with earlier studies in which mice lacking CD14 or with a haematopoietic cell-specific TLR4 deletion (and hence reduced LPS signalling) develop obesity on a high-fat diet but show markedly reduced adipose tissue macrophage content.24
Gut-derived lipopolysaccharide (LPS) increases crown-like structure (CLS) formation, M1/M2 ratio and expression of proinflammatory and anti-inflammatory cytokines in white adipose tissue (WAT). (A) Representative immunostaining of MAC-2 in WAT from germ-free (GF) mice and mice colonised for 4 weeks with W3110 or MLK1067. Arrowheads indicate CLS. Scale bars = 100 μm. (B) Quantification of CLS (n=4–5 mice per group). (C) qRT-PCR analysis of Emr1 (F4/80) in WAT (n=6–7 mice per group). (D) Ratio between M1 and M2 activated macrophages in WAT determined by flow cytometry with antibodies against CD11c and CD209 conjugated (n=4 (GF) and 9 (W3110 and MLK1067)). (E) Number of CD11c+ (M1) and CD209 (M2) macrophages per gram WAT (n=4–5). (F–I) qRT-PCR analysis of Tnfα, Saa3, Mgl1 and Il-10 expression in WAT (n=5–6 mice per group). (J) Total protein extracts from WAT were analysed by immunoblotting with antibodies against phospho-JNK and actin. (K) Relative quantification of the phospho-p46 form of JNK normalised to actin (n=6 mice per group). Mean values ± SEM are plotted; *p<0.05.
To examine whether the increased macrophage infiltration in WAT from mice colonised with W3110 was associated with increased inflammation, we analysed the M1/M2 ratio and levels of proinflammatory and anti-inflammatory cytokines in WAT. The M1/M2 ratio increased approximately twofold after colonisation with either E.coli strain, but the increase was only significant in mice colonised with W3110 (figure 4D, online supplementary figure S3A,B). The number of both CD11c and CD209 cells was increased in mice colonised with W3110 (figure 4E) and accordingly, we also observed increased expression of both the proinflammatory markers Tnfα and Saa3 and the anti-inflammatory markers Mgl1 and Il-10 in WAT from W3110 colonised mice (figure 4F–I). Furthermore, immunoblot analysis revealed elevated levels of phosphorylated JNK (figure 4J,K) in WAT from W3110 colonised mice, indicative of increased inflammatory signalling. In contrast, none of these markers were increased by MLK1067 (figure 4F–K). The observation that an increased M1/M2 ratio is not necessarily reflected in the balance between proinflammatory and anti-inflammatory cytokines demonstrates the complex nature of macrophage polarisation and shows that multiple markers are required to study the inflammatory status of WAT.
Conclusion
Taken together, the gut microbiota affects host metabolism by several mechanisms that, in combination, may contribute to obesity and have profound effects on glucose metabolism. Here we demonstrate that LPS is sufficient to promote macrophage infiltration but is not essential for the impaired glucose metabolism associated with gut colonisation. Other microbial components have previously been shown to affect glucose and insulin tolerance,23 ,25 thus uncoupling LPS and WAT inflammation from impaired glucose metabolism. However, it is important to note that TLR4 recognition of LPS differs between mice and humans: penta-acylated MLK1067 LPS functions as a weak agonist for mouse TLR4 but is a potent antagonist for human TLR4.17 ,26
Acknowledgments
We thank Carina Arvidsson and Anna Hallén for superb technical assistance and Rosie Perkins (Wallenberg Laboratory at University of Gothenburg) for editing the manuscript.
References
Supplementary materials
Supplementary Data
This web only file has been produced by the BMJ Publishing Group from an electronic file supplied by the author(s) and has not been edited for content.
Files in this Data Supplement:
- Download Supplementary Data (PDF) - Manuscript file of format pdf
Footnotes
-
Funding This work was supported by the Swedish Research Council, Swedish Foundation for Strategic Research, Swedish Diabetes Foundation, Petrus and Augusta Hedlund Foundation, Torsten and Ragnar Söderbergs Foundations, Novo Nordisk Foundation, TORNADO (FP7-KBBE-222720, http://www.fp7tornado.eu/), AstraZeneca through collaboration with the Sahlgrenska Academy, and a LUA-ALF grant from Västra Götalandsregionen. CSR is the recipient of a postdoctoral fellowship from the Wenner-Gren foundation. PDC is a research associate from the FRS-FNRS (Fonds de la recherche scientifique, Belgium) and is the recipient of grants from the FSR (Fonds Spéciaux de Recherche, UCL) and the FRSM (Fonds de la Recherche Scientifique Médicale).
-
Competing interests None.
-
Provenance and peer review Not commissioned; externally peer reviewed.