Article Text

Abstract
Objective Gut homing of lymphocytes via adhesion molecules has recently emerged as new target for therapy in IBDs. We aimed to analyse the in vivo homing of effector (Teff) and regulatory (Treg) T cells to the inflamed gut via α4β7 and G protein receptor GPR15.
Design We assessed the expression of homing receptors on T cells in peripheral blood and inflamed mucosa. We studied the migration pattern and homing of Teff and Treg cells to the inflamed gut using intravital confocal microscopy and FACS in a humanised mouse model in dextran sodium sulfate-treated NSG (NOD.Cg-Prkdcscid-Il2rgtm1Wjl/SzJ) mice.
Results Expression of GPR15 and α4β7 was significantly increased on Treg rather than Teff cells in peripheral blood of patients with UC as compared with Crohn’s disease and controls. In vivo analysis in a humanised mouse model showed augmented gut homing of UC Treg cells as compared with controls. Moreover, suppression of UC (but not control) Teff and Treg cell homing was noted upon treatment with the α4β7 antibody vedolizumab. In contrast, siRNA blockade of GPR15 had only effects on homing of Teff cells but did not affect Treg homing in UC. Clinical vedolizumab treatment was associated with marked expansion of UC Treg cells in peripheral blood.
Conclusions α4β7 rather than GPR15 is crucial for increased colonic homing of UC Treg cells in vivo, while both receptors control UC Teff cell homing. Vedolizumab treatment impairs homing of UC Treg cells leading to their accumulation in peripheral blood with subsequent suppression of systemic Teff cell expansion.
- INFLAMMATORY BOWEL DISEASE
- IMMUNOLOGY
- CYTOKINES
This is an Open Access article distributed in accordance with the Creative Commons Attribution Non Commercial (CC BY-NC 4.0) license, which permits others to distribute, remix, adapt, build upon this work non-commercially, and license their derivative works on different terms, provided the original work is properly cited and the use is non-commercial. See: http://creativecommons.org/licenses/by-nc/4.0/
Statistics from Altmetric.com
Significance of this study
What is already known on this subject?
The adhesion molecule α4β7 has recently emerged as a new target for therapy in patients with IBDs.
The monoclonal antibody vedolizumab targeting α4β7 has been used successfully for clinical therapy of Crohn’s disease and UC.
GPR15 has recently been identified as a G protein-coupled homing receptor that controls homing of regulatory T (Treg) cells to the colon in mice.
What are the new findings?
Expression of α4β7 and GPR15 on human regulatory FoxP3+ T cells is differentially regulated by cytokines and both markers are upregulated on Treg cells in UC.
In vivo homing of Treg cells from patients with UC to the inflamed colon in humanised mice is augmented as compared with Treg cells from controls.
Targeting of adhesion molecule function by vedolizumab did not affect homing of Treg cells from controls yet revealed that α4β7 rather than GPR15 is crucial for controlling homing of Treg cells of patients with UC to the inflamed colon in vivo, while both molecules are involved in Teff cell homing in UC.
Clinical vedolizumab therapy results in accumulation of Treg cells in peripheral blood of patients with UC.
How might it impact on clinical practice in the foreseeable future?
Analysis of human T cell homing in vivo using humanised mice might be used to evaluate upcoming antiadhesion therapies and to study adoptive transfer systems for Treg cell based therapy of IBD.
GPR15 emerges as a new therapeutic target for blocking Teff cell homing in IBD.
Introduction
A key feature of the inflammatory response in IBD (Crohn’s disease (CD) and UC) is the rapid recruitment of leucocytes from the blood stream to the intestine via cell adhesion and transmigration through blood-vessel walls.1 ,2 Consistently, marked lymphocyte accumulation in the mucosa is one of the histological hallmarks of IBD where these cells are exposed to antigen presentation via antigen presenting cells (APCs) such as dendritic cells and macrophages.3–6 Encounters with cognate antigen triggering of T cell receptor signalling lead to shutdown of migratory T cell activity to allow T cell priming and subsequent polarisation.7 ,8 Subsequently, mucosal T cells rapidly migrate to the regional lymph nodes and finally reach the systemic circulation via the thoracic duct. Antigen experienced T cells can again enter into the gut mucosa by a specific homing process that is tightly controlled by regulatory molecules on the T cell surface and their ligands on intestinal endothelial cells.
Gut homing and interstitial migration are governed by a complex network of cell-intrinsic and cell-extrinsic factors that ensure the proper positioning of immune cells in the context of the local microenvironment.9 Hereby, mucosal homing of T cells is controlled by regulatory molecules on T cells and endothelial cells such as PSGL-1, ICAM-1 and LFA-1 as well as by chemokines and their specific receptors that orchestrate a multistep adhesion cascade involving tethering, rolling and sticking of T cells.10 ,11 Studies in recent years have identified that targeting of such mucosal T cell homing may be relevant for therapy in IBD. This is particularly true for the integrin α4β7 that is expressed on the surface of gut-tropic effector lymphocytes. To allow intestinal imprinting, expression of α4β7 on T cells is induced by T cell interaction with CD103 (integrin αE) expressing mucosal dendritic cells that produce the vitamin A metabolite retinoic acid via the enzyme retinaldehyde dehydrogenase 2.12 Homing of α4β7 expressing T cells is mediated by the specific interaction between α4β7 and its ligand MAdCAM-1, which is expressed under steady state conditions by gut endothelial cells.13
Although β7 integrins have recently been shown to control homing of innate immune cells with tolerogenic potential,14 several studies revealed that blockade of the α4β7/MAdCAM-1 system can be used to inhibit T cell-dependent experimental mucosal inflammation in vivo. Specifically, studies in murine models of chronic intestinal inflammation demonstrated that neutralising antibodies to α4, α4β7 and MAdCAM-1 prevent the entry of CD4+ T cells to the intestinal mucosa and can be used to suppress activity of mucosal inflammation.13 ,15–19 Moreover, treatment with the α4 blocker natalizumab was successfully used for clinical therapy of patients with IBD.20 ,21 Unfortunately, some patients developed JC virus-related progressive multifocal leucoencephalopathy probably due to blockade of α4β1-dependent lymphocyte homing to the brain.22 Therefore, the α4β7 specific antibody vedolizumab was developed and resulted in significant suppression of mucosal inflammation in patients with CD and UC.23 ,24 This beneficial effect is probably due to internalisation of α4β7 on lymphocytes upon vedolizumab binding that prevents MAdCAM-1-dependent gut homing to induce intestinal immunosuppression.25 ,26 Furthermore, the β7 blocker etrolizumab targeting α4β7 and αEβ7 integrins has been successfully tested in clinical studies in UC27 ,28 suggesting that blockade of adhesion molecules on immune cells may be of broad relevance for therapy of IBD.
In spite of these promising results on blockade of homing of effector T cells (Teff), however, little is known about the mechanisms that control homing of human regulatory T (Treg) cells to the inflamed bowel. Treg cells have been previously shown to suppress Teff cell activity in the inflamed IBD mucosa29–31 and their potential functional relevance has been suggested by clinical pilot studies using adoptive transfer of expanded Treg cells in patients with IBD in vivo.32 Interestingly, a recent study in mice identified the G protein receptor GPR15 as a specific regulator of Treg cell homing in the gut33 suggesting that Treg homing may differ from homing of Teff cells. Moreover, GPR15 controlled Treg homing to the colon rather than the small intestine33 raising the possibility that Treg homing in humans may vary among different intestinal target areas.
To study homing of Treg cells, we have developed a new system for assessment of homing of human T cells to the inflamed bowel in vivo by using humanised mice. We noted that α4β7 rather than GPR15 is crucial for colonic homing of UC Treg cells in vivo, while both receptors control Teff homing. The relevance of this finding was underlined by the observation that clinical vedolizumab treatment in patients with UC leads to significant reduction of the blood Teff/Treg ratio in this disease. Our findings suggest new avenues for future research on mechanisms controlling in vivo homing of human T cells from patients with IBD.
Methods
Patients with IBD
To determine the expression of adhesion molecules on T cells in humans, peripheral blood and colonic samples from patients with IBDs and controls were analysed (see online supplementary table S1). In these studies, colonic specimens from patients with CD and UC were studied and compared with samples from controls, as previously described.34 Gut samples were obtained from areas of active disease of resected specimens or biopsies from patients with CD and UC. The control group consisted of patients without IBD that underwent colonic resections or routine colonoscopy. In addition, blood samples were obtained from patients with CD and UC as well as from healthy controls. Some patients with UC were treated with vedolizumab (300 mg by intravenous infusion at weeks 0, 2 and 623) before blood collection, as specified in Results.
Immunohistochemistry in patients with IBD and controls
Cryosections from gut specimens of controls and patients with IBD were used for immunohistochemistry. Tissues were fixed in 4% paraformaldehyde, followed by sequential incubation with avidin/biotin-blocking reagent (Vector Laboratories) and protein-blocking reagent (Roth) to suppress unspecific background staining. Sections were incubated with primary antibodies specific for human CD4 (RPA-T4, BD Pharmingen), CD4-biotin (RPA-T4, Biolegend), CD8 (RPA-T8, BD Pharmingen), GPR15 (polyclonal, Bioss), FoxP3 (236A/E7, eBioscience) or α4β7 (vedolizumab, Entyvio, Takeda). Furthermore, some sections were incubated with appropriate isotype matched control antibodies or without primary antibody as negative controls. Subsequently, samples were incubated with secondary antibodies (Vectorlabs and Jackson Immuno Research) followed by incubation with streptavidin-conjugated Dylight 488 (Biolegend). Nuclei were counterstained with Hoechst dye (molecular probes) before final analysis by fluorescence and confocal microscopy (Leica SP8 or Leica SP5 Microscope). Positive cells in 6–10 high power fields were subsequently counted in all patients per condition. In some images an inset of a higher magnification was included to better identify the stained nuclei.
Isolation and flow cytometric analysis of human blood and lamina propria mononuclear cells
Peripheral blood mononuclear cells (PBMCs) from patients with IBD and controls were isolated as previously described.34 ,35 For FACS analysis of Treg cells, we first excluded duplicated cells (FSC-H/FSC-A) followed by gating on the T lymphocytes population in the forward sideward scatter (SSC-A/FSC-A). Afterwards we gated on CD4+ T cells. FoxP3+ CD4+ T cells were defined as Treg cells. Isolation of CD4+CD25+, CD4+CD25− and CD4+CD25+CD127dim/− Teff or Treg cells was performed by using the human CD4+CD25+ or CD4+CD25+CD127dim/− Treg Cell Isolation Kits (Miltenyi Biotec) according to manufacturer’s instructions. For GPR15 analysis human CD4+ T cells, CD4+CD25+ T cells and CD4+CD25− T cells were stained with an anti-GPR15 antibody (R&D systems), followed by an incubation with a specific mouse secondary IgG2b APC labelled antibody (R&D systems). In addition, specific labelled antibodies against α4-integrin (FITC, MZ18-24A9, Miltenyi Biotec), β7-integrin (PerCPcy5.5, FIB27, Biolegend), CD4 (Pacific Blue, VIT4, Miltenyi Biotec), CCR9 (PeCy7, L053E8, Biolegend), CCR5 (Alexa Fluor 700/647, HEK/1/85a, Biolegend), CTLA-4 (PeCy7, L3D10, Biolegend), GITR (APC, 621, Biolegend), CD25 (FITC, M-A251, Biolegend), CD127 (Pacific Blue, A019D5, Biolegend) or FoxP3 (Pe, 236A/E7, eBioscience), were used along with the isotype control antibodies PerCP/cy5.5 rat IgG2a (Biolegend), Alexa Fluor 700 rat IgG2a (Biolegend), Alexa Fluor 647 Mouse IgG2a, Pe/Cy7 mouse IgG2a (Biolegend), mouse IgG2b (Biolegend), FITC mouse IgG2b (Miltenyi Biotech) and Pe mouse IgG1 (eBioscience). For intracellular staining of FoxP3, cells were fixed and permeabilised with the Foxp3/Transcription Factor Staining Buffer Set (eBioscience). After washing, cells were analysed by flow cytometry (LSR Fortessa, BD).
Human T cell stimulation with cytokines and short-chain fatty acids
Isolated CD4+ T cells were cultured in RPMI medium 1640 (Gibco) containing 10% FCS (Pan Biotech) and 1% penicillin/streptocmycin (Biochrom) for 3 days in the presence of recombinant interleukin (IL) 6 (20 ng/mL Immunotools), IL-7 (10 ng/mL, Immunotools), IL-9 (10 ng/mL, Immunotools), IL-13 (25 ng/mL, Immunotools), IL-21 (10 ng/mL, Immunotools), IL-33 (10 ng/mL, Biolegend), TGF-ß1 (20 ng/mL, R&D Systems), butyric acid (Roth), propionic acid (Roth), isobutyric acid (abcr), formic acid (Merck) or medium alone. Cells were stimulated with anti-human CD3 (OKT3, eBioscience) and anti-human CD28 (CD28.2, BD Pharmingen) at a final concentration of 1 μg/mL.
Human T cell proliferation and apoptosis assays
CD4+ T cells were treated with indicated concentrations of vedolizumab and cultured for 3 days in the presence of anti-human CD3, anti-human CD28 antibodies and recombinant IL-2 (100 U/mL, Miltenyi Biotec). Staining was performed with the CellTrace Violet Cell Proliferation Kit (Life Technologies). Afterwards cell proliferation was analysed by flow cytometry. In some experiments, T cell apoptosis and necrosis was determined by FACS using annexin V (FITC, Biolegend) and propidium iodide (Pe, Bioscience).
MAdCAM-1/VCAM-1 adhesion assay
For adhesion assays, epoxy coated glass slides (Neolab) were incubated overnight at 37°C with recombinant human or murine MAdCAM-1 (both 5 µg/mL, R&D Systems) and human (5 µg/mL, eBioscience) or murine VCAM-1 (5 µg/mL, R&D Systems), dissolved in 20 mM HEPES (AMRESCO) and 150 mM NaCl. Afterwards slides were blocked with 5% BSA for 2 h at 37°C, and 200.000 CD4+ T cells, Treg enriched CD4+CD25+ cells or CD4+CD25− Teff cells, respectively, were resuspended in adhesion buffer as previously described,36 added to each well and allowed to adhere for 90 min at 37°C. In addition, cells were treated with 1 mM MnCl2 and indicated concentrations of vedolizumab. Cells were washed with adhesion buffer to remove non-adherent cells. Subsequently, cells were fixed in 4% paraformaldehyde followed by nuclear counterstaining with Hoechst dye before final analysis by fluorescence and confocal microscopy (Leica SP8 or Leica SP5 Microscope).
RNA induced gene silencing of GPR15
For downregulation of GPR15 in human T cells the Amaxa Human T cell Nucleofector Kit was used, according to the manufacturer’s instructions. 1×10⁶ to 5×10⁶ cells were treated with either 300 ng siRNA for GPR15 (Qiagen) or AllStar negative control (Qiagen). In addition, transfection with a GFP vector was used as transfection control. Cells were incubated for at least 4 h. Downregulation of GPR15 was analysed by real-time PCR (forward primer: TCTCATGGGAGCGTTGCATTT, reverse primer: CCACAGTCCTAGAGATGCTTCT) and flow cytometry.
Animals
The NSG (NOD.Cg-Prkdcscid Il2rgtm1Wjl/SzJ) mouse strain that lacks murine T cells, B cells and NK cells has been described in detail elsewhere.37 Mice used in the experimental dextran sodium sulfate (DSS) colitis model were between 7 weeks and 12 weeks of age. DSS colitis was induced as previously described38 using 1.5% DSS (MP Biomedicals) in the drinking water over 1 week. All animals were housed under specific pathogen-free conditions. Experiments were performed with permission of the government of Middle Franconia in accordance with institutional guidelines.
Adoptive transfer of human cells and in vivo confocal microscopy
For adoptive transfer human cells were labelled with CFSE according to the manufacturer’s instructions (Life Technologies). Mice were anaesthetised by intraperitoneal injection of ketamine/xylazine. Texas Red dextran (Life Technologies) was injected into the tail vein to stain blood vessel structures. For cell transfer the colon was prepared upon median laparotomy. The ileocolic artery was identified and 1 million human T cells or PBMCs were given by intra-arterial injection. In some experiments, Hoechst dye was injected intravenously before cell transfer to stain mouse cell nuclei and Texas Red dextran was administered into the ileocolic artery together with the cells. Additionally, some mice were given 6 µg Alexa Fluor 647-conjugated anti-CD31 antibody (390, Biolegend) by tail vein injection 18 h before adoptive transfer of cells.
The colon was exteriorised and the colonic mucosa was positioned on a glass transparent petri dish. Images of the colon were taken after the adoptive transfer with a confocal microscope (SPM 8 or SPM 5 Leica). For detection 405 nm (Hoechst), 488 nm (CFSE), 595 nm (Texas Red dextran) and 638 nm Laser (Alexa Fluor 647) were used. In some experiments, 1 mg vedolizumab was injected into the tail vein 18 h before adoptive transfer and additionally human T cells were incubated with 100 µg/mL vedolizumab for 2 h before adoptive transfer.
Maestro in vivo imaging
To monitor cell trafficking, human T cells were stained with Q Tracker 800 Cell Labeling Kit (Life Technologies) according to the manufacturer’s instructions. Cells were injected into the tail vein of NSG mice and images were acquired after 18 h (Maestro in vivo imaging system, Perkin Elmer).
Isolation and analysis of lamina propria mononuclear cells from NSG mice
T cell enriched lamina propria mononuclear cells (LPMCs) were isolated from the colon of mice with the help of the lamina propria dissociation kit (Miltenyi Biotec) according to the manufacturer’s guidelines.34 Mononuclear cells were separated from epithelial cells using Percoll gradient (Biochrom). Cells were counted, washed and stained for FACS analysis as described in the results. Upon human T cell transfer, we usually detected 100–1000 CFSE+ cells in the murine lamina propria by FACS.
Immunohistochemistry of murine colonic tissue
Staining of murine cryosections was performed with primary antibodies against MAdCAM-1 (MECA367, Bio-Rad company) and CD31 (polyclonal, Abcam). Tissues were fixed in 4% paraformaldehyde, followed by treatment with protein-blocking reagent (Roth) to suppress unspecific background staining. Furthermore, some sections were incubated without primary antibodies as negative controls. Subsequently, samples were incubated with secondary antibodies which were directly labelled with fluorochromes (Vectorlabs). Nuclei were counterstained with Hoechst dye (molecular probes) before final analysis by confocal microscopy (Leica SP8 Microscope).
Statistics
Statistical differences between groups in human samples were determined by using ANOVA. Where necessary, correction for multiple testing by the Bonferroni method was applied. For murine data the Student’s t test was used. p Values <0.05 were considered statistically significant and identified with asterisks (*<0.05, **<0.01, ***<0.001). Results are expressed as mean values. The error bars in histogram figures represent SEM.
Results
GPR15 and α4β7 expression on FoxP3+ Treg cells is induced in patients with UC
Although functionally active FoxP3+ Treg cells have been demonstrated in the peripheral blood and the mucosa of patients with UC,29 ,30 ,39 their expression pattern of homing markers has not been previously studied in detail. To address this question, we analysed expression of the integrin α4β7 that has been previously shown to control gut homing of T cells via its interaction with MAdCAM-1.23 ,40 Accordingly, we performed quantitative FACS analysis of α4β7 integrin expression and mean fluorescence intensity on FoxP3+ CD4+ regulatory T cells from peripheral blood of patients with UC and CD and healthy controls (n=106) and compared the results with those of FoxP3− CD4+ Teff cells (figure 1A). In patients with IBD, expression of α4β7 was more frequently detected on Treg cells compared with Teff cells. Furthermore, there was a significant induction of α4β7 integrin expression and mean fluorescence intensity on Treg cells in active UC as compared with controls, while a significant reduction of α4β7 integrin levels was noted on CD and UC Teff cells (figure 1A).


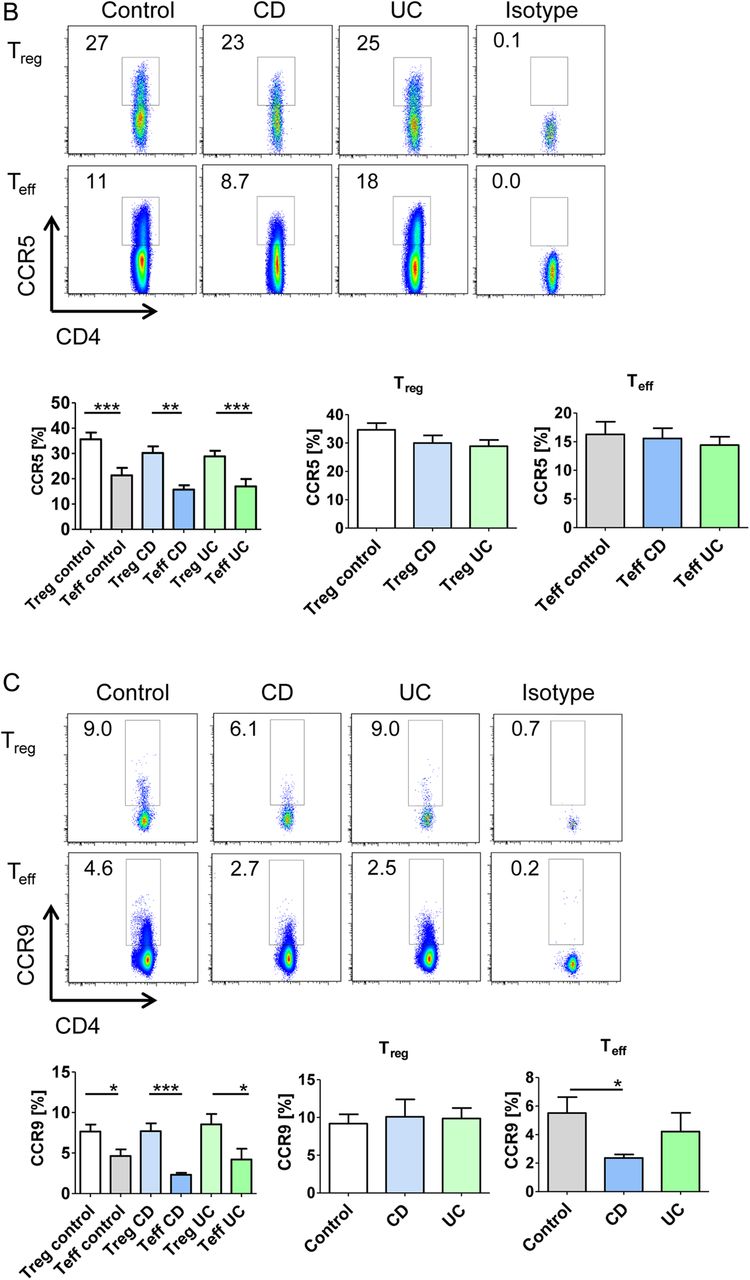
The expression of α4β7 integrins and GPR15 is upregulated on regulatory FoxP3+ T cells in UC. (A) Upper panels: Representative FACS analysis of α4β7 integrin expression on FoxP3− CD4+ effector T (Teff) cells and FoxP3+ CD4+ regulatory T cells (Treg) from peripheral blood in patients with UC as compared with patients with Crohn’s disease (CD) and controls. Isotype control staining is shown additionally (right panels). The percentage of α4β7 integrin expressing cells is indicated. Lower right panels: Quantitative FACS analysis of β7 integrin mean fluorescence intensity (MFI) on FoxP3− CD4+ α4+ Teff cells and FoxP3+ CD4+ α4+ regulatory T cells from peripheral blood. Samples from patients with UC (n=20), patients with CD (n=36) and controls (n=50) were used for analyses. Data represent findings from 106 patients and statistically significant differences are indicated (*p<0.05; **p<0.01; ***p<0.001). Lower left panels: Exemplary gating strategy used for FACS analysis of β7 integrin MFI. (B–D) FACS analyses of CCR5 (B), CCR9 (C) and GPR15 (D) expression on FoxP3− CD4+ Teff cells and FoxP3+ CD4+ regulatory T cells from peripheral blood. Samples from patients with UC, CD and controls were used for analyses. The percentage of positive cells is shown. Significant differences are indicated. (E) FACS analyses of FoxP3− CD4+ Teff cells and FoxP3+ CD4+ regulatory T cells from peripheral blood expressing two or three adhesion molecules. Samples from patients with UC (n=7), patients with CD (n=10) and controls (n=17) were used for analyses. Statistically significant differences are indicated.
Next, we addressed the expression of additional homing receptors such as CCR5 and CCR9 that have been previously demonstrated to be expressed on T cells in IBD.41 ,42 In patients with CD, patients with UC and controls, it was found that significantly more Treg cells expressed CCR5 than Teff cells (figure 1B). However, no significant differences in CCR5 expression on Treg cells were noted between patients with UC, patients with CD and controls. Similarly to CCR5, CCR9 expression was more frequently detected on Treg cells than Teff cells (figure 1C). No significant differences in CCR9 levels on Treg cells were observed between UC and control groups. Finally, we addressed the expression of GPR15, a recently described homing receptor for the murine colon,33 on human Treg cells. We detected a higher percentage of GPR15+ Treg cells as compared with GPR15+ Teff cells in patients with CD, patients with UC and controls (figure 1D). Interestingly, a significant induction of GPR15 expression was seen on Treg cells in patients with UC and patients with CD as compared with controls, although the highest levels of GPR15 on Treg cells were noted in UC.
In subsequent experiments, we addressed the question whether specific combinations of the homing receptors α4β7 integrin, CCR9 and GPR15 are expressed on the surface of Treg cells in patients with IBD and controls. Small subgroups of Treg and Teff cells expressing combinations of two or three homing receptors were noted. A significant induction of α4β7+/GPR15+ Treg and α4β7+/GPR15+/CCR9+ Teff cells was observed in patients with UC as compared with controls, whereas no significant differences were detected between patients with CD and controls (figure 1E). In contrast, significantly fewer Teff cells expressing α4β7 integrin plus CCR9 were detected in patients with UC as compared with controls.
In summary, these findings suggested relatively high expression of gut homing receptors on Treg cells in UC, although most UC Treg cells expressed only one of the key homing receptors α4β7, CCR9 and GPR15. In particular, Treg cells in UC expressed more frequently α4β7 integrins and the colon homing receptor GPR15 than Treg cells from controls consistent with the idea that homing of Treg cells via these receptors might be augmented in UC.
Expression of GPR15 and α4β7 in the inflamed gut in IBD and regulation of their expression on regulatory FoxP3+ T cells
As these findings were consistent with the idea that GPR15 and α4β7 control homing of Treg cells to the inflamed gut in UC, we next determined the presence of mucosal T cells bearing these surface receptors by immunohistochemistry. We observed that many α4β7 expressing T cells are present in the inflamed tissue in patients with CD and patients with UC and the number of these cells was significantly increased in patients with IBD as compared with controls (figure 2A). As the number of CD4+ T cells negative for α4β7 was only slightly and not significantly higher in UC and CD, this raised the possibility that α4β7 is a marker for the excess CD4+ cellular colonic infiltrate in IBD. Furthermore, GPR15 was mainly expressed on mucosal CD4+ T cells rather than CD8+ T cells in patients with IBD and controls (figure 2B–D). A significant induction of GPR15 expressing FoxP3− Teff cells was detected in patients with CD and patients with UC as compared with controls consistent with the idea that this receptor may control homing of these cells to the colon. Moreover, only very few GPR15+/FoxP3+ expressing cells were observed in patients with CD and controls (figure 2C). Similarly, in spite of the higher percentage of GPR15 expressing blood Treg cells in UC, very few or no GPR15+ FoxP3+ T cells were noted in this disease suggesting that either homing of Treg cells is independent of GPR15 or that GPR15 expression is rapidly lost upon gut homing of these cells.


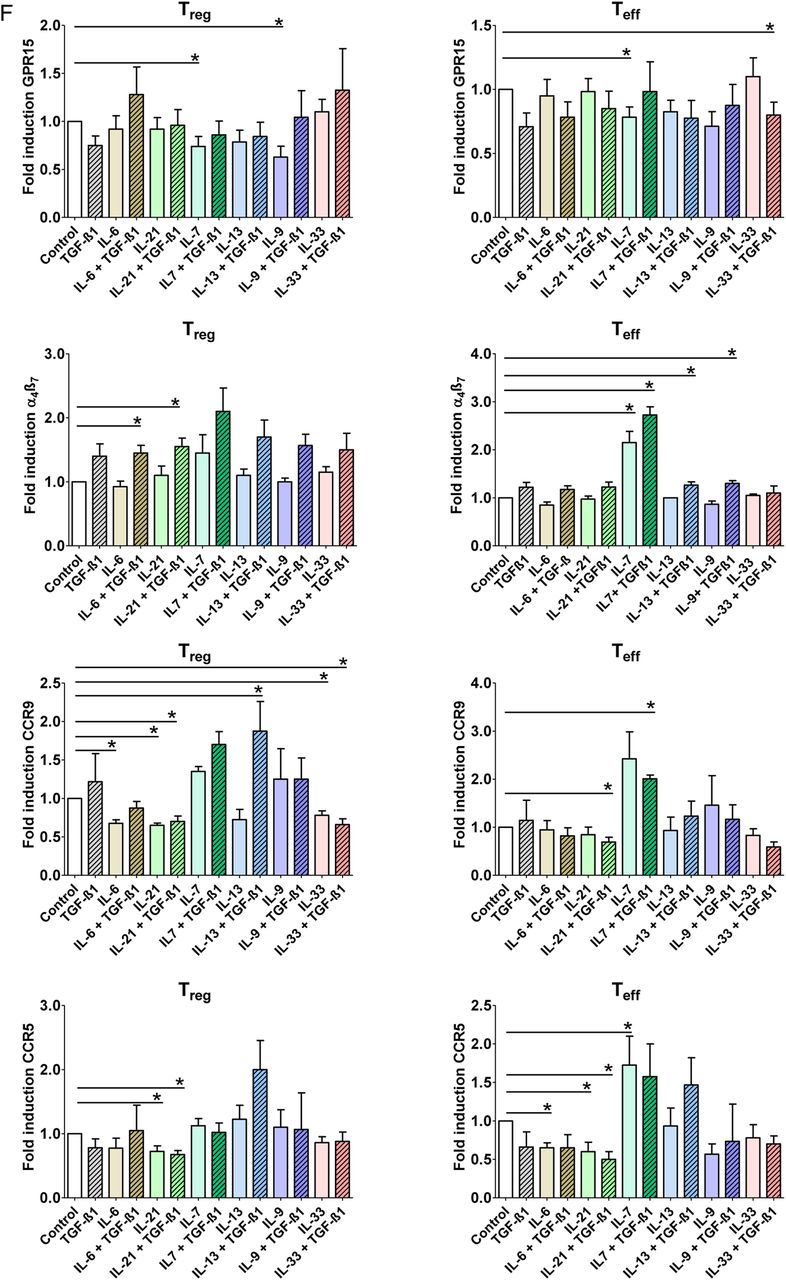
Lamina propria CD4+ effector T (Teff) cells but not mucosal regulatory T (Treg) cells express GPR15 in patients with UC. (A) Cryosections of colonic specimens were incubated with α4ß7 integrin and CD4+ antibodies followed by detection with secondary antibodies. Nuclei were counterstained with Hoechst dye. The number of double (arrows) and single positive cells per high power field was counted. Data represent mean values±SEM per high power field. Double staining analysis for CD4 and α4ß7 integrin showed a significant increase of double positive cells in patients with IBD as compared with controls. Data represent results of four independent experiments (n=18). (B) Cryosections of colonic specimens were incubated with GPR15 and CD4+ antibodies followed by detection with secondary antibodies. Cells were counterstained with Hoechst dye. The number of double (arrows) and single positive cells per high power field was counted. Data represent mean values±SEM per high power field. Double staining analysis for CD4 and GPR15 showed a significant increase of double positive cells in patients with IBD as compared with controls. Data represent results of three independent experiments (n=13). (C) Double staining analysis of FoxP3 and GPR15 in patients with IBD and controls (n=19). Cryosections were incubated with FoxP3 and CD4 antibodies followed by counterstaining with Hoechst dye. Representative stainings are shown. Data represent results of three independent experiments. Double positive cells were counted per high power field and significant differences are indicated. FoxP3 expressing cells are highlighted by arrows. There was a significant increase of mucosal GPR15+ FoxP3− Teff cells in IBD, while little or no GPR15+ FoxP3+ mucosal Treg cells were found. (D) Double staining analysis of GPR15 and CD8 in patients with IBD and controls (n=12). Cryosections were incubated with GPR15 and CD8 antibodies followed by counterstaining with Hoechst dye. Representative stainings are shown. Data represent results of three independent experiments. Double positive cells were counted per high power field and significant differences are indicated. There were only few GPR15+ mucosal CD8+ T cells in patients with IBD and controls. (E) Regulation of GPR15 expression by microbial metabolites. CD4+ FoxP3+ Treg cells and CD4+ FoxP3− Teff cells were co-incubated with different concentrations of butyric acid, isobutyric acid, formic acid and propionic acid for 3 days, as indicated. Subsequently, FACS analysis for expression of α4β7 and GPR15 was done. Data represent four to eight independent experiments and statistically significant differences are indicated. (F) Regulation of α4β7 and GPR15 expression by proinflammatory and anti-inflammatory cytokines. CD4+ FoxP3+ Treg cells and CD4+ FoxP3− Teff cells were co-incubated with various regulatory recombinant cytokines for 3 days, as indicated. Subsequently, FACS analysis for expression of α4β7 and GPR15 was done. Data represent three to seven independent experiments per group. Statistical analysis included correction for multiple testing by the Bonferroni method and statistically significant differences are indicated (*p<0.05; **p<0.01; ***p<0.001).
To gain further insights into the signalling mechanisms controlling GPR15 expression, we co-incubated Treg cells with various bacterial metabolites and regulatory cytokines (figure 2E). Whereas isobutyric acid and propionic acid had no significant effects on GPR15 expression in FoxP3+ Treg cells, butyric acid led to a significant induction of GPR15 levels. In contrast, such effect of butyric acid was not observed on FoxP3− Teff cells suggesting that this microbe-derived short-chain fatty acid specifically controls GPR15 levels in Treg cells. In contrast to butyric acid, formic acid, a metabolite formed by microorganisms in the colon during initial dietary fermentation,43 significantly suppressed GPR15 expression on Treg cells.
Next, we looked at the effects of proinflammatory and anti-inflammatory cytokines on GPR15 expression. We observed that the proinflammatory cytokine IL-7, that is present in the inflamed mucosa in UC34 ,31 ,44 ,45 results in suppression of GPR15 expression on Treg and Teff cells, while IL-9 suppressed GPR15 only on Treg cells (figure 2F). In contrast to GPR15, the integrin α4β7 was induced on Treg cells by the proinflammatory cytokines IL-6 and IL-21 in the presence of TGF-β1. However, IL-7 and IL-7 plus TGF-β1 resulted in marked induction of α4β7 on Teff cells. Taken together, these findings suggested that several proinflammatory cytokines present in the inflamed UC mucosa specifically suppress the expression of GPR15 on Treg cells, while proinflammatory cytokines may induce α4β7 expression on these cells in the presence of TGF-β1.
A new humanised mouse model for in vivo analysis of T cell homing to the inflamed gut
The above data were consistent with the idea that the gut homing receptors α4β7 and GPR15 that were increasingly expressed on blood UC Treg cells play a functional role in driving this disease by controlling mucosal influx of immune cells. However, there are no satisfying systems to determine homing of human Treg cells to the inflamed gut under in vivo circumstances and thus to analyse the functional relevance of human homing receptors in UC Treg cells. In order to develop a model for assessment of in vivo homing, we decided to consider a humanised mouse system based on the NSG (NOD.Cg-Prkdcscid-Il2rgtm1Wjl/SzJ) mouse strain that lacks murine T cells, B cells and NK cells.37 Before T cell transfer NSG mice were treated with DSS for 1 week in drinking water to induce colonic inflammation according to established protocols.38
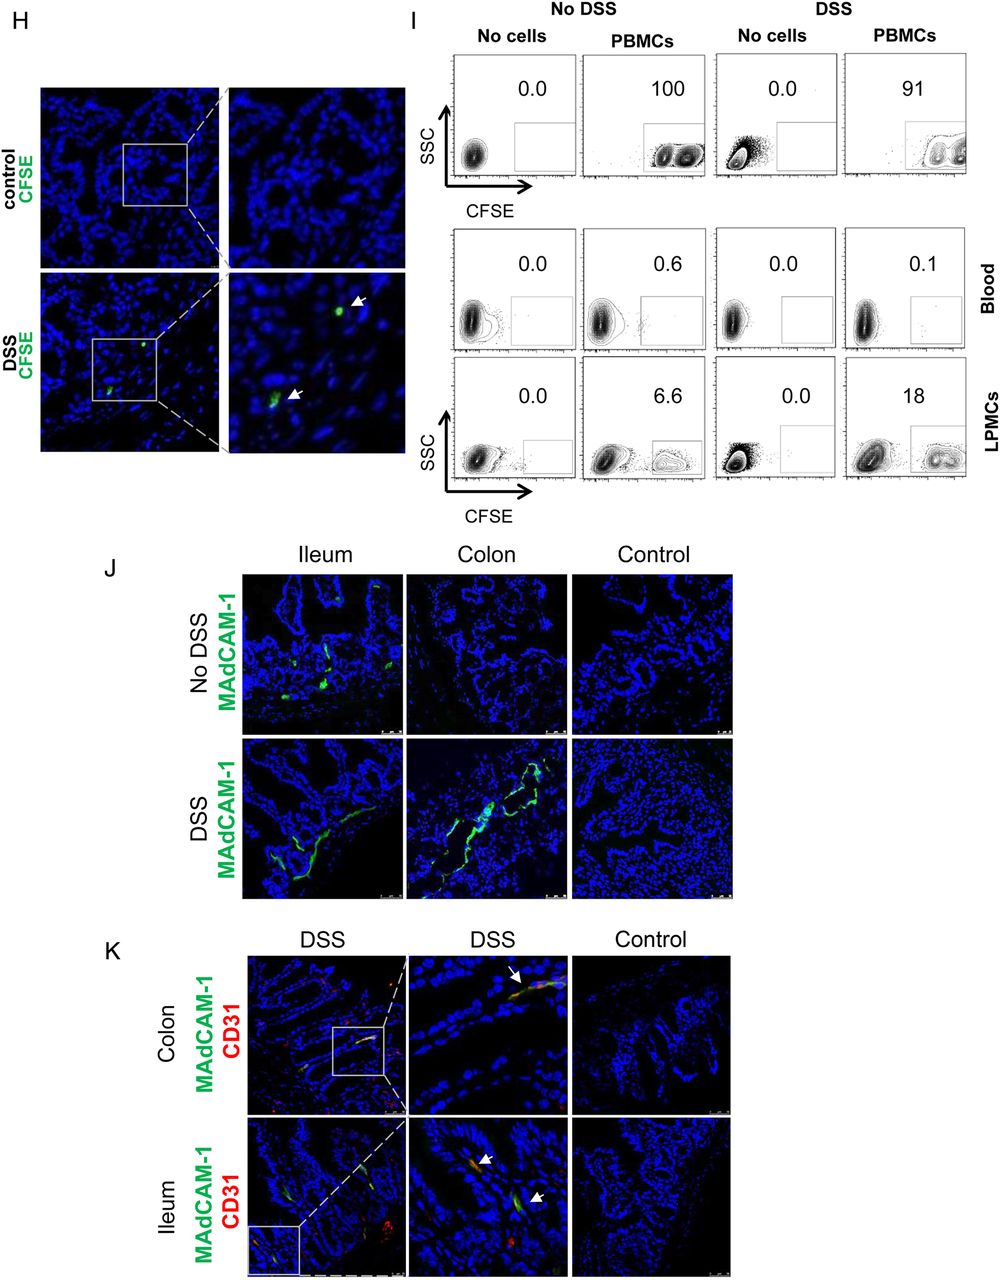
Initial studies on the in vivo homing of adoptively transferred, CFSE-labelled human cells in NSG mice showed that intravenous delivery (tail vain or retro-orbital injection) of T cells or PBMCs is not suitable for assessment of gut homing, as more than 90% of the transferred human cells were retained in the capillaries of the lung (figure 3A, B) probably due to the larger size of human T cells (10–15 μm) as compared with mouse T cells (7–8 μm). We therefore focused in subsequent studies on the adoptive transfer of T cells from controls via the ileocolic artery (figure 3C). Accordingly, CFSE-labelled cells were injected locally into the ileocolic artery followed by assessment of T cell homing to the colon. In vivo confocal microscopy of the murine colon with simultaneous vessel imaging using Texas Red dextran showed homing of CFSE-labelled human PBMCs and CD4+ T cells from controls and patients with UC to the inflamed gut (figure 3D). Migration and entering of labelled cells into the mucosa could be detected 10–20 min after injection. Furthermore, intravenous injection of Hoechst dye prior to adoptive cell transfer resulted in fluorescent staining of the mouse cell nuclei and confocal microscopy demonstrated CFSE+ human cells from controls and patients with UC that had migrated from the vessels to the gut mucosa (figure 3E). Consistently, we were able to show homing after in vivo staining of the mouse endothelium by intravenous injection of a fluorescent-labelled anti-CD31 antibody instead of vessel staining with Texas Red dextran (figure 3F). By taking sequential images, the migratory movement of homing cells could be illustrated (figure 3G, online video). Finally, homing of labelled cells to the mucosa could be confirmed by immunofluorescence analysis of labelled T cells by using ex vivo staining analysis of gut cryosections (figure 3H). Taken together, these observations suggested that the T cell transfer model in NSG mice is suitable for analysis of gut homing in vivo.
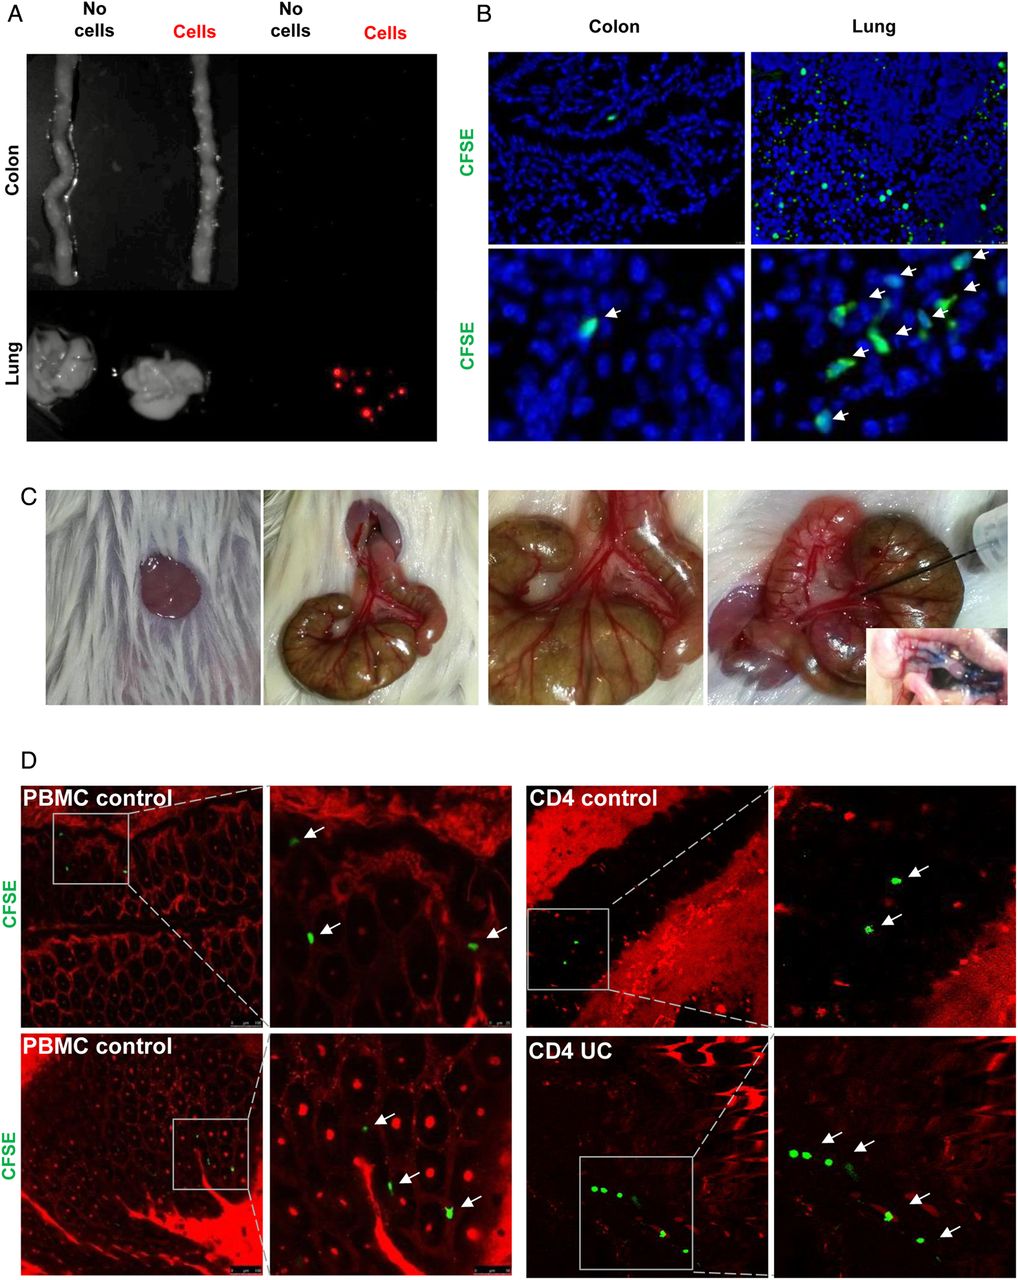


A humanised mouse model for analysis of human T cell homing to the inflamed gut in vivo. (A) Analysis of cell trafficking upon intravenous transfer of human T cells into immunodeficient NSG mice. Imaging of murine colon and lungs was performed 18 h after human T cell transfer by Maestro imaging. Organs from NSG mice without human T cell transfer served as controls. (B) Representative immunofluorescence of murine colon and lungs after human T cell transfer in NSG mice. CFSE positive human T cells are highlighted by arrows. (C) Preparation of the ileocolic artery for adoptive human cell transfer upon mini laparotomy (left panel). The ileocolic artery was prepared followed by ink injection (right panel, insert) to demonstrate successful puncture. One representative experiment is shown. (D) Confocal in vivo microscopy 20 min after injection of human peripheral blood mononuclear cells (PBMCs) or human CD4+ T cells from controls or patients with UC into the ileocolic artery in dextran sodium sulfate (DSS)-treated NSG mice. Vessels were stained by Texas Red dextran. In vivo homing of CFSE-labelled human cells (arrows) to the mucosa could be demonstrated. (E) Confocal in vivo microscopy after intravenous injection of Hoechst dye and injection of PBMCs or T cells together with Texas Red dextran into the ileocolic artery. In vivo homing of CFSE-labelled human cells (arrows) to the mucosa could be demonstrated. Blue—murine cells, green—human cells, red—blood vessels. (F) Confocal in vivo microscopy after intravenous injection of Hoechst dye and adoptive transfer of CFSE-labelled human PBMCs via the ileocolic artery 18 h after intravenous injection of Alexa Fluor 647-labelled anti-mouse CD31 for staining of endothelial cells (red colour). In vivo homing of human cells (arrows) to the mucosa could be demonstrated. (G) Sequential images taken by in vivo confocal microscopy after injection of CFSE-labelled human PBMCs and Texas Red dextran into the ileocolic artery and prior intravenous injection of Hoechst dye. The migratory movement of a homing cell from a vessel (yellow cell) to the mucosa (green mucosal cell) can be seen (online video available). Blue—murine cells, red—blood vessels. (H) Immunofluorescence analysis of colonic samples from DSS-treated NSG mice upon transfer of CFSE-labelled human CD4+ T cells. Homing of human T cells to the inflamed mucosa could be seen 30 min after cell transfer. Untreated mice served as negative control. (I) Upper panels: FACS analysis of lamina propria cells in DSS-treated or untreated NSG mice before cell transfer and FACS analysis of labelled human PBMCs before cell transfer. Lower panels: Representative FACS analysis of lamina propria mononuclear cells (LPMCs) and blood cells from NSG mice given human PBMCs in the presence or absence of DSS treatment. NSG mice without human cell transfer served as negative control. One representative out of three experiments is shown. DSS treatment led to marked induction of homing of human cells to the inflamed gut. (J) Analysis of expression of the α4β7 ligand MAdCAM-1 in the colon of NSG mice in the presence or absence of DSS treatment. Nuclei were counterstained with Hoechst dye. DSS treatment resulted in upregulation of MAdCAM-1 expression in the colon. One representative out of three experiments is shown. (K) Double staining analysis of MAdCAM-1 and CD31 in the colon and small intestine of NSG mice in the presence or absence of DSS treatment. Colitis development caused an upregulation of MAdCAM-1 expression on endothelial cells (yellow; arrows).
To determine the relevance of mucosal inflammation for human cell homing in NSG mice, we performed additional experiments in the presence or absence of DSS treatment. As shown in figure 3I, homing of PBMCs to the gut was markedly dependent on the presence of mucosal inflammation and more cells entered into the mucosa in the presence of DSS treatment as compared with uninflamed tissue. As it is likely that these differences were due to changes in the expression of ligands for homing receptors on endothelial cells, we next determined expression of the α4β7 ligand MAdCAM-1 in NSG mice. We observed that DSS treatment led to marked upregulation of colonic MAdCAM-1 expression as compared with untreated NSG mice (figure 3J). Moreover, double staining analysis revealed that CD31 expressing colonic endothelial cells express MAdCAM-1 (figure 3K) consistent with the idea that augmented T cell homing to the colon during inflammation is mediated by increased binding of T cell receptors to their ligands on endothelial cells.
In vivo homing to the inflamed gut is augmented in regulatory T cells from patients with UC as compared with controls
We next addressed the question whether increased expression of homing receptors on Treg cells in patients with UC is associated with changes in their homing capacities to the inflamed gut in vivo. In initial experiments, we aimed at characterising the CD4+CD25+ Treg enriched population we used for adoptive transfer experiments (see online supplementary figure S1). By using the human CD4+CD25+ isolation kit, high levels of FoxP3 and low levels of CD127+ T cells could be demonstrated. Similarly, Treg enriched populations isolated with a kit based on the markers CD4+CD25+CD127dim/- showed low levels of CD127+ T cells. The Treg enriched populations obtained via the CD4+CD25+ and the CD4+CD25+CD127dim/- kits did not differ in the expression of the additional Treg markers CTLA-4 and GITR suggesting that both kits are suitable for enrichment of human Treg cells from peripheral blood.
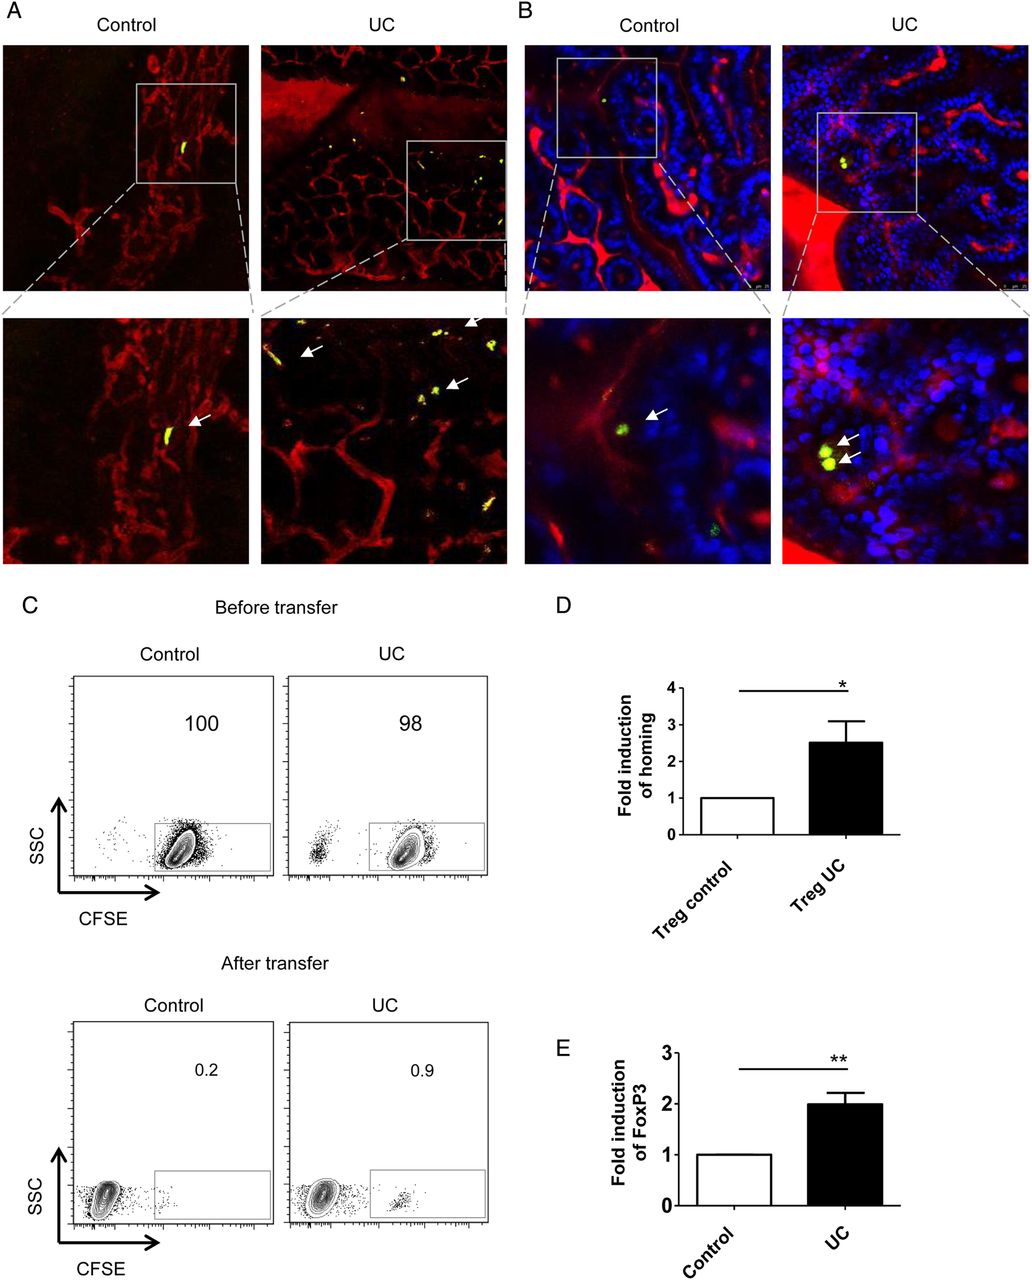
In subsequent studies, we analysed the homing capacities of Treg enriched cells in vivo. Accordingly, we injected purified CFSE+ Treg enriched CD4+CD25+ or CD4+CD25+CD127dim/- T cells from patients with UC and controls into DSS-treated NSG mice and monitored migration of T cells to the inflamed colon. In vivo confocal imaging revealed augmented homing of Treg enriched cells from patients with UC as compared with controls (figure 4A, B). Consistently, FACS analysis of isolated lamina propria mononuclear cells showed a marked increase in homing of Treg enriched CFSE+ UC cells as compared with CFSE+ cells from controls (figure 4C). Quantitative analysis demonstrated significant induction of gut homing in Treg enriched CFSE+ CD4+ CD25+ T cells in UC as compared with controls (figure 4D). Further analysis of FoxP3 expression on mucosal CFSE+ UC cells showed an upregulation in the percentage of lamina propria cells expressing the transcription factor FoxP3 as compared with CFSE+ cells from controls (figure 4E) suggesting that regulatory T cells from patients with UC expressing FoxP3 are enriched during migration into the mucosa of NSG mice. These findings suggested that Treg cells in UC display augmented expression of gut homing markers associated with increased gut homing capacities as compared with Treg cells from controls.

Augmented homing of regulatory T (Treg) cells in UC. (A and B) In vivo confocal microscopy for analysis of homing of human CD4+CD25+ Treg cells (A) and CD4+CD25+CD127dim/- Treg cells (B) to the inflamed murine colon in NSG mice. NSG mice were treated with dextran sodium sulfate (DSS) for 7 days to induce colitis followed by Treg cell transfer. The transfer of Treg enriched cells from patients with UC led to augmented numbers of cells reaching the inflamed mucosa as compared with controls (arrows). In panel A one representative experiment out of five is shown. Blue—murine cells, green—CFSE+ human cells, red—vessels. (C) Upper panels: FACS analysis of CFSE-labelled human CD4+CD25+ T cells from controls and patients with UC before T cell transfer in DSS-treated NSG mice. Lower panels: FACS analysis of isolated lamina propria mononuclear cells (LPMCs) from DSS-treated NSG mice after T cell transfer. Treg enriched cells were isolated from peripheral blood of patients with UC and controls followed by adoptive transfer in NSG mice. Homing of UC Treg cells was augmented as compared with homing of Treg cells from controls. One representative experiment out of five is shown. (D) Analysis of homing of CFSE-labelled Treg cell enriched CD4+CD25+ T cells from controls and patients with UC in DSS-treated NSG mice. The fold-increase of UC T cell homing in relation to control T cell homing to the mucosa of DSS-treated NSG mice is shown. Data represent findings from five independent experiments. Significant differences are indicated (*p<0.05). (E) Quantitative analysis of FoxP3 expression on CFSE-positive LPMCs from NSG mice by FACS analysis. The fold-increase of UC FoxP3+ Treg cell homing in relation to control FoxP3+ Treg cell homing to the mucosa of DSS-treated NSG mice is shown. Data represent findings from five independent experiments. Statistically significant differences are indicated (**p<0.01).
Vedolizumab treatment suppresses homing of regulatory T cells from patients with UC but not controls to the inflamed gut in vivo
Although the α4β7 blocking antibody vedolizumab has recently been used for the successful treatment of patients with UC,23 little is known about the effects of this antibody on human Treg and Teff cell homing to the gut in vivo. We therefore aimed to analyse the in vivo effects of vedolizumab on homing of T cells to the inflamed colon. Accordingly, we studied first, whether vedolizumab directly affects proliferation, apoptosis or necrosis of CD4+ T cells. As shown in figure 5A–C, vedolizumab had no direct effects on proliferation of T cells from controls and patients with UC. Moreover, no effects on apoptosis and necrosis of cells were noted. Finally, no differences between T cells from patients with UC and controls were observed upon vedolizumab treatment. We next determined the capacity of this antibody to block adhesion of CD4+ T cells in vitro using MAdCAM-1 coated plates. These studies showed that vedolizumab significantly suppressed adhesion of human CD4+ T cells from patients with UC and controls to MAdCAM-1 (figure 5D). Surprisingly, CD4+ T cells from controls displayed a greater affinity to MAdCAM-1 than cells from patients with UC. We therefore repeated these adhesion assays comparing CD4+CD25+ Treg enriched cells and CD4+CD25− Teff cells from controls and patients with UC. It was found that adhesion of Teff cells to MAdCAM-1 was higher in controls than in patients with UC (figure 5E), but vice versa for Treg cells (figure 5F). This is line with the flow cytometry data on α4β7 expression on both cell types presented in figure 1. Additionally, we used the adhesion assay technique to confirm that the previously demonstrated homology of integrin binding domains of human and murine MAdCAM-146 results in a cross-species interaction of human CD4+ T cells and murine MAdCAM-1 and VCAM-1, a less important ligand of α4β7.47 As expected, adhesion of human CD4+ T cells to the murine ligands was lower as compared with the human ligands, but with about 80% for murine MAdCAM-1 and about 70% for murine VCAM-1 the relative adherence was still on very high levels (figure 5G).
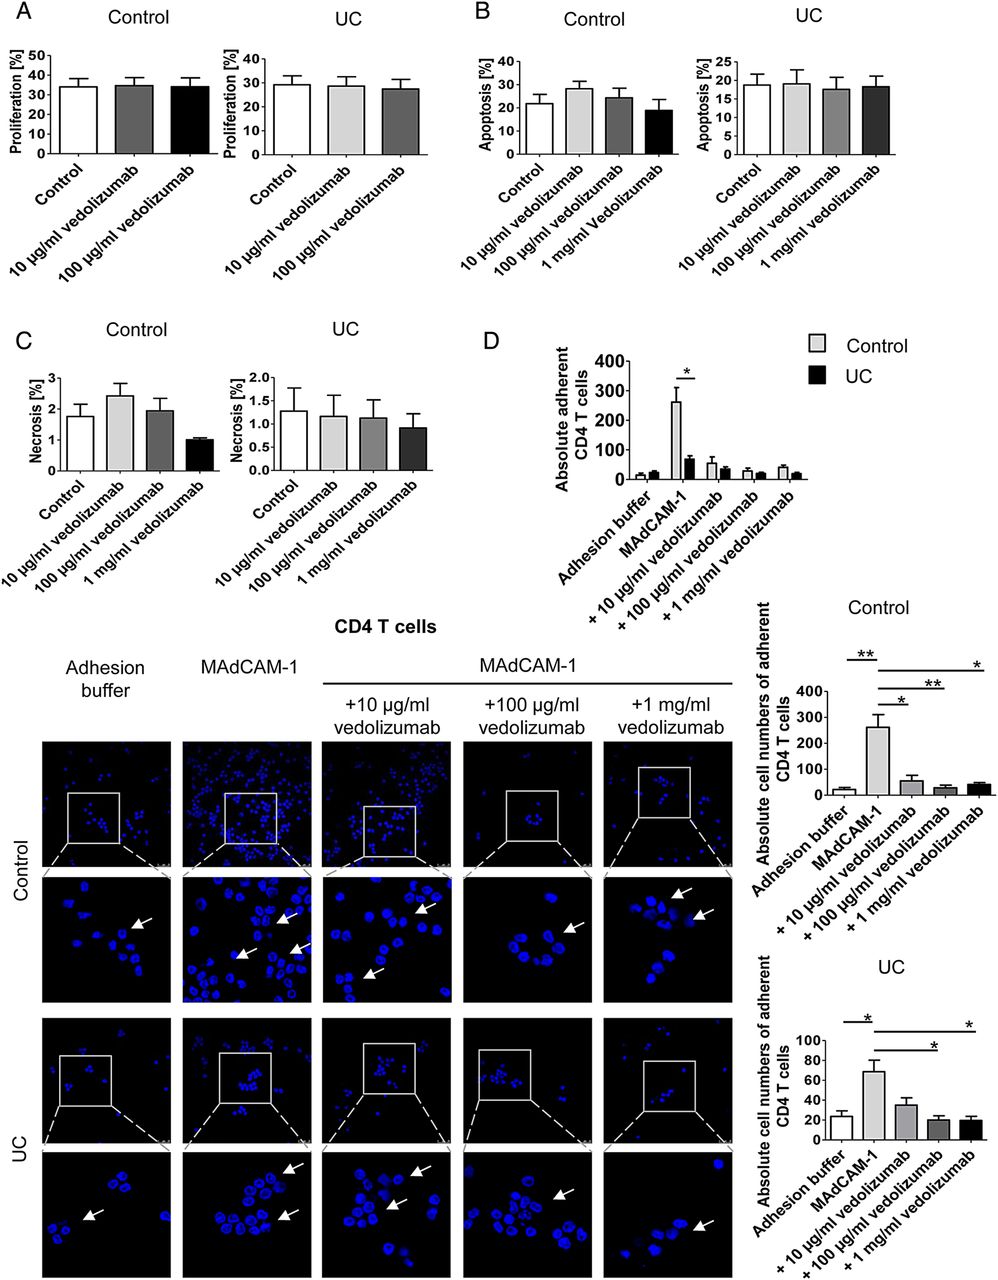

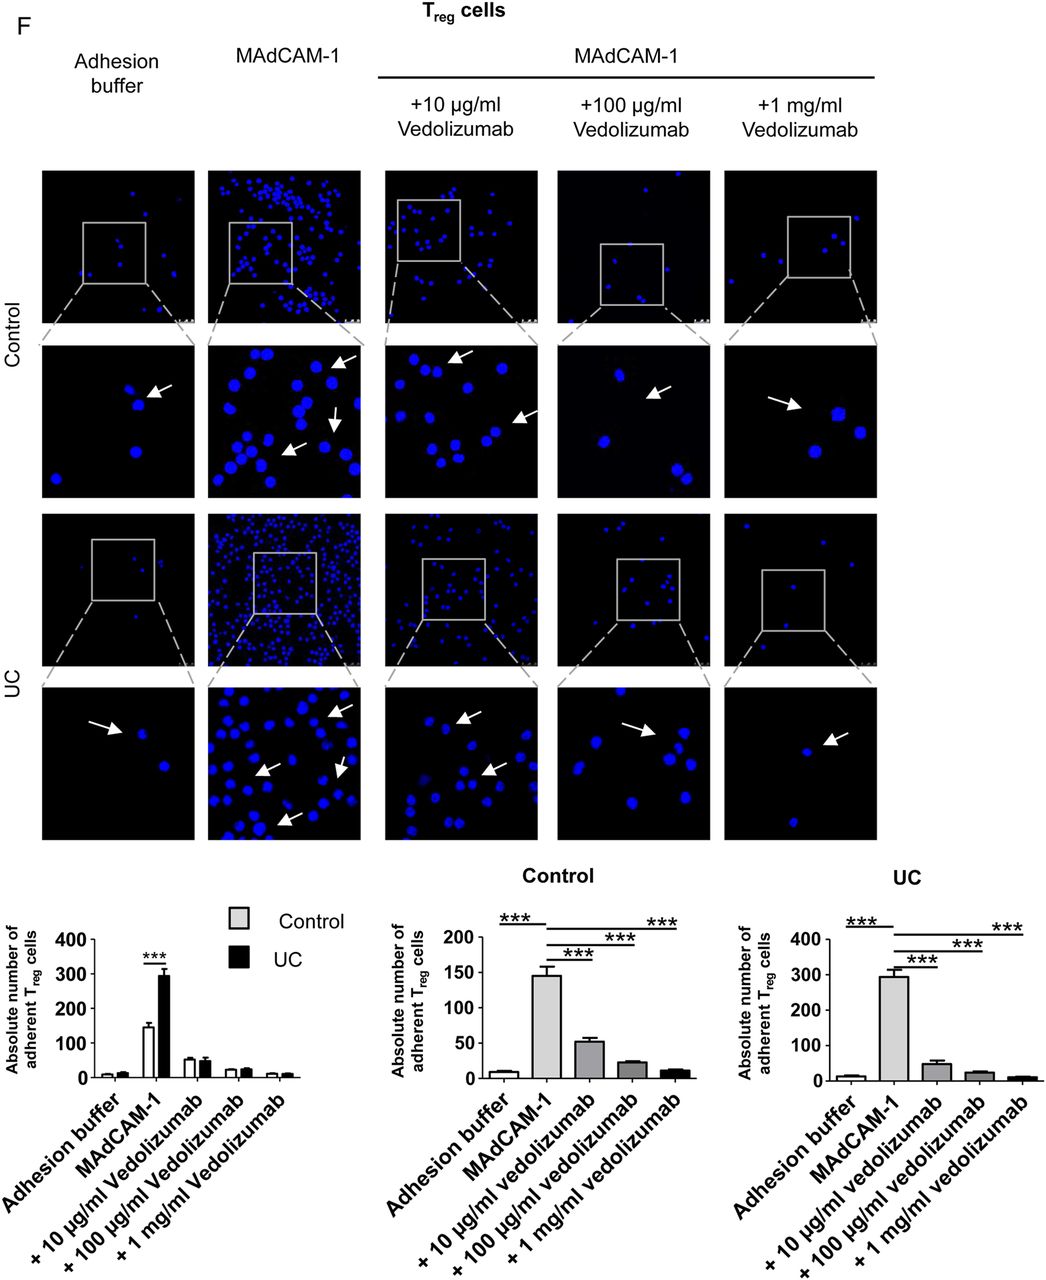

The α4β7 neutralising antibody vedolizumab suppresses binding of human CD4+ T cells from patients with UC to MAdCAM-1. (A) Proliferation of purified blood human CD4+ T cells from controls or patients with UC in the presence or absence of vedolizumab after 3 days. Proliferation was determined by FACS analysis of cell tracer violet. The data represent results of three to four samples per group. (B and C) Analysis of apoptosis and necrosis in purified blood human CD4+ T cells in the presence or absence of vedolizumab after 3 days. The percentage of apoptotic annexin V+/PI- cells and necrotic annexin V+/PI+ cells was determined by FACS analysis. The data represent results of three independent experiments. (D – F) Analysis of cell adhesion to MAdCAM-1 in purified blood human CD4+ T cells (D), CD4+CD25− Teff cells (E) and Treg enriched CD4+CD25+ cells (F) from patients with UC or controls in the presence or absence of vedolizumab. Glass slides were incubated with recombinant human MAdCAM-1 followed by addition of T cells and washing. Vedolizumab led to a significant suppression of human T cell binding to MAdCAM-1 in controls and patients with UC. While adhesion of Teff cells was higher in controls, Treg adhesion was augmented in UC. Some adherent cells are highlighted by arrows. Data are representative of three to five independent experiments. Statistically significant differences are indicated. (G) Comparison of human CD4+ T cell adhesion to slides coated with human and murine MAdCAM-1 as well as VCAM-1, respectively. Human T cells showed a high level of adherence towards the murine ligands. Data are representative of three independent experiments. Statistically significant differences are indicated.
Next, we determined the capacity of vedolizumab to modulate homing of CD4+CD25− Teff cells to the inflamed gut in vivo. Accordingly, we treated NSG mice and human Teff cells with vedolizumab before T cell transfer. We found that vedolizumab treatment had no significant effect on T cell homing when Teff cells from controls were used. In contrast, vedolizumab inhibited the homing of Teff cells from patients with UC, as determined by in vivo confocal microscopy (figure 6A). Similarly, FACS analyses showed significant inhibition of homing of Teff cells from patients with UC but not controls to the inflamed colon upon vedolizumab treatment (figure 6B, C) indicating that this treatment markedly affects homing of UC Teff cells in vivo. To assess the impact of GPR15 for colonic homing of Teff cells, we suppressed GPR15 expression on UC Teff cells by transfection with siRNA. As can be seen in figure 6D, E, this knockdown was effective on mRNA and protein levels. In vivo confocal microscopy and quantitative FACS analysis after adoptive transfer of accordingly treated Teff cells showed a significant reduction of homing of these cells to the inflamed gut (figure 6F, G). This finding could be confirmed by adoptive transfer of GPR15+ and GPR15− Teff cells that had been purified by FACS sorting (figure 6H).
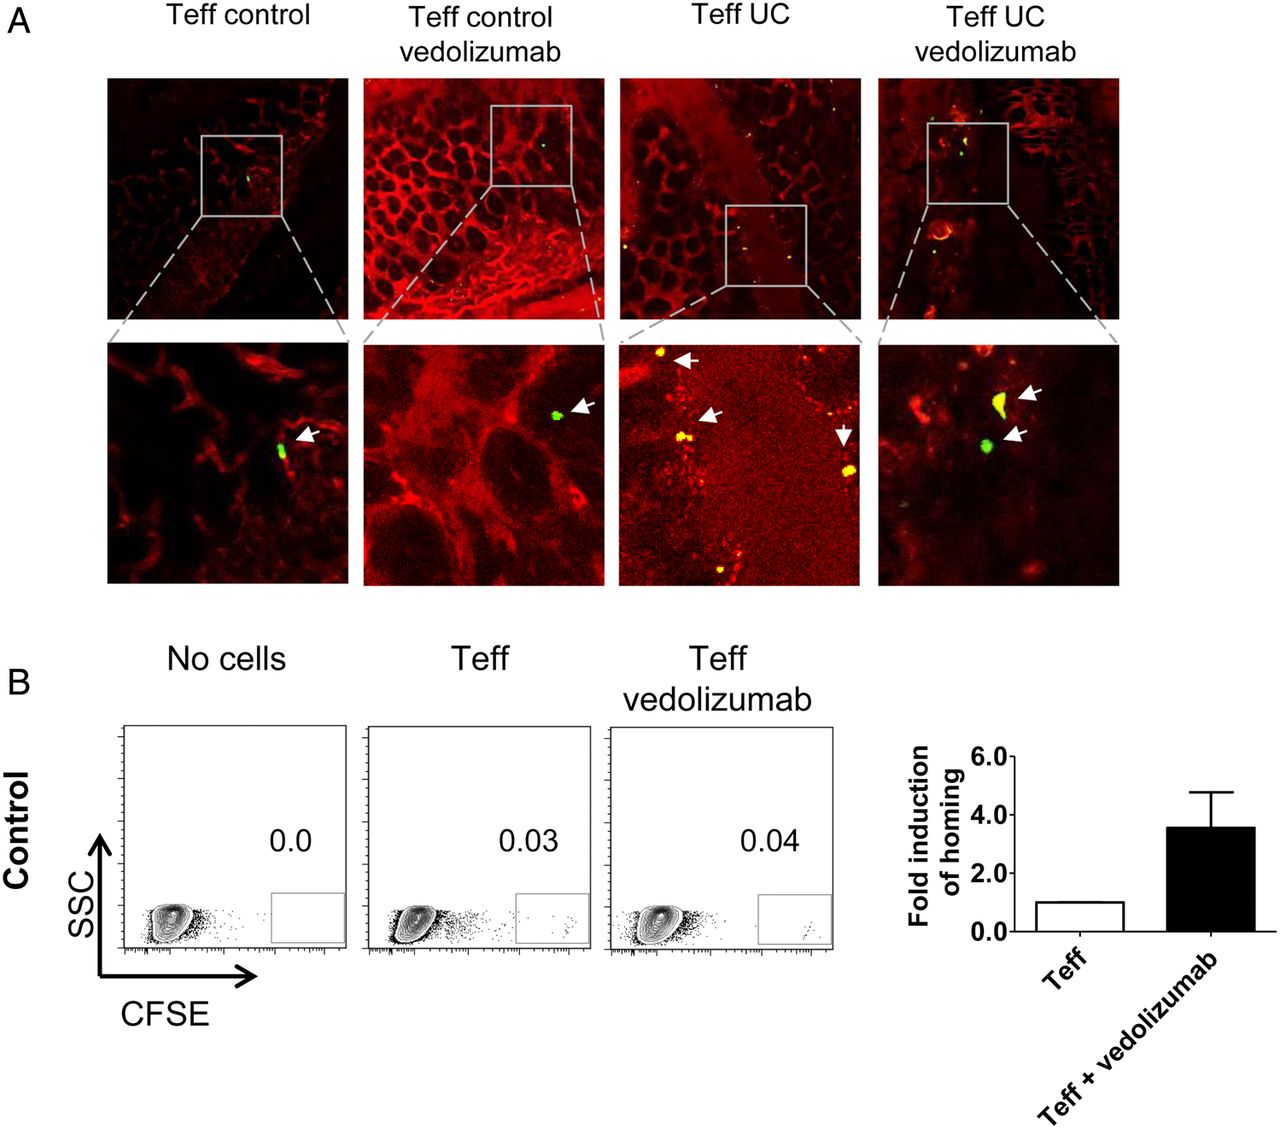
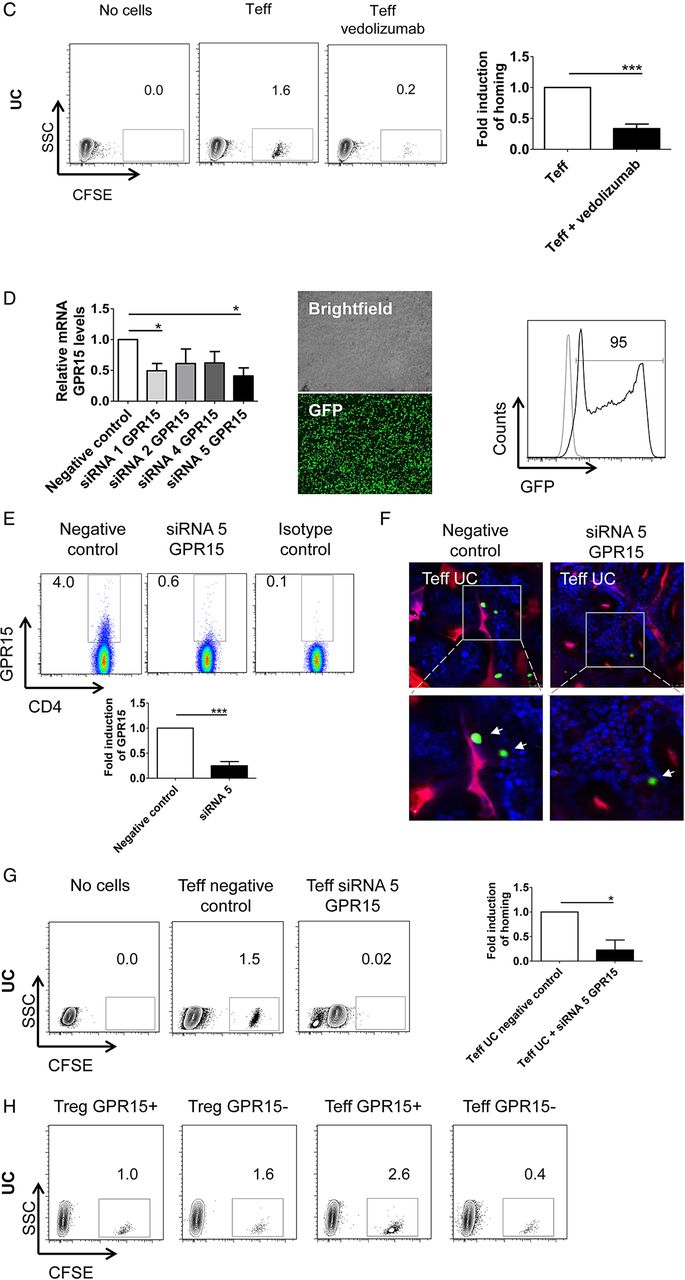

Vedolizumab suppresses homing of human CD4+CD25− effector T (Teff) and CD4+CD25+ regulatory T (Treg) cells from patients with UC but not controls to the inflamed colon, while GPR15 knockdown only affects Teff cell homing. (A) Confocal in vivo imaging of homing of CFSE-labelled CD4+CD25− Teff cells to the inflamed colon in dextran sodium sulfate (DSS)-treated NSG mice. While homing of these cells was augmented in mice given UC-derived cells as compared with controls, treatment of NSG mice with vedolizumab inhibited homing of cells to the colon in patients with UC but not controls. (B) FACS analysis of lamina propria cells from DSS-treated NSG mice in the presence or absence of Teff cell transfer from controls and vedolizumab treatment as indicated. Left panels: Representative FACS analysis of CFSE+ human CD4+CD25− T cells from controls in the lamina propria of DSS-treated NSG mice. Right panel: Quantitative analysis of homing of CFSE-labelled human CD4+CD25− T cells from controls to the inflamed colon in DSS-treated NSG mice in the presence or absence of vedolizumab treatment (n=4). (C) FACS analysis of lamina propria cells from DSS-treated NSG mice in the presence or absence of Teff cell transfer from patients with UC and vedolizumab treatment as indicated. Left panels: Representative FACS analysis of CFSE+ human CD4+CD25− T cells from patients with UC in the lamina propria of DSS-treated NSG mice. Right panel: Quantitative analysis of homing of CFSE-labelled CD4+CD25− T cells from patients with UC to the inflamed colon in DSS-treated NSG mice in the presence or absence of vedolizumab treatment (n=4). (D) Left panel: CFSE+ human CD4+ T cells (n=3) were transfected with GPR15-specific siRNA followed by analysis of GPR15 mRNA expression by PCR. Significant differences in GPR15 expression upon transfection with siRNA1 and siRNA5 are indicated. Middle and right panels: Representative images and FACS analysis of GFP positive T cells indicating successful transfer of siRNA into the T cells. (E) Quantitative analysis of GPR15 knockdown at the protein level. Upper panels: Representative FACS analysis. Lower panel: Quantitative analysis of GPR15 downregulation. (F) Confocal in vivo imaging of homing of CD4+CD25− Teff cells to the inflamed colon in DSS-treated mice in the presence or absence of GPR15 knockdown. (G) FACS analysis of lamina propria cells from DSS-treated NSG mice in the presence or absence of Teff cell transfer from patients with UC and GPR15 siRNA treatment as indicated. Left panels: Representative FACS analysis of CFSE+ human CD4+CD25− Teff cells from patients with UC in the lamina propria of DSS-treated NSG mice. Right panel: Quantitative analysis of homing of CFSE-labelled CD4+CD25− T cells from patients with UC to the inflamed colon in DSS-treated NSG mice in the presence or absence of GPR15 siRNA treatment (n=3). (H) FACS analysis of lamina propria cells from DSS-treated NSG mice after adoptive transfer of purified UC GPR15+ or GPR15− Treg and Teff cells as indicated. CD4+ cells from four patients with UC were pooled and sorted by FACS. Tregs were defined as CD4+CD25+ and Teffs as CD4+CD25−. (I) Confocal in vivo imaging of homing of CFSE-labelled Treg-enriched CD4+CD25+ T cells to the inflamed colon in DSS-treated NSG mice. While homing of these cells was augmented in mice given UC-derived cells as compared with controls, treatment of NSG mice with vedolizumab inhibited homing of cells to the colon in patients with UC but not controls. (J) FACS analysis of lamina propria cells from DSS-treated NSG mice in the presence or absence of Treg cell transfer from controls and vedolizumab treatment as indicated. Left panels: Representative FACS analysis of CFSE+ human CD4+CD25+ T cells from controls in the lamina propria of DSS-treated NSG mice. Right panel: Quantitative analysis of homing of CFSE-labelled human Treg-enriched CD4+CD25+ T cells from controls to the inflamed colon in DSS-treated NSG mice in the presence or absence of vedolizumab treatment (n=5). The control sample without cell transfer is from the same experiment as in 6B. (K) FACS analysis of lamina propria cells from DSS-treated NSG mice in the presence or absence of Treg cell transfer from patients with UC and vedolizumab treatment as indicated. Left panels: Representative FACS analysis of CFSE+ human CD4+CD25+ T cells from patients with UC in the lamina propria of DSS-treated NSG mice. Right panel: Quantitative analysis of homing of CFSE-labelled Treg-enriched CD4+CD25+ T cells from patients with UC to the inflamed colon in DSS-treated NSG mice (n=5). T cells from patients with UC were isolated and adoptively transferred to NSG mice in the presence or absence of vedolizumab treatment. Lamina propria cells from NSG mice were then analysed by FACS analysis for CFSE+ cells. Significant differences are indicated. (L) FACS analysis of lamina propria cells from DSS-treated NSG mice in the presence or absence of Treg cell transfer from patients with UC and GPR15 siRNA treatment as indicated. Left panels: Representative FACS analysis of CFSE+ human CD4+CD25+ T cells from patients with UC in the lamina propria of DSS-treated NSG mice. Right panel: Quantitative analysis of homing of CFSE-labelled Treg-enriched CD4+CD25+ T cells from patients with UC to the inflamed colon in DSS-treated NSG mice (n=3). T cells from patients with UC were isolated and adoptively transferred to NSG mice in the presence or absence of GPR15 siRNA treatment. Lamina propria cells from NSG mice were then analysed by FACS analysis for CFSE+ cells.
Likewise, we explored the effect of vedolizumab on homing of Treg enriched CD4+CD25+ cells in our humanised mouse model. Again, homing of cells from controls was not affected by vedolizumab treatment (figure 6I, J). On the contrary, in patients with UC Treg homing was suppressed significantly by vedolizumab and even more markedly than in UC Teff cells (figure 6I, K). In contrast to α4β7 blockade, suppression of GPR15 expression on UC Treg cells via siRNA had no effect on homing of these cells to the inflamed colon (figure 6L). Similarly, no difference in homing was noted between GPR15+ and GPR15− UC Treg cells (figure 6H) suggesting that α4β7 rather than GPR15 controls gut homing of UC Treg cells in vivo. Although we have shown above, that CD4+CD25+ T cells represent a population highly enriched with Treg cells, we aimed to confirm our findings for vedolizumab treatment with CD4+CD25+CD127dim/- Treg enriched cells by adoptive transfer of accordingly isolated cells from controls and patients with UC. We could show that homing of Treg cells from controls was not altered by vedolizumab treatment, while vedolizumab significantly inhibited homing of Treg cells from patients with UC to the inflamed mucosa (see online supplementary figure S2).
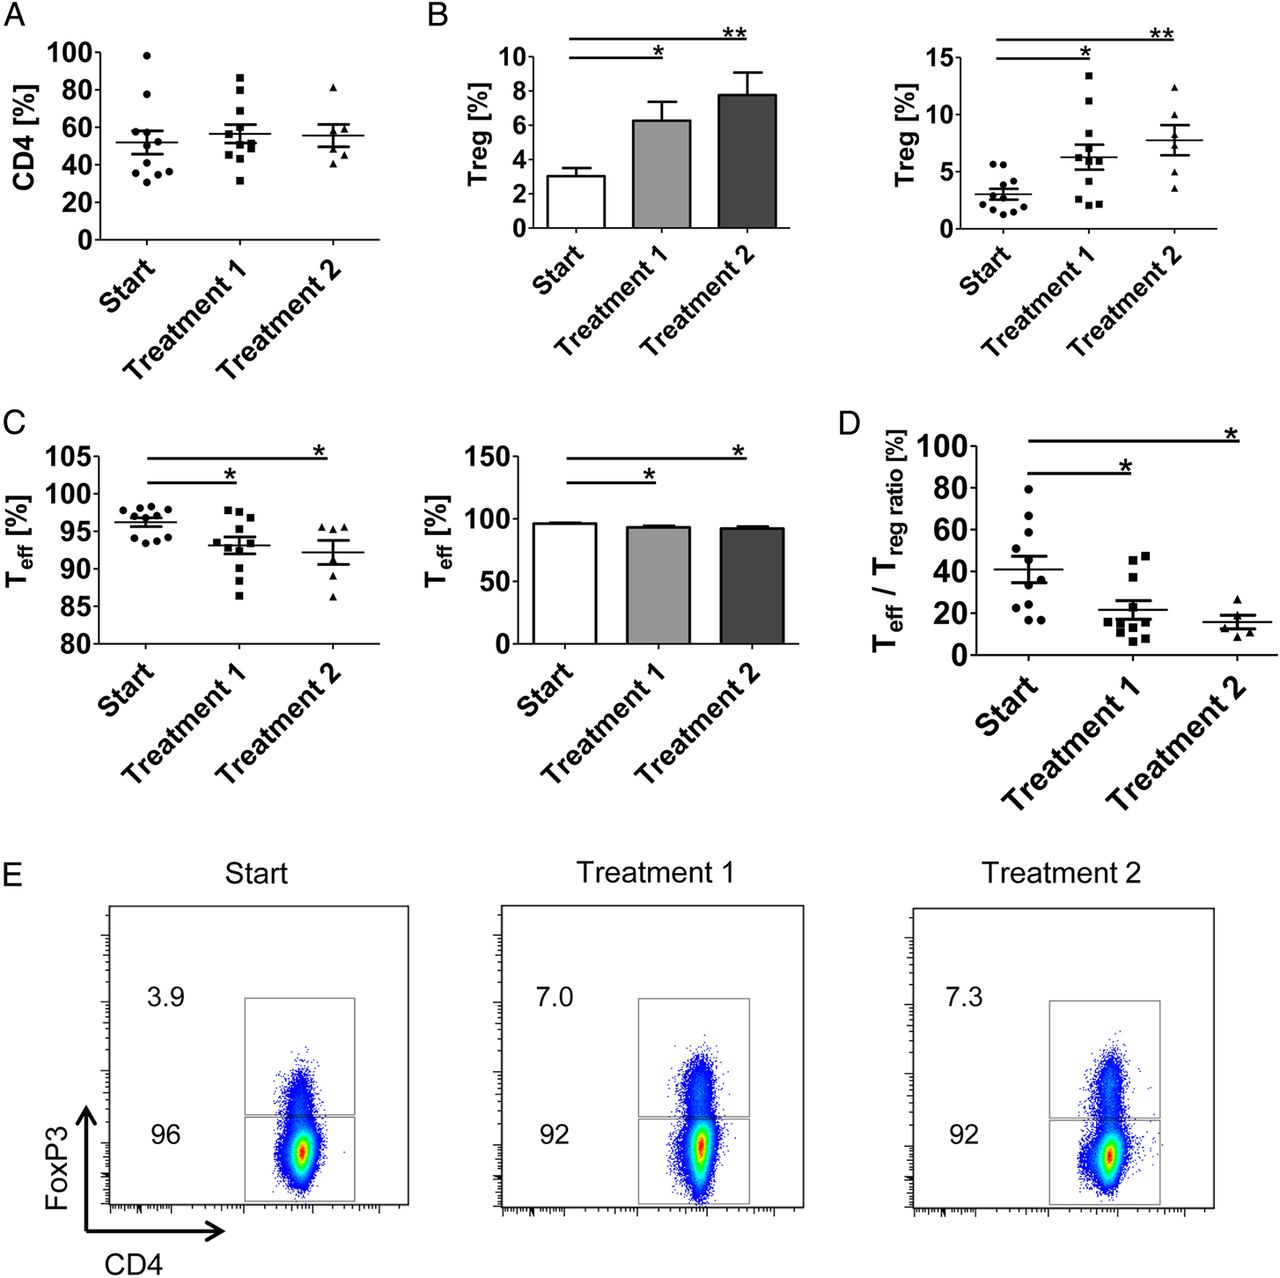
The above findings suggested vedolizumab-induced blockade of homing of UC Treg cells to the inflamed colon. To analyse whether such inhibition of Treg homing leads to accumulation of Treg cells in the peripheral blood, we studied in a final series of experiments the number of FoxP3-expressing Treg cells in patients with UC which were clinically treated with vedolizumab (figure 7). Clinical vedolizumab treatment resulted in an induction of FoxP3+ CD4+ Treg cells in the peripheral blood already after the first clinical infusion therapy (figure 7B, E). This accumulation of Treg cells was associated with reduced CD4+FoxP3− Teff cell numbers (figure 7C). Furthermore, a significant decrease of the ratio between Teff and Treg cells was detected after one and two infusions in vedolizumab-treated patients with UC (figure 7D) suggesting that α4β7 integrin blockade markedly affects the balance between systemic Teff and Treg cell responses in UC.

Vedolizumab treatment of patients with UC results in increased numbers of regulatory T (Treg) cells in the peripheral blood. (A–C) Patients with clinically active UC were treated intravenously with 300 mg vedolizumab at weeks 0, 2 and 6. Peripheral blood cells were isolated before infusions and analysed for the number of CD4+ T cells (A), FoxP3+ Treg CD4+ cells (B) and FoxP3− Teff CD4+ cells (C) by FACS analysis. Significant differences are indicated. (D) Ratio between Teff cells and Treg cells in patients with UC upon vedolizumab therapy at weeks 0, 2 and 6. Significant differences are indicated. (E) Representative FACS analysis of FoxP3+ Treg cells in peripheral blood in a patient with UC before and after treatment with vedolizumab.
Discussion
The role of T lymphocyte homing to the inflamed gut in the pathogenesis of IBD is incompletely understood.13 ,23 ,48 This is particularly true for Treg cells whose homing capacities to the inflamed tissue are important for suppression of mucosal inflammation29 and adoptive Treg transfer approaches in IBD.32 In the present study, we assessed the homing capacities of human Treg cells in patients with UC and compared the results with those of Teff cells. By using a novel system to analyse homing of human T cells in humanised NSG mice in vivo, we showed that UC Teff cell homing is controlled by α4β7 and GPR15, while we uncover an important regulatory role of α4β7 integrins rather than GPR15 in controlling homing of UC Treg cells to the inflamed gut. Our findings suggest new avenues for assessment of gut homing in vivo by using humanised mouse models.
Initial studies revealed that expression of α4β7 was increased on Treg cells in patients with UC as compared with controls. This could be due to the effects of TGF-β1, a cytokine increasingly present in the chronically inflamed mucosa in UC,49 as this cytokine significantly increased expression of α4β7 on Treg cells in the presence of the proinflammatory cytokines IL-6 and IL-21. In contrast to Treg cells, however, expression of α4β7 was reduced on Teff cells in patients with UC as compared with controls, although subsets of both cell types expressed α4β7 in patients with UC.
Given the clinical success of the α4β7 neutralising antibody vedolizumab for therapy of patients with UC,23 it was likely that such antibody treatment would inhibit homing of Teff cells to the human colon. However, the effects of such treatment on in vivo homing of Treg cells remained largely unknown. To further study the functional relevance of α4β7 for T cell homing in vivo, we developed a new model for T cell analysis in immunodeficient, humanised NSG (NOD.Cg-Prkdcscid Il2rgtm1Wjl/SzJ) mice with experimental DSS colitis. Although this model could not be used for analysis of human T cell homing after intravenous administration, it was well suited to determine gut homing upon cell transfer via the ileocolic artery. As NSG mice lack murine B cells and T cells,37 this model excludes competition between human and mouse lymphocytes for receptors on endothelial cells. Moreover, this approach may prevent immune reactions to the transferred cells by the absence of murine lymphocytes and NK cells. Finally, this system is suitable for analysis of human T cell homing via α4β7, as human α4β7 has been previously shown to bind to murine MAdCAM-1 due to homologous integrin binding domains between murine and human MAdCAM-1.46 This was confirmed by our functional data showing a high level of binding of α4β7 integrin on human T cells to murine MAdCAM-1 as well as VCAM-1.
Our model differs in many aspects from a very recently described model on assessment of T cell homing50 that used intravenous injection of human T cells in a xenograft model by implanting fetal small bowel tissue into C.B-17 SCID mice. While this model has the potential advantage of allowing homing of human T cells via human receptors to the xenograft, it remains unclear how effective human T cells can escape from lung capillaries in this model after intravenous transfer. In addition, further information is needed how adoptive intravenous transfer of human T cells leads to specific, efficient homing to the xenograft in the absence of vessel anastomosis. Therefore, our model of T cell homing may hold significant advantages for quantitative assessment of human T cell homing to the inflamed gut, although certain limitations exist as discussed above.
By studies in such humanised NSG mice we found that homing of human Treg cells from healthy donors upon intra-arterial injection is critically dependent on DSS treatment probably due to DSS-induced upregulation of the α4β7 receptor MAdCAM1 in the murine colon. Interestingly, vedolizumab treatment did not affect homing of Teff cells or Treg cells from controls to the inflamed gut in vivo. This finding suggests that α4β7-dependent gut homing of T cells may be compensated by other homing receptors such as CCR5, CCR9 or GPR15 in this context. However, we detected a significant induction of the homing capacity of UC Treg cells as compared with Treg cells from controls. Such augmented homing is likely due to upregulation of α4β7 on Treg cells in UC, as vedolizumab treatment significantly suppressed UC Treg homing to the inflamed gut in vivo. As expected from clinical observations, vedolizumab also significantly inhibited colonic homing of Teff cells from patients with UC, although UC Teff cells expressed lower levels of α4β7 than control Teff cells.
These observations suggest that in vivo homing of Teff and Treg cells in UC is critically dependent on α4β7 integrin expression. The augmented homing of Treg cells in UC may contribute to the previously described reduction of blood Treg cells in UC as well as to their accumulation in the mucosa in active disease.29 In spite of the pronounced decline in Treg homing caused by vedolizumab in our humanised mouse model, clinical studies23 do not support the idea that vedolizumab-induced reduction of Treg homing might lead to a negative effect on the resolution of inflammation, possibly because it is more the mucosal proportion of Treg and Teff cell populations than the absolute number of Tregs, which is relevant in this context.29 ,51 Additionally, it is possible that Treg numbers in the inflamed gut in UC are largely controlled by local differentiation and expansion of inducible Tregs51 rather than by Treg homing.
Similarly to α4β7, GPR15 expression was upregulated on Treg cells in UC. By using knockout mice this receptor had been previously identified as a crucial regulator of homing of murine Treg cells to the colon.33 Therefore, it appeared likely that GPR15 would control homing of Treg cells to the inflamed colon. As the ligand for GPR15 is not known, it was not possible to use an antibody with proven blockade of binding to its ligand in our experiments. We therefore decided to use siRNA knockdown, which induced a marked and significant downregulation of GPR15.
Unexpectedly, however, siRNA-mediated suppression of GPR15 did not result in reduced homing of UC Treg cells to the inflamed colon in humanised mice in vivo. The relevance of this observation was highlighted by the finding that little or no GPR15+ FoxP3+ regulatory T cells were noted by immunohistochemistry in the inflamed colon of patients with UC. In contrast, homing of Teff cells from patients with UC with siRNA knockdown of GPR15 was significantly suppressed. Similarly to our findings on MAdCAM-1, these results suggested that the currently unknown GPR15 ligand is evolutionary conserved between mice and humans. To our best knowledge, this is the first report of a functional relevance for GPR15 in colonic homing of human UC Teff cells. Consistently, a recent study could not detect GPR15 on colonic Treg cells in UC but showed abundant GPR15 expression on mucosal Teff cells in UC.52 Collectively, these findings suggested that GPR15 expression is not of crucial relevance for mediating UC Treg homing to the inflamed gut in vivo. Although the reason for this observation remains currently unclear, it is possible that GPR15-mediated homing of human T cells requires co-receptors or additional molecules that are not expressed on UC Treg cells. However, these results propose GPR15 as an interesting therapeutic candidate for UC as the idea of selectively blocking Teff cell homing to the colon holds promising perspectives.
Taken together, our findings uncover that α4β7 rather than GPR15 appears to be crucial for gut homing of UC Treg cells, while both adhesion molecules control homing of UC Teff cells. In contrast to controls, vedolizumab treatment impaired gut homing of Treg cells from patients with UC in humanised mice in vivo. Consistently, clinical vedolizumab therapy led to Treg accumulation in the peripheral blood in UC that may limit expansion of Teff cells in the circulation and thereby favour suppression of systemic inflammation in this disease.
Acknowledgments
The research of IA, CB, CN, CV, GS and MFN was supported by the Clinical Research Group CEDER of the German Research Council (DFG), the IZKF, the DFG topic programme on Microbiota, the Emerging Field Initiative, the ELAN programme of the University Erlangen-Nürnberg and the DFG Collaborative Research Centers 643 and 796. The authors thank Mrs Karin Enderle for excellent technical support.
References
Supplementary materials
Supplementary Data
This web only file has been produced by the BMJ Publishing Group from an electronic file supplied by the author(s) and has not been edited for content.
- Data supplement 1 - Online supplement
- Data supplement 2 - Online table 1
- Data supplement 3 - Online video 1
Footnotes
CN, IA and MFN contributed equally.
Contributors AF and SZ performed experiments; RA, TR, CB, SH, RL-P, AW, CB, GS, CN, IA and MFN provided clinical samples, protocols, reagents or designed experiments; AF, SZ, CN, IA and MFN analysed data and discussed and interpreted findings; MFN directed the work and wrote the manuscript.
Funding This work was supported by the Clinical Research Group 257 CEDER of the Deutsche Forschungsgemeinschaft.
Competing interests None declared.
Ethics approval Ethical committee of the University Hospital, Friedrich-Alexander-Universität Erlangen-Nürnberg, Germany.
Provenance and peer review Not commissioned; externally peer reviewed.